Optiver Data Engineer Interview Guide (2026): Process, Questions & Preparation Tips


Introduction
Optiver data engineers sit at the intersection of high performance trading systems and large scale data platforms. The role is not just about moving data from point A to point B. It is about building reliable, low latency, and well governed data systems that traders, researchers, and decision makers rely on in real time. As a result, Optiver interviews are designed to test both deep technical fundamentals and how you reason under performance and reliability constraints.
This guide walks through the Optiver data engineer interview process end to end, highlights the most common Optiver style interview questions with a strong focus on the specific skills Optiver cares about including advanced SQL, data pipeline design, streaming concepts, and clear technical communication. Each section is structured to help you understand what is being evaluated, why it matters in a trading environment, and how to demonstrate senior level judgment during interviews.
Optiver Data Engineer Interview Process
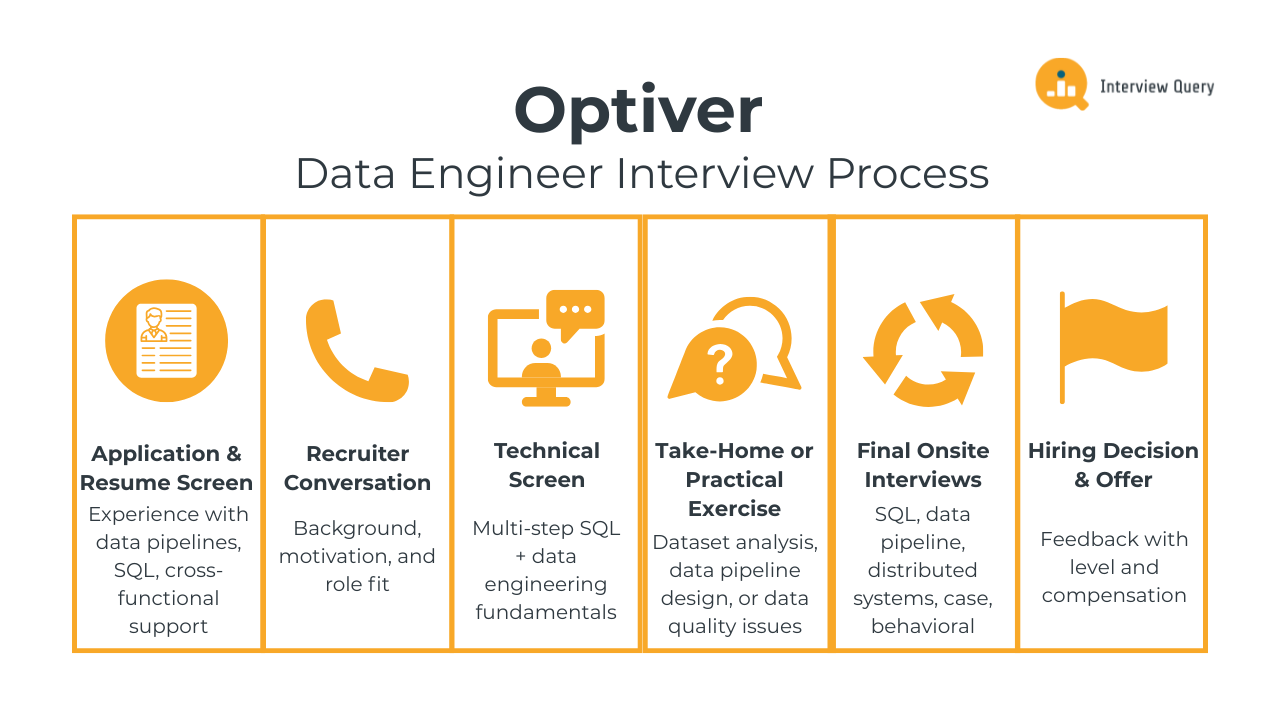
The Optiver data engineer interview process evaluates your ability to design reliable data systems, reason about performance and correctness, and communicate technical decisions clearly in a fast moving trading environment. Interviews focus heavily on SQL, data pipeline design, distributed systems fundamentals, and behavioral ownership. Most candidates complete the process within three to five weeks, depending on team needs and scheduling. Below is a breakdown of each stage and what Optiver interviewers typically assess throughout the process.
Application and Resume Screen
During the resume review, Optiver looks for strong fundamentals in data engineering rather than surface level tool familiarity. Recruiters focus on experience building production data pipelines, writing complex SQL, working with large datasets, and supporting analytics or research teams. Backgrounds that show exposure to high reliability systems, performance constraints, or data quality ownership tend to stand out. Clear impact statements are especially important.
Tip: On your resume, describe what broke before you fixed it. Optiver engineers care deeply about failure modes, so showing how you reduced data loss, latency spikes, or incorrect metrics signals that you already think like someone protecting trading-critical systems.
Initial Recruiter Conversation
The recruiter call is a short, non technical conversation designed to understand your background, motivation for Optiver, and general fit for the role. Expect questions about your current work, why you are interested in trading or market making, and your experience with data pipelines and analytics. Recruiters also confirm role expectations, location preferences, and interview logistics.
Tip: Be specific about why low-latency and correctness excite you. Generic interest in finance is less compelling than explaining why building systems where seconds and accuracy matter is the type of pressure you perform best under.
Technical Screen
The technical screen usually includes one or two interviews focused on SQL and practical data engineering fundamentals. You may be asked to write multi step queries using joins and window functions, reason about query performance, or explain how you would transform and validate incoming datasets. Interviewers care as much about your approach and clarity as the final answer.
Tip: When writing SQL, talk about how the query behaves on millions of rows, not just correctness. Mention scan reduction, join cardinality, or late filtering. This signals that you’ve actually operated pipelines at scale, not just solved interview questions.
Take Home Assignment or Practical Exercise
Some Optiver teams include a take homes or practical exercise, especially for senior or specialized roles. These tasks typically involve analyzing a dataset, designing a small data pipeline, or identifying data quality issues. Submissions are evaluated on correctness, structure, and how clearly you explain trade offs and next steps.
Tip: Treat this like something that will run during market hours. Explicitly call out what you would monitor, what alerts you would add, and what assumptions could silently fail. This mindset strongly differentiates senior candidates
Final Onsite Interviews
The final interview loop is the most in depth stage of the Optiver data engineer process. It typically consists of four to five interviews, each lasting 45 to 60 minutes. These rounds assess technical depth, system design judgment, and how you operate under ambiguity and pressure.
SQL and data modeling round: You will work through complex SQL problems involving large tables, time based data, and aggregations. Tasks may include computing rolling metrics, identifying outliers, or designing schemas that support efficient querying. Interviewers evaluate correctness, readability, and performance awareness.
Tip: Explain how you would validate results against known baselines or invariants. At Optiver, engineers don’t trust numbers until they’ve been sanity-checked against expectations.
Data pipeline and system design round: This round focuses on end to end data architecture. You may be asked to design batch or streaming pipelines, handle schema evolution, or ensure data reliability under failure scenarios. Expect discussion around trade offs between latency, cost, and correctness.
Tip: Always describe how your system behaves when something goes wrong. If you only explain the happy path, it suggests you haven’t owned production pipelines.
Distributed systems and performance round: Interviewers assess your understanding of distributed data processing, including partitioning, back pressure, and throughput limitations. You may discuss tools like Spark or streaming frameworks conceptually, even if specific technologies vary by team.
Tip: Tie performance discussions back to tail latency, not averages. Trading systems fail at the edges, and engineers who think in percentiles stand out immediately.
Applied problem solving or case round: You may be given an ambiguous scenario such as delayed data, inconsistent metrics, or downstream consumer complaints. The goal is to evaluate how you break down problems, prioritize investigation steps, and communicate uncertainty.
Tip: Start by identifying which data you trust least and why. This mirrors how real incidents are handled internally and shows strong debugging instincts.
Behavioral and collaboration round: This interview explores how you work with traders, researchers, and other engineers. Expect questions about handling incidents, balancing speed with correctness, and resolving disagreements on technical decisions.
Tip: Emphasize how you make trade-offs visible to stakeholders rather than hiding complexity. Trust is built when others understand the risks you’re managing.
Hiring Decision and Offer
After the final interviews, each interviewer submits written feedback independently. The hiring team reviews your performance across technical depth, communication clarity, and cultural alignment. If approved, Optiver determines level and compensation based on experience and team needs. In some cases, team matching may occur after the interview loop.
Tip: If you care about a particular data domain, state it clearly. Optiver values placing engineers where they can take ownership quickly, not just filling headcount.
Looking for hands-on problem-solving? Test your skills with real-world challenges from top companies. Ideal for sharpening your thinking before interviews and showcasing your problem solving ability.
Challenge
Check your skills...
How prepared are you for working as a Data Engineer at Optiver?
Optiver Data Engineer Interview Questions
The Optiver data engineer interview focuses on how well you can build, query, and reason about data systems that operate under strict performance and reliability constraints. Questions span advanced SQL, data pipeline design, distributed systems fundamentals, and real world debugging scenarios. Optiver places heavy emphasis on correctness under time pressure, clear reasoning, and the ability to explain trade offs that affect downstream trading and research workflows. The goal is to assess not only technical skill, but also how you think through ambiguity and communicate decisions in high impact environments.
Read more: Data Engineer Interview Questions and Answers
SQL and Analytics Interview Questions
In this part of the interview, Optiver evaluates your ability to work with large, time sensitive datasets such as trades, market events, and derived metrics. SQL questions often involve window functions, time based aggregations, ranking logic, and careful handling of edge cases. Interviewers look for clean structure, correct assumptions, and awareness of performance implications rather than overly clever syntax.
Select the 2nd highest salary in the engineering department
This question tests whether you understand ranking logic, de-duplication, and how ties affect results. At Optiver, similar logic is used when ranking instruments, traders, or metrics where duplicate values are common. You would first filter to the engineering department, then apply a ranking function like
DENSE_RANK()ordered by salary descending and select rank equals two. Alternatively, you can useORDER BY salary DESC LIMIT 1 OFFSET 1, but that approach fails when ties exist. Explaining the difference shows awareness of real data behavior.Tip: Call out why
DENSE_RANKis safer thanROW_NUMBERwhen values can repeat. This shows you think about data correctness, not just passing edge-free examples.-
This question tests group-level reasoning and efficient filtering. Optiver asks questions like this to see if you can reason about aggregated conditions, which mirrors how quality thresholds are applied to trading signals or monitoring metrics. You would group results by
query_idand use an aggregate condition such asHAVING MAX(rating) < 3, then divide the qualifying query count by the total number of queries to compute a percentage. This approach avoids row-level scans and keeps logic clean.Tip: Explain why you prefer aggregate conditions over row filters. At Optiver, inefficient logic shows up as delayed dashboards or missed signals, so efficiency is not optional, it’s operational hygiene.
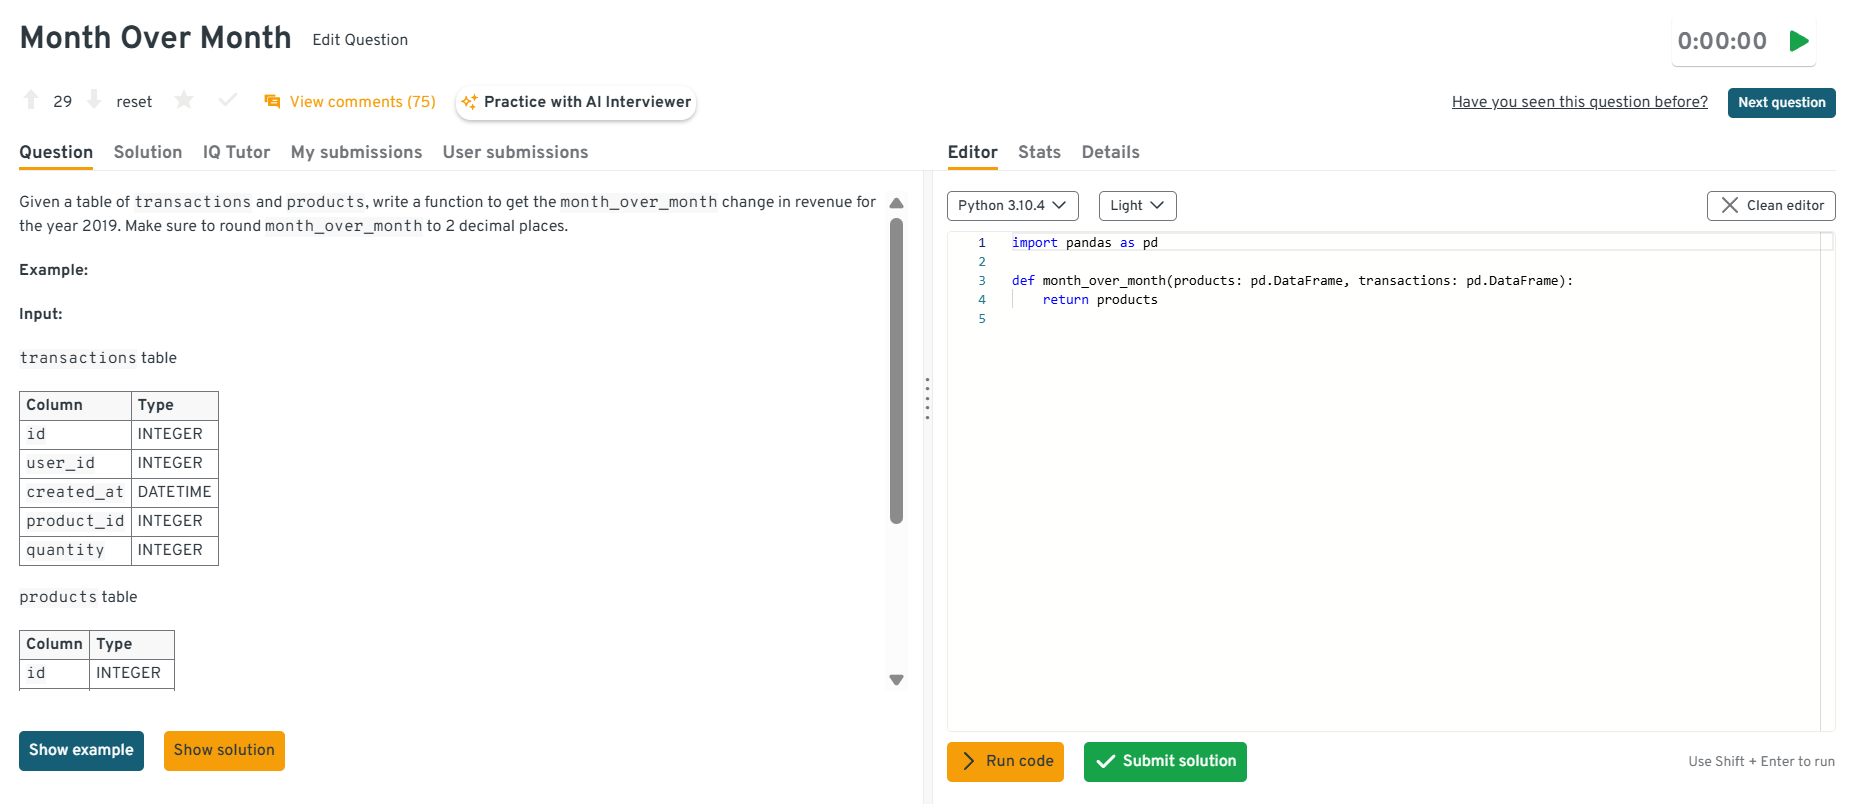
Find the month_over_month change in revenue for the year 2019.
This question evaluates time-based windowing and your ability to reason about trends. At Optiver, similar logic is used to track volume, PnL, or latency changes over time. You would first aggregate revenue by month using
DATE_TRUNC, then applyLAG()over ordered months to compute the difference or percentage change. A strong answer also explains why the first month should be excluded since there is no prior baseline, which reflects clean analytical thinking.Tip: Explicitly talk about baseline validity. In trading systems, incorrect baselines cause false alarms, so engineers who proactively guard against misleading comparisons earn trust quickly.
Head to the Interview Query dashboard to practice the full set of data engineering interview questions. With hands-on SQL problems, data pipeline scenarios, system design case studies, and behavioral prompts, plus built-in code testing and AI-guided feedback, it’s one of the most effective ways to sharpen your reasoning and decision-making skills for the Optiver data engineer interview.
How would you compute day over day changes in trading volume while handling non trading days?
This question tests whether you understand real market calendars rather than idealized time series. Optiver cares about this because naïve comparisons can create misleading signals. You should explain joining trading data to a calendar table or explicitly filtering to trading days so that volume is compared against the previous valid trading session. This avoids false spikes caused by weekends or holidays and ensures metrics align with actual market behavior.
Tip: Mention how bad calendar logic can trigger false trading alerts. This shows you understand the downstream consequences of analytical mistakes, not just how to fix them.
Compute click-through rates (CTR) across queries
This question evaluates whether you can design performant analytical queries at scale. At Optiver, similar patterns appear when calculating hit rates, fill rates, or signal effectiveness. You would pre-aggregate impressions and clicks at the query level, then compute CTR as clicks divided by impressions, ensuring joins are done on deduplicated data. Discussing index usage, pre-aggregation, or materialized views shows you understand how analytical queries behave in production environments.
Tip: Tie performance choices to operational impact. Saying “this avoids repeated scans during market hours” immediately signals that you design analytics with trading-time constraints in mind.
Want to get realistic practice on SQL and data engineering questions? Try Interview Query’s AI Interviewer for tailored feedback that mirrors real interview expectations.
Data Pipeline and System Design Interview Questions
These questions assess how you design and reason about end to end data systems. Optiver interviewers focus on reliability, latency, scalability, and failure handling because data pipelines directly support trading decisions and real time analytics.
Design a data pipeline that ingests real time market data and makes it available for analytics.
This question tests your ability to reason about end to end system design under latency and correctness constraints. At Optiver, market data is time sensitive, so you need to explain ingestion via streaming, validation at the edge, transformation with minimal delay, and storage that supports both real time and historical analysis. A strong answer walks through trade offs between streaming and micro batch processing, how schemas evolve safely, and how monitoring detects dropped or delayed events before downstream consumers are affected.
Tip: Don’t just list components. Explain what happens when market data bursts, arrives late, or arrives twice. At Optiver, engineers are trusted based on how well they design for bad days, not normal ones.
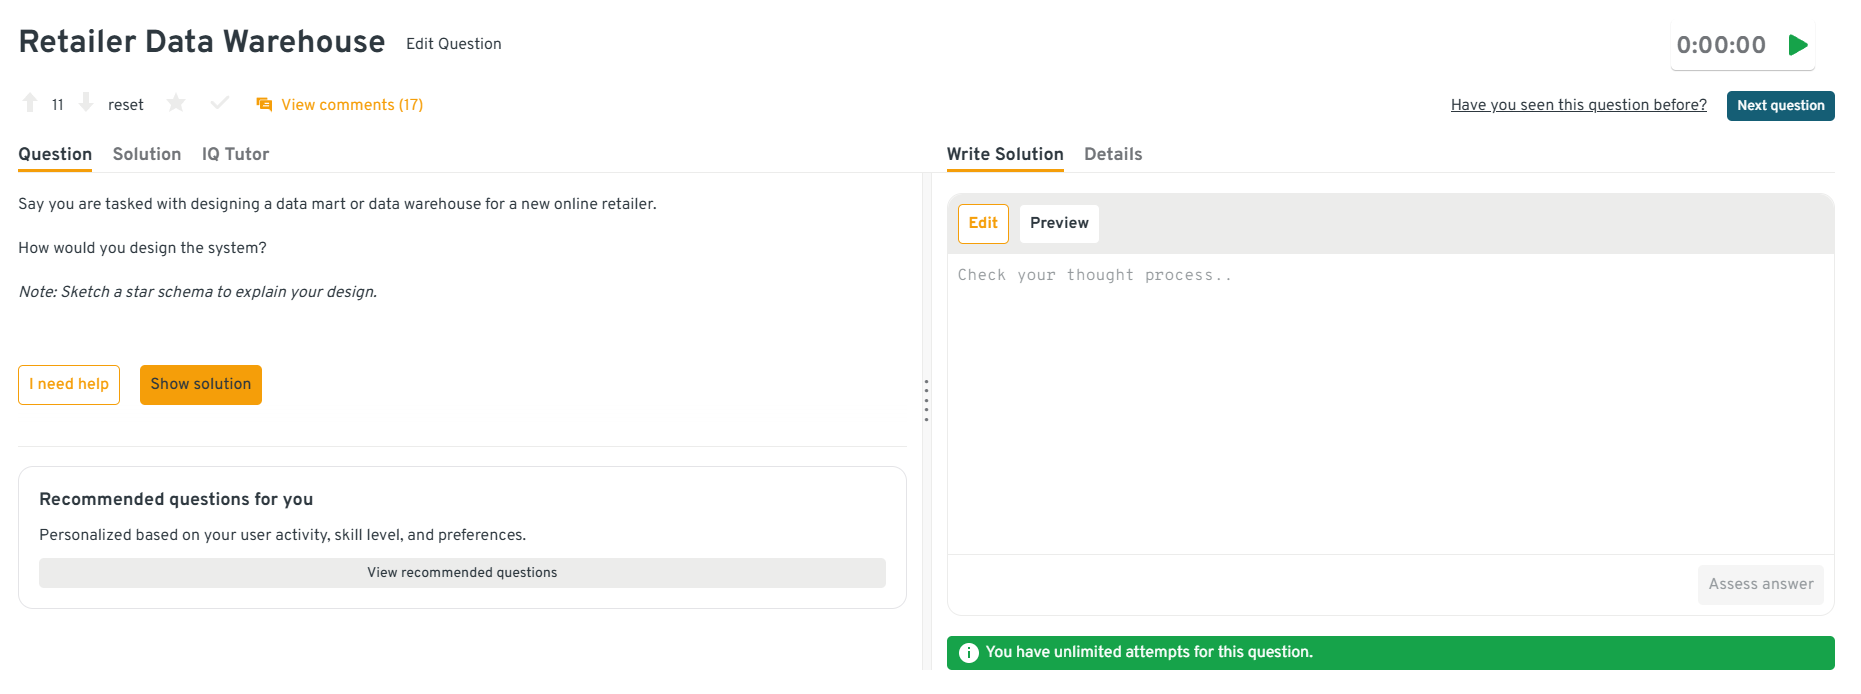
How would you design a data mart or data warehouse for a new online retailer using a star schema?
This question evaluates your data modeling judgment and ability to optimize analytical access patterns. Optiver asks this to see if you can separate facts from dimensions in a way that supports fast aggregation and clear business logic. You should explain choosing a central fact table for transactions and dimension tables for time, product, or user attributes, while keeping joins predictable and schemas stable. Translating this to Optiver, similar thinking applies when modeling trades, instruments, and market attributes.
Tip: Talk about how bad modeling decisions force traders or researchers to work around the data. At Optiver, good schemas reduce cognitive load and prevent misinterpretation, which is just as important as query speed.
Head to the Interview Query dashboard to practice the full set of data engineering interview questions. With hands-on SQL problems, data pipeline scenarios, system design case studies, and behavioral prompts, plus built-in code testing and AI-guided feedback, it’s one of the most effective ways to sharpen your reasoning and decision-making skills for the Optiver data engineer interview.
How would you design a database schema to track and store user click events for a web application?
This question tests event modeling and scalability. Optiver uses event based data extensively, so interviewers want to see how you think about append only designs, timestamps, and identifiers. A strong answer describes a wide event table with immutable records, clear primary keys, and indexes on time and entity IDs to support high volume ingestion and downstream analysis. You should also mention how you would handle schema evolution as new event fields appear.
Tip: Explicitly say how you prevent accidental updates or deletes. In trading systems, immutability is a safety guarantee, not just a design preference.
-
This question evaluates aggregation strategy and incremental processing. At Optiver, similar logic is used to compute rolling metrics without recomputing everything. You should explain reading partitioned data, computing incremental aggregates, and storing results in summary tables optimized for dashboards. Handling late arriving data and ensuring consistency across time windows is key.
Tip: Explain how you guarantee consistency across time windows during partial failures. Optiver values engineers who design metrics that never silently drift.
How would you design a backfill process without disrupting live data consumers?
This question tests operational judgment and risk management. Optiver asks this because backfills are common but dangerous in high availability systems. A strong answer explains isolating backfills using separate tables or partitions, validating results before swapping, and communicating timing clearly to downstream teams. Emphasizing staged rollouts reduces the risk of breaking critical analytics during trading hours.
Tip: Always mention how you would detect if a backfill went wrong after deployment. At Optiver, rollback confidence matters as much as the backfill itself.
Watch next: Amazon Data Engineer Streaming and Analytics Interview
In this mock interview, Jitesh, a data engineer at Amazon works through real-world streaming and analytics questions with Rob, the founder of Remot. The session shows how clear communication, structured reasoning, and trade-off awareness set strong candidates apart. Watch how a data engineer approaches streaming and analytics problems step by step, and apply these practical problem-solving techniques to your own interview preparation.
Distributed Systems and Performance Interview Questions
Optiver uses these questions to evaluate whether you understand the fundamentals behind scalable data systems and how design decisions affect latency, reliability, and downstream users in performance sensitive environments.
How do partitioning strategies affect performance in distributed data processing?
This question tests whether you understand how data distribution impacts system efficiency. At Optiver, poor partitioning can introduce skew that slows down critical analytics during market hours. You should explain how uneven partitions overload certain workers, increase processing time, and waste resources, while good partitioning improves parallelism and predictability. Discuss choosing partition keys based on access patterns and cardinality rather than convenience.
Tip: Go beyond “skew is bad.” Explain how skew shows up operationally, like one worker lagging and delaying downstream metrics during trading hours. This tells interviewers you’ve debugged real performance incidents, not just read about them.
-
This question evaluates your ability to reason about architectural transitions under reliability constraints. Optiver asks similar questions to assess how you think about moving from delayed insights to real time signals. You should explain introducing streaming ingestion, event validation, stateful processing for rolling metrics, and sinks that support both real time monitoring and historical analysis. Addressing ordering, idempotency, and failure recovery is critical.
Tip: Always describe how the system behaves during partial outages or restarts. At Optiver, engineers are trusted when they design systems that degrade predictably instead of failing loudly.
Downstream teams report that metrics look inconsistent after a pipeline change. How do you investigate?
This question tests structured debugging and ownership. At Optiver, inconsistent metrics can lead to incorrect trading decisions, so interviewers want to see a calm, methodical approach. You should describe validating upstream inputs, comparing old and new transformations, checking time windows, and isolating where divergence begins. Emphasize confirming assumptions before rolling back or pushing fixes.
Tip: Say which metric you would trust least and why. Engineers who understand where data is weakest are far more valuable than those who assume all sources are equal.
-
This question evaluates operational safety at scale. Optiver asks this to see if you understand how seemingly simple changes can cause outages. A strong answer explains adding nullable columns first, backfilling incrementally in small batches, validating results, and switching consumers only after completion. You should also discuss rollback strategies.
Tip: Explicitly mention how you would monitor the backfill while it runs. At Optiver, “safe” means observable in real time, not just correct in hindsight.
Head to the Interview Query dashboard to practice the full set of data engineering interview questions. With hands-on SQL problems, data pipeline scenarios, system design case studies, and behavioral prompts, plus built-in code testing and AI-guided feedback, it’s one of the most effective ways to sharpen your reasoning and decision-making skills for the Optiver data engineer interview.
-
This question tests your ability to handle unreliable inputs and messy data sources. At Optiver, not all data arrives cleanly or on time. You should explain detection of new files, validation checks, schema enforcement, idempotent ingestion, and alerting on failures. Making the data usable means transforming it into standardized, queryable formats with clear metadata.
Tip: Call out how you prevent silent data gaps when files don’t arrive. At Optiver, missing data is often more dangerous than bad data because it can go unnoticed.
Want to master the full data engineering lifecycle? Explore our Data Engineering 50 learning path to practice a curated set of data engineering questions designed to strengthen your modeling, coding, and system design skills.
Behavioral and Collaboration Interview Questions
Behavioral questions assess how you collaborate, communicate, and take ownership in environments where data quality and timing directly affect trading and research outcomes. Optiver interviewers look for judgment, accountability, and the ability to align technical work with stakeholder needs.
What are you looking for in your next job?
This question evaluates motivation and alignment. At Optiver, interviewers want to understand whether you are driven by ownership, impact, and high performance systems rather than just tools or titles. They look for candidates who are excited about building reliable data infrastructure that supports fast decision making.
Sample answer: I’m looking for a role where I own critical data systems end to end and see the direct impact of my work. I enjoy environments where correctness and performance matter, and where I can partner closely with users to continuously improve reliability. That’s what draws me to Optiver.
Tip: Avoid generic growth language. Explicitly mention ownership of systems that traders or researchers rely on during market hours. At Optiver, motivation is judged by whether you want responsibility, not just interesting problems.
Tell me about a time you had to balance speed and correctness in a data system.
This question tests judgment under pressure. Optiver wants to see how you assess risk when systems need to move quickly without compromising trust. Interviewers care about how you decided what was acceptable and how you mitigated long term risk.
Sample answer: I once had to deliver a pipeline fix during peak usage. I shipped a minimal change that restored accuracy, then added monitoring and scheduled a follow up refactor. This kept systems stable while avoiding rushed architectural changes.
Tip: Be explicit about what you chose not to do in the moment. At Optiver, restraint under pressure is often more valuable than speed alone.
What would your current manager say about you? What constructive criticisms might they give?
This question assesses self awareness and coachability. Optiver values engineers who reflect honestly and improve over time. Interviewers want balanced answers that show strengths without defensiveness.
Sample answer: My manager would say I’m dependable and calm during incidents. A common piece of feedback is that I can sometimes over explain details, so I’ve worked on summarizing first and adding depth only when needed.
Tip: Tie feedback to production impact. Showing how you changed behavior to reduce confusion during incidents or reviews demonstrates maturity that Optiver values highly.
Head to the Interview Query dashboard to practice the full set of data engineering interview questions. With hands-on SQL problems, data pipeline scenarios, system design case studies, and behavioral prompts, plus built-in code testing and AI-guided feedback, it’s one of the most effective ways to sharpen your reasoning and decision-making skills for the Optiver data engineer interview.
Describe a disagreement with stakeholders about data definitions or metrics.
This question evaluates communication and influence. At Optiver, misaligned definitions can lead to incorrect trading or research conclusions, so clarity is critical. Interviewers want to see how you resolve disagreement constructively.
Sample answer: I worked with stakeholders who interpreted a metric differently. I set up a working session to review raw data, documented assumptions, and proposed a shared definition. Once aligned, downstream analysis became consistent and trusted.
Tip: Emphasize how you prevented the disagreement from resurfacing later. At Optiver, durable alignment matters more than one-time resolution.
How would you convey insights and the methods you use to a non-technical audience?
This question tests communication clarity. Optiver engineers often work with traders and researchers who care about outcomes, not implementation details. Interviewers want to see that you can translate complexity into action.
Sample answer: I start with the decision the data supports, then explain the logic in plain terms before offering deeper technical details if needed. This keeps conversations focused and makes insights easier to act on.
Tip: Mention how you confirm understanding. At Optiver, communication is successful only if the listener can act correctly under time pressure.
Want to build up your data engineer interview skills? Practice real hands-on problems on the Interview Query Dashboard and start getting interview-ready today.
What Does an Optiver Data Engineer Do?
An Optiver data engineer builds and maintains the data infrastructure that supports real time trading, research, and business analytics across the firm. The role focuses on designing reliable, high throughput data pipelines, enabling fast and accurate analysis, and ensuring data quality in environments where latency and correctness directly impact decision making.
Common responsibilities include:
- Designing and maintaining batch and streaming data pipelines that ingest, transform, and validate large volumes of trading and market data.
- Writing efficient, production grade SQL and Python to support analytics, reporting, and downstream research workflows.
- Building and optimizing data models in warehouses and lakehouse platforms to support fast querying and evolving use cases.
- Partnering closely with traders, researchers, and engineers to understand data requirements and translate them into scalable technical solutions.
- Monitoring pipeline performance, handling failures, and improving data reliability through testing, alerting, and documentation.
Tip: When describing your experience, talk about what happens when data is late, missing, or wrong. At Optiver, engineers earn trust by showing they understand how fragile trading decisions become when data reliability slips.
How to Prepare for an Optiver Data Engineer Interview
Preparing for the Optiver data engineer interview is about demonstrating judgment, reliability, and clarity in environments where data systems directly influence trading decisions. You are preparing for a role where latency, correctness, and ownership matter every day. That means interviewers care less about buzzwords and more about how you reason through constraints, communicate trade-offs, and design systems that hold up under pressure.
Read more: How to Prepare for a Data Engineer Interview
Below are focused steps to help you align your preparation with how Optiver evaluates candidates.
Practice end to end reasoning, not isolated solutions: Optiver interviewers consistently probe how individual decisions affect the entire data flow. When preparing, practice explaining how your work fits upstream and downstream rather than stopping at implementation. For example, think about how a design choice impacts consumers, monitoring, or failure recovery.
Tip: Always explain what breaks if your component fails. At Optiver, engineers are evaluated on how well they anticipate downstream impact, not just whether their piece works.
Build comfort with ambiguity and incomplete information: Many Optiver questions are intentionally underspecified. Instead of searching for the “right” answer, focus on clarifying assumptions, asking the right questions, and narrowing scope. Practice talking through what you would validate first and why.
Tip: Interviewers listen closely to your first clarification questions. Asking about data trustworthiness or timing immediately signals real production experience.
Prepare stories that show ownership of production systems: Reflect on experiences where you owned a pipeline, responded to incidents, or improved reliability over time. Focus on what broke, how you diagnosed it, and what you changed to prevent recurrence.
Tip: Emphasize what you automated or monitored after the incident. Optiver values engineers who reduce the chance of repeat failures, not just fix them once.
Practice concise, structured communication: Optiver interviews move quickly. Practice explaining complex ideas in clear, ordered steps without over explaining. Aim to be precise, calm, and confident, especially when walking through decisions.
Tip: Lead with conclusions, then support them. Traders and researchers operate under time pressure, and Optiver engineers are expected to communicate the same way.
Simulate real interview pressure: Practice speaking your thoughts out loud though mock interviews while solving problems, especially under time limits. Review where explanations became unclear or rushed and refine those areas deliberately.
Tip: If you stumble, recover calmly and re-structure your answer. Optiver cares far more about how you regain clarity than whether you were perfect on the first attempt.
Struggling with take-home assignments? Get structured practice with Interview Query’s Take-Home Test Prep and learn how to ace real case studies.
Salary and Compensation for Optiver Data Engineers
Optiver’s compensation philosophy is built around rewarding engineers who can operate in high-impact, performance-critical environments. Data engineers are compensated competitively through a combination of strong base salary, performance driven bonuses, and long term incentives that reflect individual and firm wide success. Total compensation varies by level, location, and scope of responsibility, with most candidates interviewing at Optiver falling into mid-level or senior bands due to the firm’s emphasis on ownership and systems maturity.
Read more: Data Engineer Salary
Tip: Ask how performance is measured, not just paid. At Optiver, compensation follows impact closely, so understanding what counts as meaningful contribution tells you how success is actually defined internally.
Optiver Data Engineer Compensation Overview (2025-2026)
| Level | Role Title | Total Compensation (USD) | Base Salary | Bonus | Equity / Profit Sharing | Signing / Relocation |
|---|---|---|---|---|---|---|
| Mid Level | Data Engineer | $170K – $240K | $140K–$180K | Performance based, meaningful | Profit sharing or firm bonus | Offered selectively |
| Senior | Senior Data Engineer | $220K – $320K | $170K–$210K | High upside performance bonus | Larger profit sharing | Common for experienced hires |
| Lead / Principal | Lead or Principal Data Engineer | $300K – $450K+ | $190K–$240K | Very high performance upside | Significant profit participation | Frequently negotiated |
Note: These estimates are aggregated from 2025 data on Levels.fyi, TeamBlind, public Optiver job postings, and Interview Query’s internal salary database.
Tip: Don’t compare Optiver numbers line-by-line with big tech offers. Optiver rewards engineers who move the needle in critical systems, so upside often depends more on responsibility and trust than on title alone.
Negotiation Tips That Work for Optiver
Negotiating compensation at Optiver is most effective when you demonstrate awareness of performance driven pay structures and communicate expectations clearly and professionally.
- Clarify level and scope early: Optiver’s leveling has a significant impact on bonus potential and total compensation. Confirm scope and expectations before anchoring numbers.
- Frame negotiations around impact: When discussing compensation, reference concrete outcomes such as reliability improvements, latency reductions, or critical pipeline ownership rather than tool experience alone.
- Understand location and team differences: Compensation may vary between Chicago, Amsterdam, Austin, and other offices. Ask for location specific ranges and how bonuses are calculated locally.
Tip: Focus negotiations on where you’ll add the most value, not just numbers. Optiver is far more flexible when they believe you’ll quickly own systems that matter during trading hours.
FAQs
How long does the Optiver data engineer interview process take?
Most candidates complete the Optiver interview process within three to five weeks, depending on interviewer availability and role seniority. Timelines can extend if additional technical rounds are added or if multiple teams are evaluating your profile. Recruiters usually provide clear updates after each stage so expectations are set early.
Does Optiver use online assessments or take home tests?
Some teams use a practical exercise or take home assignment, particularly for senior or specialized roles. These tasks focus on real world data problems such as pipeline design, data validation, or structured analysis rather than algorithmic puzzles. Many candidates move directly from technical screens to onsite interviews.
How technical are Optiver’s SQL interviews?
Optiver’s SQL questions are moderately to highly challenging and emphasize correctness, edge cases, and performance awareness. Expect time based queries, window functions, ranking logic, and careful handling of messy or incomplete data. Interviewers care more about structured reasoning than clever shortcuts.
Is prior trading or finance experience required?
No, prior trading experience is not required. Optiver looks for strong data engineering fundamentals, system design judgment, and the ability to learn domain concepts quickly. Candidates from tech, analytics, or infrastructure backgrounds regularly succeed without finance specific experience.
What skills does Optiver value most in data engineers?
Optiver values ownership, reliability, and clear technical communication. Interviewers look for candidates who understand how data systems behave under pressure and can reason through trade offs that affect downstream users. Strong collaboration and calm decision making are equally important.
How important is system design in the interview?
System design is a core component, especially at mid level and senior roles. You will be evaluated on how you design pipelines, handle failures, and scale systems over time. Interviewers expect you to explain trade offs rather than present a single “perfect” architecture.
What happens if I make a mistake during an interview?
Making a mistake is not a deal breaker. Optiver interviewers pay close attention to how you recover, reason through the issue, and correct your approach. Clear thinking and adaptability often matter more than getting everything right on the first try.
How should I prepare to communicate effectively during interviews?
Optiver values concise, structured explanations. You should practice walking through your logic step by step and clearly stating assumptions before diving into solutions. Strong communication signals that you can be trusted to operate in fast paced, high impact environments.
Become an Optiver Data Engineer with Interview Query
Preparing for the Optiver data engineer interview means developing strong systems thinking, reliability focused engineering judgment, and the ability to communicate clearly in high impact, time sensitive environments. By understanding Optiver’s interview structure, practicing real-world SQL, data pipeline design, and distributed systems scenarios, and refining how you explain trade offs and decisions, you can approach each stage with confidence.
For targeted practice, explore the full Interview Query’s question bank, try the AI Interviewer, or work with a mentor through Interview Query’s Coaching Program to sharpen your approach and position yourself to stand out in Optiver’s data engineering hiring process.
Optiver Interview Questions
| Question | Topic | Difficulty |
|---|---|---|
A/B Testing | Medium | |
Let’s say that your company is running a standard control and variant AB test on a feature to increase conversion rates on the landing page. The PM checks the results and finds a .04 p-value. How would you assess the validity of the result? | ||
Statistics | Medium | |
SQL | Easy | |
SQL | Easy | |
Machine Learning | Medium | |
Statistics | Medium | |
SQL | Hard | |
Machine Learning | Medium | |
Python | Easy | |
Deep Learning | Hard | |
SQL | Medium | |
Statistics | Easy | |
Machine Learning | Hard |
Discussion & Interview Experiences