Optiver Data Scientist Interview Guide (2026): Process, Questions & Preparation Tips


Introduction
Preparing for an Optiver data scientist interview means getting comfortable with a very different hiring bar than most technology companies. As one of the world’s leading electronic market makers, Optiver builds its edge on fast decision-making, rigorous probability, and statistical thinking under uncertainty. Data scientists here work close to live trading problems, where clean assumptions, sharp intuition, and precise reasoning matter more than buzzwords or black-box models. The interview process reflects this reality. You can expect online assessments, take-home exercises, and technical interviews that emphasize probability, logic, and structured thinking rather than product metrics or large-scale experimentation frameworks.
This guide outlines each stage of the Optiver data scientist interview, highlights the most common Optiver style interview questions, and shares proven strategies to help you stand out and prepare effectively with Interview Query.
Optiver Data Scientist Interview Process
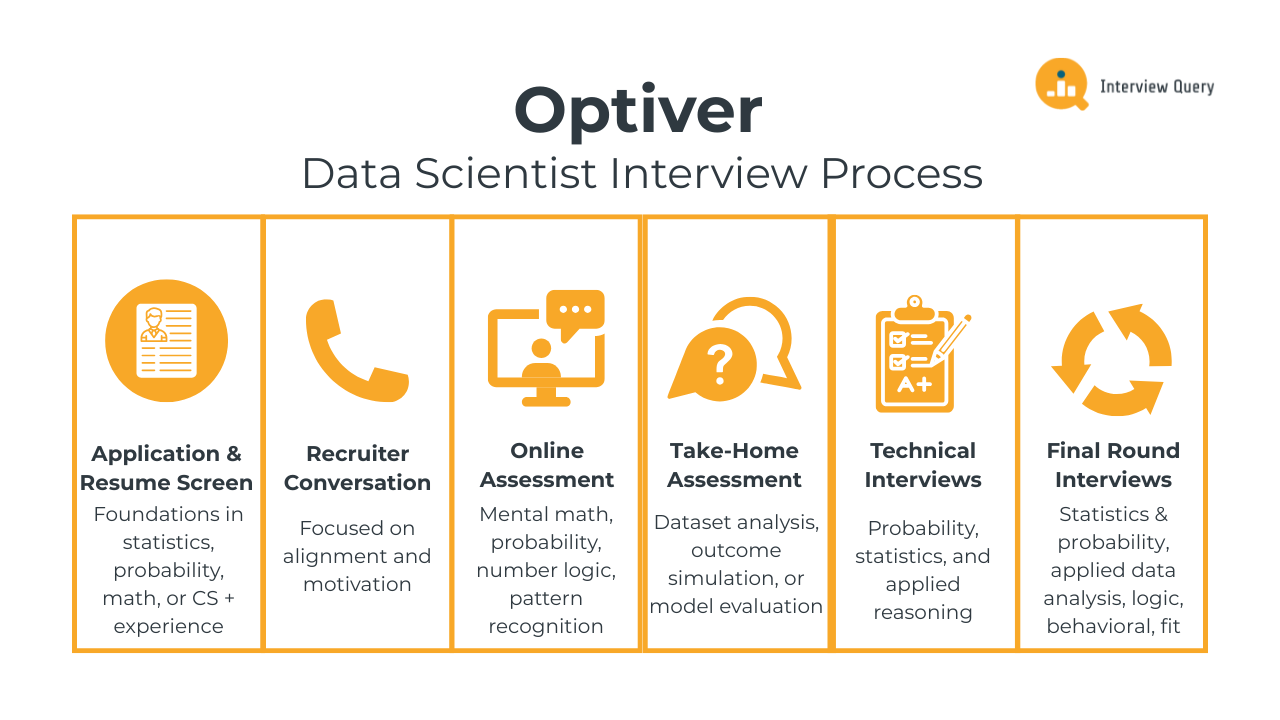
The Optiver data scientist interview process is designed to test how well you reason under uncertainty, work with probability, and make disciplined decisions with incomplete information. Unlike traditional technology data science roles, Optiver places emphasis on statistical intuition, mental math, and structured thinking. Most candidates move through the process in two to four weeks, with each stage deliberately filtering for clarity, speed, and rigor.
Below is a breakdown of the typical stages and what Optiver interviewers are evaluating at each step.
Application and Resume Screen
During the resume review, Optiver looks for strong quantitative signals rather than specific industry experience. This includes solid foundations in probability, statistics, mathematics, or computer science, along with evidence of analytical problem-solving. Academic projects, research, competitive programming, or quantitatively rigorous internships are often valued as highly as traditional data science roles. Clear explanations of what you did and why you did it matter more than the tools listed.
Tip: On your resume, explicitly state where uncertainty existed in your work and how you handled it. For example, mention assumptions you questioned or risks you evaluated. This signals that you already think in terms of probabilistic decision-making, not just execution.
Initial Recruiter Conversation
The recruiter call is a short, non-technical conversation focused on alignment and motivation. Recruiters assess whether you understand what Optiver does, why the role is trading-adjacent rather than product-focused, and whether your background matches the quantitative demands of the position. You may be asked about your comfort with probability, fast-paced problem-solving, and working in high-pressure environments. Logistics such as location, timeline, and availability are also discussed.
Tip: When answering why you want this role, anchor your explanation around decision-making under uncertainty rather than learning opportunities or career growth. This shows you understand the actual nature of the work.
Online Assessment
The online assessment is often the first technical filter and one of the most distinctive parts of the Optiver interview process. It typically includes mental math, probability questions, number logic, and pattern recognition under tight time constraints. Accuracy and speed are both critical, and calculators are usually not allowed. This stage evaluates raw quantitative intuition rather than memorized formulas.
Tip: Practice estimating results first and then checking whether the magnitude makes sense. Demonstrating the ability to detect unreasonable answers matters more than computing exact values quickly.
Take Home Assessment
Many Optiver data scientist candidates complete a take home exercise that involves analyzing a dataset, simulating outcomes, or evaluating a simple model. The task is intentionally open-ended. Interviewers care less about sophisticated techniques and more about how you frame the problem, justify assumptions, and communicate conclusions. A concise written explanation is often as important as the code itself.
Tip: Make it explicit what you chose not to model or explore and why. Explaining those trade-offs shows you can prioritize signal over complexity, which matters far more here than squeezing out marginal model improvements.
Technical Interviews
Technical interviews focus on probability, statistics, and applied reasoning rather than software-heavy implementation. You may be asked to compute expected values, reason about distributions, simulate scenarios, or walk through how you would evaluate a trading signal. Interviewers pay close attention to how you structure problems, explain trade-offs, and adjust your thinking when new information is introduced.
Tip: Start by verbalizing your reasoning and structure before performing any calculations. Interviewers care more about how you approach the problem than whether you arrive at a precise numerical answer.
Final Round Interviews
The final round is the most intensive part of the Optiver data scientist interview process and typically consists of four to five interviews lasting around 45 to 60 minutes each. These sessions evaluate how you reason through probabilistic problems, communicate under pressure, and apply statistical thinking to ambiguous, trading-adjacent scenarios. Interviewers are less concerned with perfect answers and more focused on how consistently and clearly you think when information is incomplete or evolving.
Probability and statistics deep dive: This round centers on expected value, distributions, variance, and conditional probability. You may be asked to reason through coin flips, games, or simplified market scenarios where outcomes depend on uncertain inputs. Interviewers closely observe how you structure the problem, define assumptions, and sanity-check results rather than how quickly you reach a number.
Tip: During your explanation, explicitly point out which assumption you are least confident in and how sensitive the result is to that assumption. This shows real awareness of where risk lives.
Applied data analysis and modeling round: In this interview, you will work through a data-driven scenario such as evaluating a signal, comparing strategies, or interpreting noisy results. You may discuss how you would simulate outcomes, validate performance, or diagnose why a model behaves unexpectedly. The focus is on analytical judgment, not complex modeling techniques.
Tip: If a simpler model is more stable or interpretable, state that clearly and justify it. Choosing robustness over sophistication is a strong signal in trading environments.
Logic and structured problem-solving round: This round often includes logic puzzles or open-ended quantitative problems designed to test clarity of thought. You are expected to reason out loud, adjust when constraints change, and remain composed when the path forward is not obvious. Interviewers want to see whether your thinking stays organized under pressure.
Tip: Before solving, restate the problem in your own words and outline your approach. This demonstrates control and prevents you from solving the wrong problem.
Behavioral and decision-making round: Behavioral questions focus on how you handle mistakes, uncertainty, and conflicting signals. You may be asked about times you changed your mind, made decisions with limited data, or learned from incorrect assumptions. Responses should emphasize reasoning quality rather than outcomes alone.
Tip: Walk through how your belief changed step by step as new information arrived. This shows that you update decisions logically instead of defending initial opinions.
Team fit and communication discussion: The final conversation assesses how you communicate complex ideas to non-technical partners such as traders. You may be asked to explain a statistical concept in plain language or describe how you would collaborate in high-stakes situations. Clear, concise communication is critical.
Tip: Frame explanations around risk, confidence, and recommended action rather than methodology. This mirrors how decisions are actually discussed on a trading desk.
Struggling with take-home assignments? Get structured practice with Interview Query’s Take-Home Test Prep and learn how to ace real case studies.
Challenge
Check your skills...
How prepared are you for working as a Data Scientist at Optiver?
Optiver Data Scientist Interview Questions
The Optiver data scientist interview focuses on probability, statistics, logic, and applied analytical reasoning rather than traditional product analytics or dashboard-driven SQL work. Questions are designed to evaluate how well you think under uncertainty, structure ambiguous problems, and communicate clear reasoning in time-constrained settings. Interviewers are less interested in memorized formulas and more focused on whether you can translate noisy data and incomplete information into sound decisions, which mirrors real trading environments.
Probability and Statistics Interview Questions
This is the most heavily weighted area of the Optiver data scientist interview. Questions typically involve expected value, distributions, conditional probability, variance, and risk reasoning using simplified games or market-style scenarios. The goal is to assess intuition, clarity of assumptions, and logical consistency rather than advanced mathematics.
How would you compute the expected value of a game with asymmetric payouts?
This question tests whether you can translate an uncertain decision into a clean, quantitative framework, a daily requirement in market-making. At Optiver, data scientists must evaluate payoffs where losses and gains are not symmetric and where intuition alone is unreliable. A strong answer defines all possible outcomes, assigns correct probabilities, and computes the weighted average payoff. You should also explain how you sanity-check assumptions and verify that the result aligns with intuition about risk and reward.
Tip: As you work through this, say out loud which outcome drives most of the risk. That tells the interviewer you’re thinking about tail exposure, not just averages.
What is the difference between covariance and correlation?
Optiver uses this question to assess whether you understand dependency structure beyond textbook definitions. Data scientists must reason about how signals move together and how that affects portfolio-level risk. A strong answer explains that covariance captures joint variability in absolute units, while correlation normalizes this relationship to compare strength independent of scale. You should also explain why correlation aids interpretability, but covariance directly feeds into variance and risk calculations used in trading systems.
Tip: Tie your explanation back to what breaks if you only look at correlation. Showing awareness of scale effects signals real trading intuition.
-
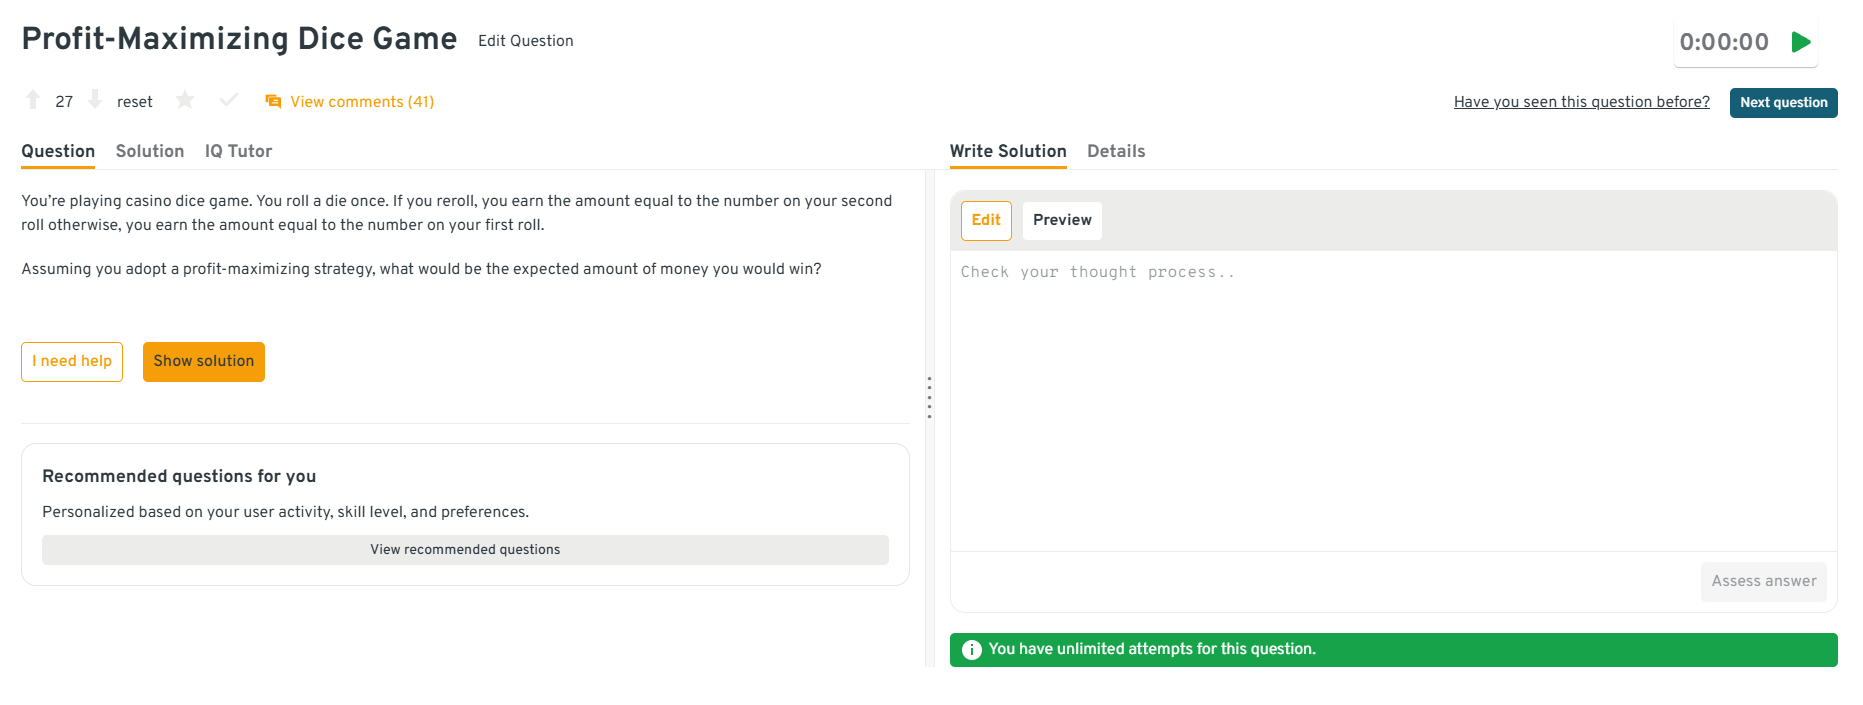
This question evaluates whether you can identify optimal decision thresholds using expected value, a core trading skill at Optiver. A strong answer walks through computing the expected value of keeping versus rerolling for each outcome, identifying the cutoff where rerolling becomes favorable, and selecting the strategy that maximizes long-run gain. The emphasis should be on consistency and optimality, not on individual outcomes or luck.
Tip: Explicitly say why maximizing expected value can feel counterintuitive in the short term. That shows you’re comfortable separating decision quality from outcomes.
Head to the Interview Query dashboard to practice the full set of data science interview questions. With hands-on data challenges, coding exercises, system design case studies and behavioral prompts, with built-in code testing and AI-guided feedback, it is one of the most effective ways to sharpen your reasoning and decision-making skills for the Optiver data scientist interview.
How would you simulate outcomes to evaluate a probabilistic strategy?
Optiver asks this to test your ability to validate models when closed-form solutions are unreliable or insufficient. A strong answer explains how to run repeated simulations, analyze distributions of outcomes, and assess variance, tail risk, and sensitivity to assumptions. You should emphasize interpreting results holistically rather than relying on a single expected value, which mirrors how trading strategies are stress-tested.
Tip: Talk about what would make you stop trusting the strategy based on the simulation results. That shows real risk control thinking.
How would you reason about a problem where probabilities change over time?
This question assesses adaptability and Bayesian thinking, both essential in dynamic markets. At Optiver, probabilities are rarely static, and decisions must evolve as new information arrives. A strong answer discusses updating beliefs as data changes, revising expectations incrementally, and avoiding rigid assumptions. You should frame the problem as a learning process rather than a one-time calculation.
Tip: Walk through how your belief would change step by step as new data arrives. Interviewers listen closely for whether you treat learning as continuous, not episodic.
Data Analysis and Applied Modeling Interview Questions
While Optiver is not product-focused, data analysis still plays a key role in evaluating signals and performance. These questions test how you work with noisy data, validate results, and avoid overconfidence in models.
How would you determine whether a signal is meaningful or just noise?
This question tests whether you can separate true signal from randomness, a core challenge in trading environments. At Optiver, acting on noise can be costly, so interviewers look for structured validation rather than clever models. A strong answer discusses testing stability across time periods, running out-of-sample backtests, and checking sensitivity to assumptions. You should also address multiple testing risk and why statistical significance alone is not sufficient.
Tip: Walk through how the signal behaves when you deliberately stress it. If you can explain what would make you lose confidence in the signal, you show the restraint we expect when real money is at risk.
-
Optiver asks this to evaluate pattern recognition and feature reasoning rather than web analytics expertise. A strong answer explains identifying behavioral signals such as request frequency, session timing, user agent consistency, and navigation patterns. You should focus on combining multiple weak indicators rather than relying on a single rule, mirroring how trading signals are evaluated collectively rather than in isolation.
Tip: Talk through how confident you’d need to be before acting on the classification. That shows you understand thresholds and trade-offs, not just pattern detection.
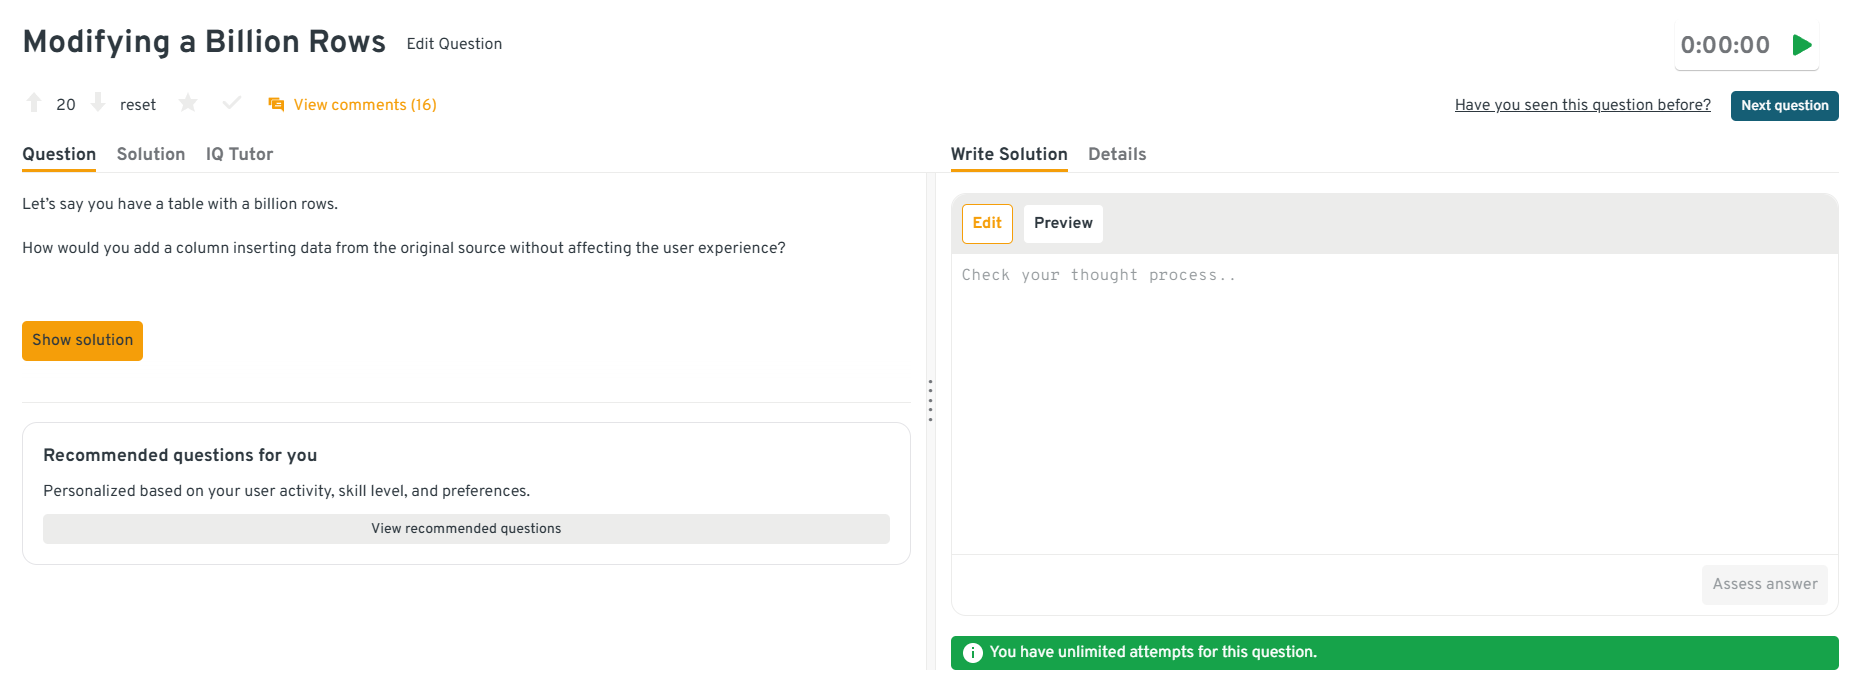
-
This question tests whether you can reason about scale, risk, and operational constraints. At Optiver, data changes must not disrupt live systems. A strong answer discusses techniques like backfilling in batches, using default values, writing to shadow columns, or performing asynchronous updates. The emphasis should be on minimizing risk and ensuring correctness rather than speed alone.
Tip: Prioritize system safety over raw performance to signal mature engineering judgment, which Optiver expects in production environments.
Head to the Interview Query dashboard to practice the full set of data science interview questions. With hands-on data challenges, coding exercises, system design case studies and behavioral prompts, with built-in code testing and AI-guided feedback, it is one of the most effective ways to sharpen your reasoning and decision-making skills for the Optiver data scientist interview.
How would you validate results when the dataset is small or incomplete?
This question assesses how you reason under data scarcity, which is common when evaluating new strategies. A strong answer discusses conservative approaches such as bootstrapping, sensitivity analysis, stress-testing assumptions, and widening confidence intervals. You should emphasize acknowledging uncertainty explicitly rather than forcing precise conclusions from weak data.
Tip: Be clear about what decision you would not make with this data. Showing where the data stops being useful builds trust in your judgment.
Watch next: Data Scientist Interview Questions: Solving the Decreasing Payments Problem
In this mock interview, Eshan Tiwari, a senior data professional walks through a realistic data science case focused on diagnosing a drop in transaction-level payments. You will see how to structure the problem, explore noisy financial data, and form clear, decision-ready recommendations under uncertainty. The walkthrough emphasizes probabilistic thinking, data validation, and communication, all core skills tested in data scientist interviews, ideal for candidates preparing for trading-focused roles and looking to sharpen their applied reasoning across coding, case, and behavioral interviews.
Logic and Structured Reasoning Interview Questions
These questions are designed to evaluate how clearly and methodically you think when the problem space is ambiguous. At Optiver, data scientists regularly face situations where the right answer is not obvious upfront, so interviewers focus on structure, adaptability, and reasoning discipline rather than domain-specific knowledge.
How would you approach a problem where the optimal path is not obvious at the start?
This question tests how you handle ambiguity without freezing or rushing. At Optiver, many decisions begin with incomplete information, so interviewers look for a structured exploration of the problem space. A strong answer explains how you clarify the objective, identify constraints, break the problem into smaller parts, and explore candidate approaches before committing to one direction.
Tip: Start by saying what you’re optimizing for and what you’re deliberately postponing. That shows you know how to progress a problem without locking in fragile assumptions too early.
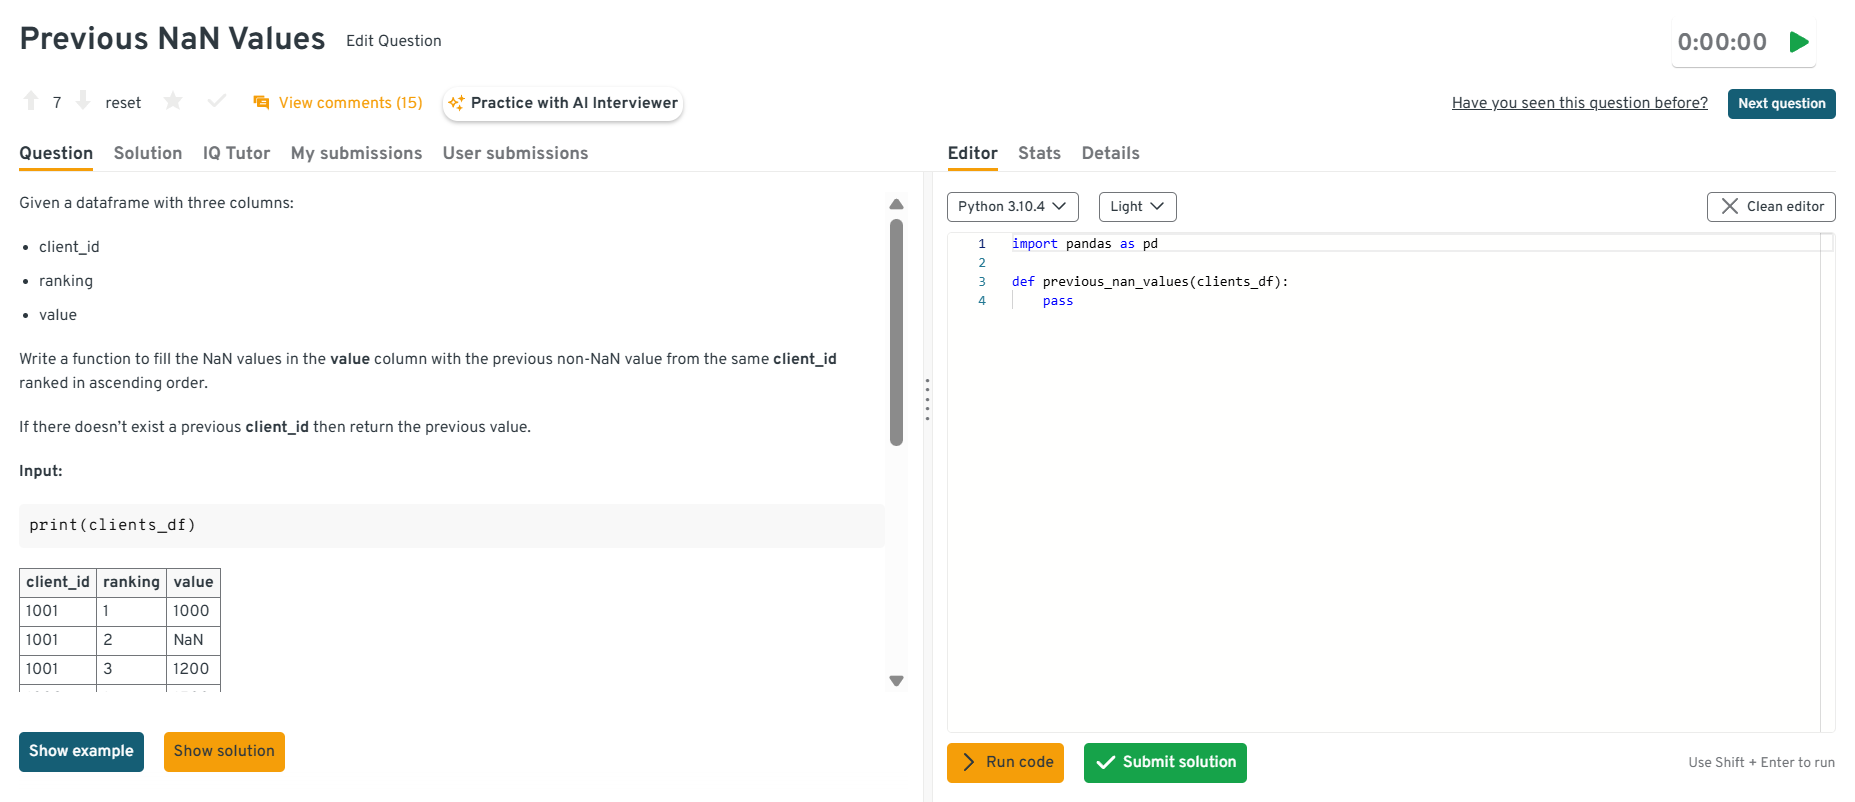
-
Optiver uses this question to test logical precision and edge-case awareness rather than coding syntax. A strong answer explains how to group by client, sort by rank, forward fill within each group, and then apply a fallback rule when no prior value exists. Interviewers care about whether you handle ordering, defaults, and boundary cases correctly.
Tip: Explicitly describe how your logic behaves on the first row, empty groups, or ties. Showing that you think about edge cases upfront signals reliability in production workflows.
Head to the Interview Query dashboard to practice the full set of data science interview questions. With hands-on data challenges, coding exercises, system design case studies and behavioral prompts, with built-in code testing and AI-guided feedback, it is one of the most effective ways to sharpen your reasoning and decision-making skills for the Optiver data scientist interview.
-
This question evaluates whether you can reason through decision thresholds using expected value, a core trading concept. A strong answer explains computing expected value for keeping versus rerolling, identifying the cutoff where rerolling is optimal, and choosing the strategy that maximizes long-term returns rather than individual outcomes.
Tip: Say explicitly why a locally bad outcome can still be the correct decision. That tells the interviewer you separate decision quality from short-term results.
What do you do when two reasonable solutions lead to different conclusions?
This question tests judgment and comparative reasoning. At Optiver, conflicting signals are common, and forcing certainty can be dangerous. A strong answer explains how you examine assumptions behind each solution, assess sensitivity to inputs, compare risk profiles, and decide which approach is more robust under uncertainty.
Tip: Walk through which solution you would trust less and why. Being able to articulate doubt is a strong signal of mature decision-making.
How would you design a database schema to track and store user click events for a web application?
Optiver uses this to assess logical structuring and foresight. A strong answer explains separating event data from metadata, using timestamps and identifiers effectively, and designing for append-only writes and efficient querying. You should also mention how schema choices affect downstream analysis and scalability.
Tip: Explain how your schema choices make future analysis safer or easier. Thinking one step ahead is critical when small design decisions compound over time.
Behavioral and Decision-Making Interview Questions
Behavioral interviews at Optiver focus on how you reason through uncertainty, respond to evidence, and learn from mistakes. Unlike culture-fit interviews at many companies, these questions probe decision quality, adaptability, and intellectual honesty, all of which are critical in fast-moving trading environments.
Tell me about a time you made a decision with incomplete information.
This question evaluates how you structure decisions when data is missing or uncertain, a common reality at Optiver. Interviewers want to see how you identified what mattered most, assessed downside risk, and moved forward without waiting for perfect information. Strong answers emphasize decision framing, risk control, and how you revisited the choice as new data arrived.
Sample answer: I once had to choose between two modeling approaches before all validation data was available. I outlined the risks of each option, selected the more conservative approach, and set clear checkpoints to reassess once additional data arrived. When new data contradicted my initial assumption, I adjusted the model accordingly.
Tip: Be explicit about what you were optimizing for and what risk you were willing to accept. Interviewers are listening for how you trade off speed versus confidence.
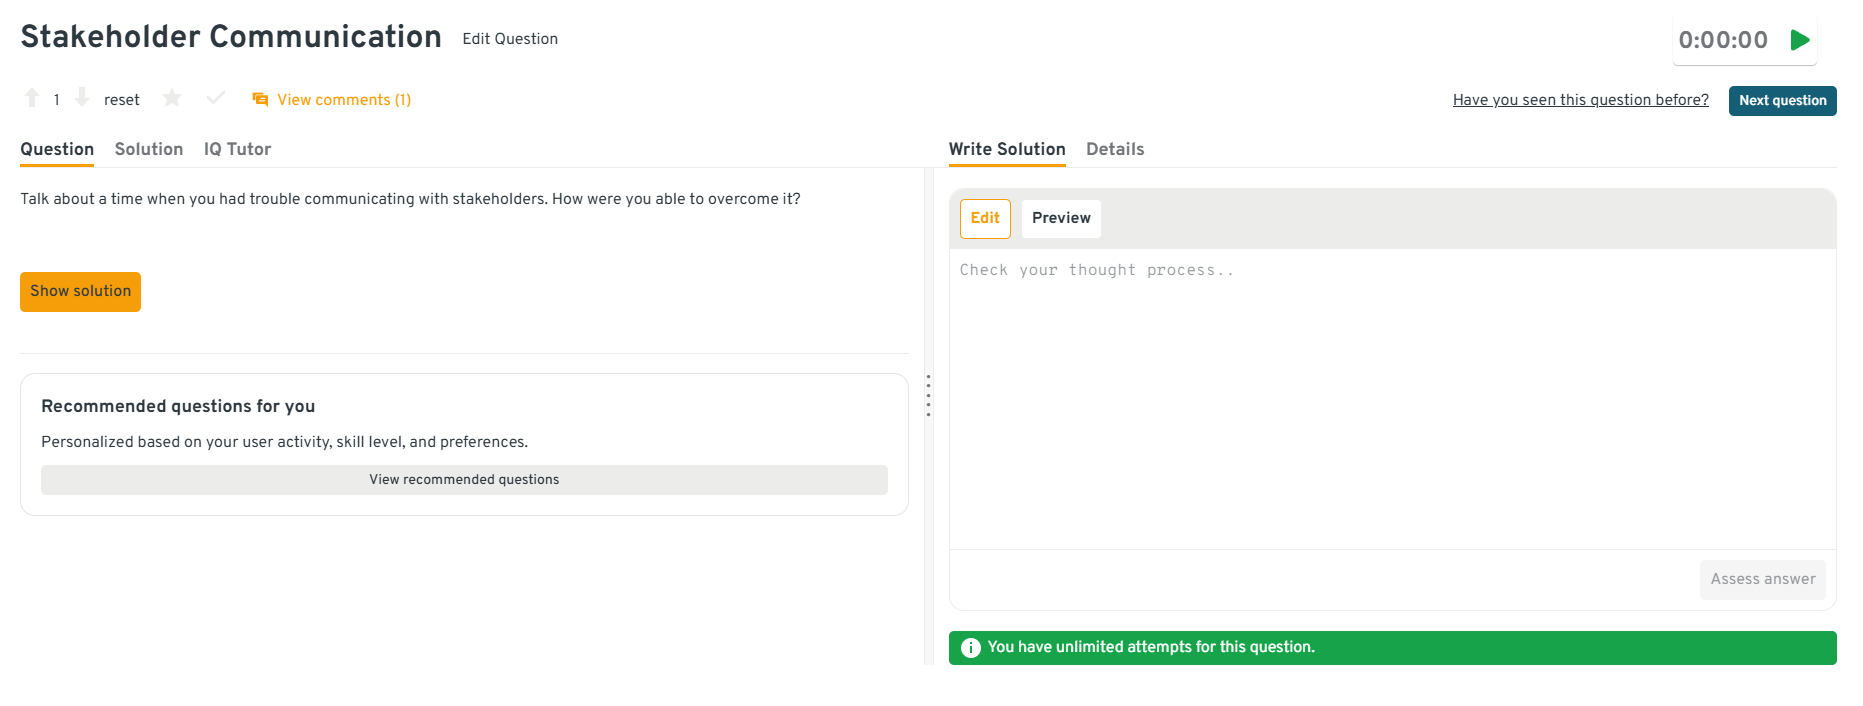
-
This question assesses your ability to adapt communication styles and maintain trust. At Optiver, misalignment between data scientists, engineers, and traders can lead to costly misunderstandings. Interviewers want to see how you diagnose communication breakdowns and realign discussions toward decisions and impact.
Sample answer: I once shared model results that stakeholders found difficult to act on. I followed up by asking what decisions they needed to make, then reframed the analysis around those choices instead of the model details. Once aligned, the discussion became more productive and actionable.
Tip: Make it clear how you shifted the conversation from “here’s my analysis” to “here’s what decision this supports.” That distinction matters a lot on the trading floor.
Head to the Interview Query dashboard to practice the full set of data science interview questions. With hands-on data challenges, coding exercises, system design case studies and behavioral prompts, with built-in code testing and AI-guided feedback, it is one of the most effective ways to sharpen your reasoning and decision-making skills for the Optiver data scientist interview.
How would you convey insights and the methods you use to a non-technical audience?
This question evaluates whether you can translate complex analysis into decision-ready insight. At Optiver, data scientists must communicate probabilistic results to traders who care about risk and outcomes, not equations. Interviewers look for clarity, prioritization, and judgment about what details matter.
Sample answer: I start with the decision being made and the key takeaway, using intuition or comparisons to explain results. I then highlight assumptions and risks at a high level, keeping technical details available if deeper questions come up.
Tip: Always anchor your explanation around “what could go wrong” and “how confident we should be.” That’s how decisions are actually evaluated in trading contexts.
What are your three biggest strengths and weaknesses you have identified in yourself?
This question tests self-awareness and growth mindset. Optiver values candidates who understand both where they excel and where they need guardrails. Interviewers look for honest reflection paired with concrete actions, not generic strengths or rehearsed weaknesses.
Sample answer: My strengths include structured problem-solving, careful data validation, and staying calm under pressure. A weakness I identified was spending too long perfecting edge cases early, which I addressed by time-boxing analysis and aligning sooner on acceptable risk.
Tip: Tie each strength or weakness to an actual decision you improved. Self-awareness only matters here if it changes how you work.
Describe a situation where you had to change your mind based on data.
This question evaluates openness to evidence and adaptability. At Optiver, clinging to prior beliefs despite new data can be costly. Interviewers want to see how quickly and cleanly you update conclusions when evidence shifts.
Sample answer: I initially believed a signal was robust based on early results, but additional data showed instability across time periods. I revised my assessment, deprioritized the signal, and documented why the original assumption failed.
Tip: Walk through exactly what new information caused you to change your mind. Interviewers care more about the trigger than the final decision.
Looking for hands-on problem-solving? Test your skills with real-world challenges from top companies. Ideal for sharpening your thinking before interviews and showcasing your problem solving ability.
What Does an Optiver Data Scientist Do?
An Optiver data scientist focuses on building and validating quantitative insights that support fast, high-stakes trading decisions. The role sits close to live markets, where uncertainty is constant and data is noisy, incomplete, and time-sensitive. Rather than product analytics or dashboarding, the work emphasizes probability, statistical reasoning, simulation, and disciplined modeling to understand risk, evaluate signals, and improve decision quality in competitive market environments.
Common responsibilities include:
- Developing probabilistic models and statistical frameworks to evaluate trading signals, pricing behavior, and market dynamics.
- Analyzing large, high-frequency market datasets to identify patterns, anomalies, and performance drivers.
- Designing simulations and backtesting frameworks to test assumptions and estimate risk under different market conditions.
- Collaborating closely with traders and researchers to translate abstract models into practical, decision-ready insights.
- Writing clear, efficient Python code to explore data, run experiments, and communicate results with precision and transparency.
Tip: When you talk about this role in interviews, don’t describe what you built first. Describe how you reduced uncertainty. That’s what actually maps to how data scientists create value here.
Need 1:1 guidance on your interview strategy? Explore Interview Query’s Coaching Program that pairs you with mentors to refine your prep and build confidence.
How to Prepare for an Optiver Data Scientist Interview
Preparing for an Optiver data scientist interview is about training how you think, not expanding your toolset. Optiver evaluates whether you can make sound decisions with limited information, stay logically consistent under pressure, and communicate uncertainty clearly. Strong preparation focuses on sharpening intuition, structuring reasoning, and building confidence in probabilistic judgment rather than revisiting question formats already covered earlier in this guide.
Read more: How to Prepare for Data Science Interviews
Below are targeted preparation strategies that reflect how Optiver data scientists actually work day to day.
Build comfort reasoning without full information: Optiver problems rarely give you everything upfront. Practice solving problems where key variables are missing or uncertain, and force yourself to state assumptions explicitly before proceeding. This mirrors how real trading decisions are made when signals are incomplete or delayed. Focus on whether your conclusions change materially when assumptions shift.
Tip: Get used to saying, “If this assumption is wrong, here’s what changes.” That habit shows you understand risk, not just logic.
Train intuition, not formulas: Rather than memorizing equations, spend time estimating outcomes and sanity-checking results. Ask whether numbers feel reasonable given the setup and adjust when they do not. This builds instinctive error detection, which is critical when small mistakes can compound in fast-moving environments.
Tip: Practice spotting when an answer is wrong before you know what the right answer is. That instinct matters more than clean math in live settings.
Practice explaining thinking under time pressure: Optiver interviews are as much about communication as correctness. Practice walking through your reasoning out loud while solving problems, especially when the solution path is unclear. Focus on keeping your explanation structured even if you revise your approach midstream.
Tip: If you revise your approach mid-solution, say why. That shows control, not confusion.
Develop comfort with changing your mind: You should expect interviewers to introduce new information partway through a problem. Train yourself to update conclusions calmly rather than defending your initial answer. This reflects real market conditions where new data constantly shifts probabilities.
Tip: Treat changing your mind as progress, not a correction. Interviewers are listening for how quickly you adapt, not whether you were initially right.
Strengthen decision-focused storytelling: When discussing past work, frame stories around decisions you made, trade-offs you considered, and what uncertainty you faced. Optiver cares less about technical sophistication and more about how you evaluated options and learned from outcomes.
Tip: If your story doesn’t include a real trade-off or risk, it probably won’t resonate. Optiver interviews are about judgment, not just execution.
Want to build up your data science interview skills? Practicing real hands-on problems on the Interview Query Dashboard and start getting interview ready today.
Salary and Compensation for Optiver Data Scientists
Optiver data scientists earn competitive compensation across levels, reflecting the firm’s focus on high-impact decision-making in fast-moving trading environments. Total compensation typically includes a strong base salary, performance-based bonuses tied to firm and desk outcomes, and in some regions equity or long-term incentive components. Compensation varies by level, scope of responsibility, and location, with meaningful differences between offices such as Amsterdam, Chicago, and Sydney. Stock or long-term incentives become a more meaningful component as you move into senior and staff-level roles.
Read more: Data Scientist Salary
Tip: Before discussing numbers, make sure you and the recruiter mean the same thing by “level.” At Optiver, level defines expectations far more tightly than title alone.
Average Optiver Data Scientist Salary (2025-2026)
| Level | Role Title | Total / Year | Base / Year | Bonus / Year | Stock or LTI / Year |
|---|---|---|---|---|---|
| Graduate | Graduate Data Scientist | ~$140K – $180K | ~$110K – $135K | ~$20K – $35K | Minimal or none |
| Mid level | Data Scientist | ~$180K – $240K | ~$130K – $165K | ~$35K – $60K | Limited LTI |
| Senior | Senior Data Scientist | ~$230K – $320K | ~$150K – $190K | ~$60K – $100K | Meaningful LTI |
| Staff | Staff or Lead Data Scientist | ~$300K – $400K+ | ~$170K – $220K | ~$90K – $140K | Significant LTI |
Note: These estimates are aggregated from data reported on Levels.fyi, public candidate reports, and Interview Query’s internal salary database.
Tip: When you look at these ranges, focus less on the midpoint and more on what behavior and impact typically unlock the top end at that level.
Average Base Salary
Average Total Compensation
Negotiation Tips that Work at Optiver
Negotiating at Optiver is most effective when you understand how performance, level, and location influence pay. Recruiters expect candidates to be data-driven and precise.
- Confirm level and scope early: Leveling has the biggest impact on total compensation, especially bonus expectations and long-term incentives.
- Anchor with market data: Reference verified benchmarks from Levels.fyi and Interview Query salary insights when discussing ranges.
- Understand bonus mechanics: Ask how bonuses are calculated and what performance signals influence upside.
- Account for location differences: Base salary and tax treatment vary significantly by office, which can materially change take-home pay.
Tip: Ask questions the same way you would validate a model. If you don’t understand how compensation responds to performance variability, you don’t yet have enough signal to evaluate the offer.
FAQs
How long does the Optiver data scientist interview process take?
Most candidates complete the Optiver data scientist interview process within two to four weeks. Timelines can vary depending on assessment scheduling, interviewer availability, and whether multiple teams are reviewing your profile. Optiver recruiters typically move quickly and keep candidates informed after each stage, especially once technical interviews begin.
Does Optiver use online assessments for data scientist roles?
Yes, online assessments are a common early stage in Optiver’s process, particularly for graduate and early career roles. These assessments usually focus on probability, mental math, and logical reasoning rather than coding-heavy tasks. For experienced candidates, this stage may be shortened or combined with later technical interviews.
How important is prior trading or finance experience for Optiver?
Prior trading or finance experience is not required for data scientist roles at Optiver. The firm prioritizes strong probabilistic reasoning, statistical thinking, and structured problem-solving over domain knowledge. Candidates with backgrounds in mathematics, engineering, physics, or research often perform well even without prior exposure to financial markets.
How difficult are Optiver’s technical and probability questions?
Optiver’s questions are considered challenging due to time pressure and the emphasis on reasoning rather than memorization. Problems often involve expected value, conditional probability, or logical puzzles with limited information. Interviewers focus more on clarity of thought, assumption setting, and adaptability than on arriving at a perfect numerical answer.
What skills does Optiver prioritize most in data scientist interviews?
Optiver prioritizes probabilistic reasoning, statistical intuition, and structured problem-solving above specific tools or frameworks. Interviewers look closely at how you define assumptions, reason under uncertainty, and adjust conclusions when new information is introduced. Clear communication and logical consistency matter as much as technical correctness.
How should I prepare for Optiver’s mental math and probability assessments?
Preparation should focus on speed, accuracy, and comfort reasoning without calculators. Practicing expected value problems, conditional probability, and quick arithmetic under time pressure is more effective than memorizing formulas. Interviewers care about how calmly and consistently you think, not just how fast you compute.
Become an Optiver Data Scientist with Interview Query
Preparing for the Optiver data scientist interview means sharpening probabilistic reasoning, developing clear decision-making under uncertainty, and communicating structured thinking in high-pressure environments. By understanding Optiver’s interview process, practicing real-world analytical reasoning alongside real-world SQL and quantitative problem-solving, and refining how you explain assumptions and trade-offs, you can approach each stage with confidence.
For targeted preparation, explore the full Interview Query’s question bank, practice with the AI Interviewer, or work directly with a mentor through Interview Query’s Coaching Program to refine your reasoning and communication and position yourself to stand out in Optiver’s highly selective data science hiring process.
Optiver Interview Questions
| Question | Topic | Difficulty |
|---|---|---|
Statistics | Medium | |
Write a function Note: This should be done without using the NumPy built-in functions. Example: Input: Output: | ||
A/B Testing | Medium | |
SQL | Easy | |
SQL | Easy | |
Machine Learning | Medium | |
Statistics | Medium | |
SQL | Hard | |
Machine Learning | Medium | |
Python | Easy | |
Deep Learning | Hard | |
SQL | Medium | |
Statistics | Easy | |
Machine Learning | Hard |
Discussion & Interview Experiences