Optiver Data Analyst Interview Guide: Process, Questions & Preparation Tips (2026)


Introduction
Optiver operates at the intersection of high speed trading, quantitative research, and real time decision making, where small analytical edges compound into meaningful performance gains. Data analysts at Optiver play a critical role in this environment by transforming massive volumes of trading and market data into insights that traders and researchers rely on every day. Preparing for an Optiver data analyst interview means demonstrating far more than technical fluency. You are expected to think clearly under pressure, reason quantitatively, and communicate insights that stand up to scrutiny in fast moving markets.
This guide focuses on how Optiver evaluates those skills through its interview process, including technical screens, take home assessments, and behavioral interviews rooted in the firm’s core values. This guide outlines each stage of the Optiver data analyst interview, highlights the most common Optiver style interview questions, and shares proven strategies to help you stand out and prepare effectively with Interview Query.
Optiver Data Analyst Interview Process
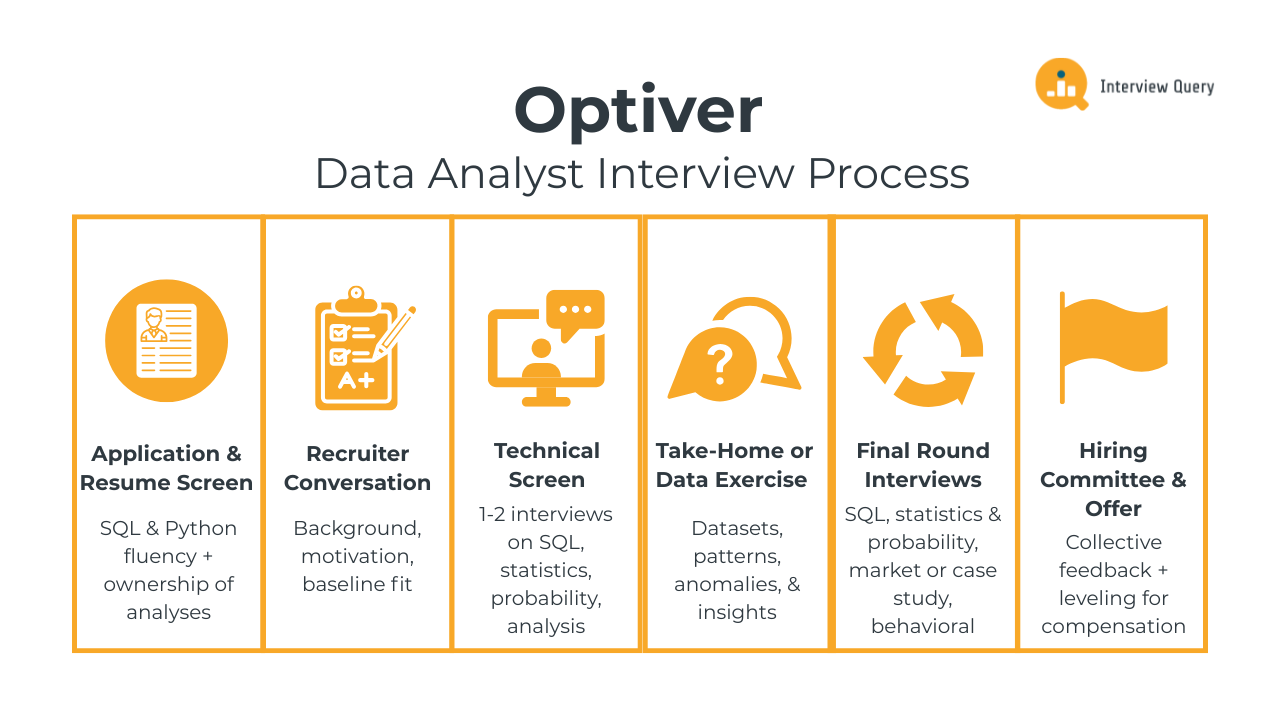
The Optiver data analyst interview process is designed to evaluate how well you can reason with data in fast moving, high stakes environments. Across each stage, interviewers assess your ability to analyze trading data, apply statistics and probability, communicate clearly under pressure, and collaborate with traders and researchers. The Optiver interview process typically includes multiple rounds covering analytics, problem solving, and behavioral alignment with Optiver’s core values. Most candidates complete the full loop within three to five weeks, depending on scheduling and role level.
Application and Resume Screen
During the initial screen, Optiver recruiters look for strong analytical foundations, fluency in SQL and Python, and experience working with complex or time sensitive datasets. Resumes that stand out usually show direct ownership of analyses that influenced decisions, improved performance, or uncovered risk. Experience with financial data, experimentation, monitoring systems, or anomaly detection is especially relevant, even if it comes from non trading domains.
Tip: Highlight instances where your analysis directly changed an outcome, such as correcting a metric, identifying a hidden risk, or improving decision quality. This signals ownership and analytical judgment, two traits Optiver values highly.
Initial Recruiter Conversation
The recruiter conversation focuses on understanding your background, motivation for Optiver, and baseline fit for the data analyst role. You will likely discuss your analytical experience, the types of problems you enjoy working on, and how you handle ambiguity. Recruiters also use this call to assess communication clarity, interest in trading or market driven problems, and practical details such as location and timeline.
Tip: Clearly explain why working close to trading and real-time decision-making excites you. Demonstrating genuine interest in fast feedback environments shows alignment with Optiver’s pace and culture.
Technical Screen
The technical screen usually consists of one or two interviews focused on SQL, statistics, probability, and applied data analysis. You may be asked to write queries to analyze performance trends, reason through probability scenarios, or explain how you would investigate unusual movements in key metrics. Interviewers pay close attention to how you structure problems, validate assumptions, and explain your reasoning as you work.
Tip: When solving technical questions, narrate why you choose a specific approach or metric. This demonstrates analytical discipline and helps interviewers see how you think under time constraints.
Take Home Assignment or Data Exercise
Some Optiver teams include a take home assignment or offline data exercise. These tasks often involve analyzing a dataset, identifying patterns or anomalies, and presenting insights clearly. Your work is evaluated on correctness, structure, and how well you communicate findings rather than visual polish. Clear reasoning and concise explanations matter more than complex modeling.
Tip: Focus on explaining your logic and trade offs clearly, especially around data quality or limitations. This shows practical judgment and mirrors how analysts communicate with traders internally.
Final Round Interviews
The final stage typically includes several in depth interviews, each lasting around 45 to 60 minutes. These rounds test how you apply analytics to real Optiver style problems, how you reason through ambiguity, and how you collaborate with others in high pressure settings.
SQL and data analysis round: You will work through problems that involve querying large datasets, computing performance metrics, or identifying irregular behavior. Questions may focus on aggregations over time, segmentation, or validating whether observed patterns are meaningful. Interviewers look for clean logic, careful handling of edge cases, and the ability to translate raw numbers into insights.
Tip: Before writing any SQL, clearly define what success looks like for the metric you are computing. This shows analytical framing and reduces errors when working with complex data.
Probability and statistics round: This round tests your understanding of probability, distributions, and statistical reasoning in applied contexts. You may be asked to estimate expected values, reason about variance, or compare outcomes under uncertainty. Interviewers care less about formulas and more about whether your reasoning is sound and intuitive.
Tip: Talk through your assumptions explicitly. This signals strong statistical thinking and helps interviewers assess how you reason when information is incomplete.
Market or case study round: In this interview, you will analyze a trading or performance related scenario, such as investigating a sudden drop in profitability or changes in market behavior. The goal is to see how you structure ambiguous problems, decide what data to examine first, and narrow down possible explanations.
Tip: Start broad, then progressively focus your analysis. This demonstrates structured problem solving and the ability to prioritize under uncertainty.
Behavioral and collaboration round: This round evaluates how you work with others, handle pressure, and take ownership of your work. Expect questions about resolving disagreements, catching mistakes, or delivering analysis under tight deadlines. Interviewers look for maturity, accountability, and clear communication.
Tip: Emphasize situations where you identified an issue early or improved a process. This highlights reliability and attention to detail, which are critical in trading environments.
Hiring Committee and Offer
After the final interviews, feedback from all interviewers is reviewed collectively. The hiring team evaluates your analytical strength, communication clarity, and alignment with Optiver’s values. If approved, Optiver determines role level and compensation based on your performance and experience, and may discuss team alignment depending on business needs.
Tip: If you have strong preferences for certain types of work, such as performance analysis or market monitoring, communicate this clearly. It shows self awareness and helps with better team matching.
Want to build up your Optiver interview skills? Practice real hands-on data analyst problems on the Interview Query Dashboard and start getting interview-ready for Optiver today.
Challenge
Check your skills...
How prepared are you for working as a Data Analyst at Optiver?
Optiver Data Analyst Interview Questions
The Optiver data analyst interview features a focused mix of SQL and analytics, probability and statistics, market driven case questions, and behavioral evaluation. These questions are designed to test how well you work with noisy, time sensitive data, reason under uncertainty, and communicate insights that influence real trading decisions. Interviewers care as much about your structure and judgment as your technical correctness, especially in scenarios where incomplete information and tight timelines are the norm.
Read more: Top 100+ Data Analyst Interview Questions
SQL and Analytics Interview Questions
In this portion of the interview, Optiver evaluates how comfortably you work with large datasets tied to trading activity and system performance. SQL questions often involve aggregating metrics over time, identifying anomalies, validating data quality, and explaining performance changes. The goal is to see whether you can turn raw data into insights that traders can act on quickly and confidently.
-
This question tests whether you can reason through non static dimensions and avoid incorrect aggregations when classifications change over time. At Optiver, instruments, strategies, or market regimes often shift definitions across periods, so analysts must join data using both entity and time keys rather than assuming fixed mappings. To solve this, you would join revenue to a season mapping table using product ID and year, then aggregate revenue by season and year. The key is ensuring the join logic respects temporal validity so revenue is attributed to the correct season in each year.
Tip: Call out why joining only on product ID would be wrong here. That signals strong temporal reasoning and protects Optiver from subtle but costly misattribution errors.
How would you identify abnormal spikes in trading volume during market hours?
This question evaluates how you detect anomalies in fast moving data while separating real market behavior from noise. Optiver relies on analysts to flag unusual activity quickly without overreacting to normal volatility. You should explain filtering to active market hours, establishing a historical baseline by instrument and time of day, and comparing current volume using rolling averages or z scores. The focus is on defining what “abnormal” means in context rather than applying a fixed threshold blindly.
Tip: Explain how you would cross check spikes against known market events or system changes. This shows judgment and reduces false alarms in live trading environments.
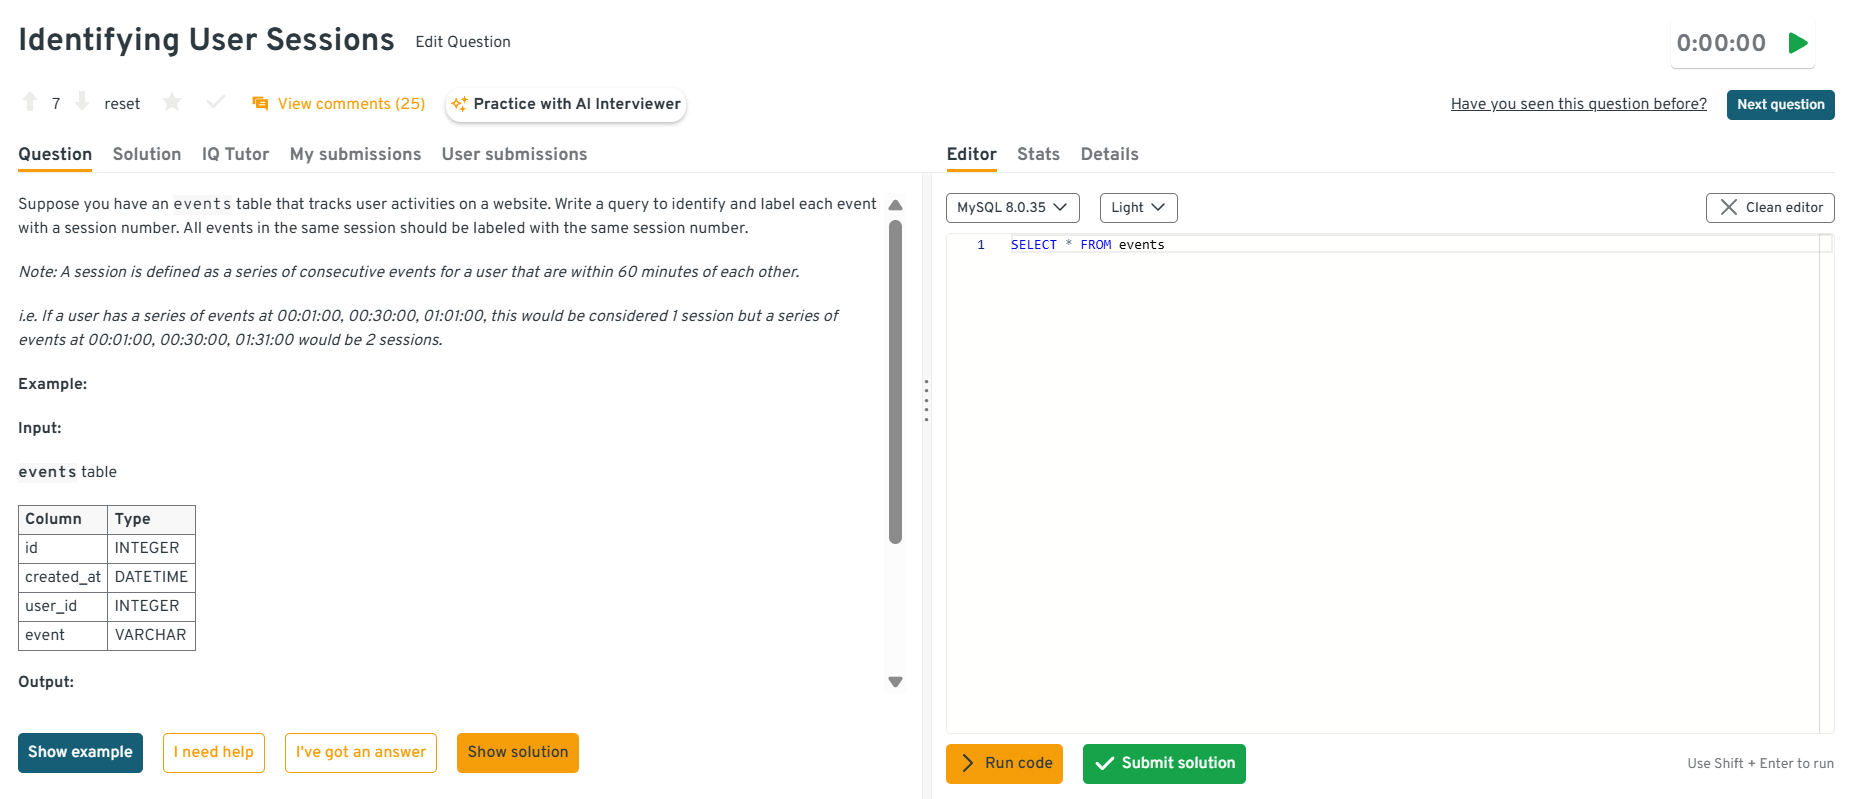
-
This question tests your ability to sequence events and define logical boundaries using window functions. While framed as a user problem, Optiver asks this to assess how you reason about time based grouping, which is critical for analyzing bursts of trading activity or system events. To solve it, you would order events by user and timestamp, use
LAG()to compute time gaps, flag session breaks when gaps exceed 60 minutes, and then generate session IDs using a cumulative sum.Tip: Mention how you would handle identical timestamps or missing events. This demonstrates careful thinking about edge cases that appear in real Optiver data.
Head to the Interview Query dashboard to practice the full range of Optiver style interview questions, including SQL and analytics, probability and statistics, market driven case studies, and behavioral scenarios. With hands-on challenges, built-in code testing, and AI-guided feedback, it is one of the most effective ways to sharpen your reasoning and decision-making skills for Optiver data analyst interviews.
-
This question evaluates your ability to define cohorts correctly and compare behavior across them. At Optiver, similar logic applies when comparing active versus inactive traders or systems under different conditions. You would start by defining interaction clearly, create two user groups using joins or conditional flags, aggregate purchase volume per group, and then compare distributions rather than just totals. Interviewers care about whether you think critically about cohort definition before jumping into calculations.
Tip: Explain how misdefining interaction could bias results. This shows awareness of analytical pitfalls that matter in high stakes decision making.
-
This question tests structured analytical thinking in ambiguous scenarios. Optiver uses similar questions to see how you break down complex performance changes without being told where the issue lies. A strong answer walks through decomposing revenue into volume and price, segmenting by product, time, or customer type, and checking whether the decline is broad based or localized. You should emphasize validating data first, then narrowing hypotheses systematically.
Tip: Start by explaining how you would rule out data errors before analysis. This highlights reliability and protects Optiver from acting on faulty conclusions.
Watch Next: Top 5 Insider Interview Questions Data Analysts Must Master Before Any Interview!
In this video, Jay Feng, an experienced data scientist and cofounder of Interview Query, dives into five of the most frequently asked data-analyst interview questions, from handling over-connected users who post less to simulating truncated distributions. You’ll see how to break down each prompt, choose the right methods, implement clear solutions, and tie your answer back to business context for maximum impact.
Probability and Statistics Interview Questions
Probability and statistics questions at Optiver focus on reasoning clearly about uncertainty rather than memorizing formulas. Interviewers want to see whether you can estimate outcomes, compare distributions, and explain variability in ways that support trading decisions.
-
This question tests whether you can apply hypothesis testing thoughtfully rather than mechanically. At Optiver, similar reasoning is used when deciding if a strategy or signal improvement is real or just noise. You should explain defining null and alternative hypotheses, calculating standard errors for both groups, running a two proportion z test, and interpreting both the p value and confidence interval. Importantly, you should stress that statistical significance alone is not enough without considering effect size and risk.
Tip: Emphasize how you would sanity check randomization and sample balance first. This shows discipline and prevents Optiver from acting on misleading test results.
What are the assumptions of linear regression?
This question evaluates whether you understand when a model is appropriate, not just how to fit it. At Optiver, analysts must know when linear assumptions break down in volatile markets. You should walk through linearity, independence, homoscedasticity, normality of errors, and lack of multicollinearity, explaining why violations matter for inference and prediction reliability. The focus should be on consequences, not definitions.
Tip: Briefly explain which assumptions matter most for decision making versus interpretation. This signals practical modeling judgment rather than textbook knowledge.
You are testing hundreds of hypotheses with many t-tests. What considerations should be made?
This question tests your awareness of false discoveries and risk inflation. Optiver asks this to ensure you do not mistake random wins for real edges. You should explain the multiple testing problem, increased false positive rates, and approaches like Bonferroni correction or false discovery rate control. You should also discuss prioritizing hypotheses and validating results out of sample.
Tip: Mention that Optiver would rather miss weak signals than deploy false ones. This shows alignment with risk conscious decision making.
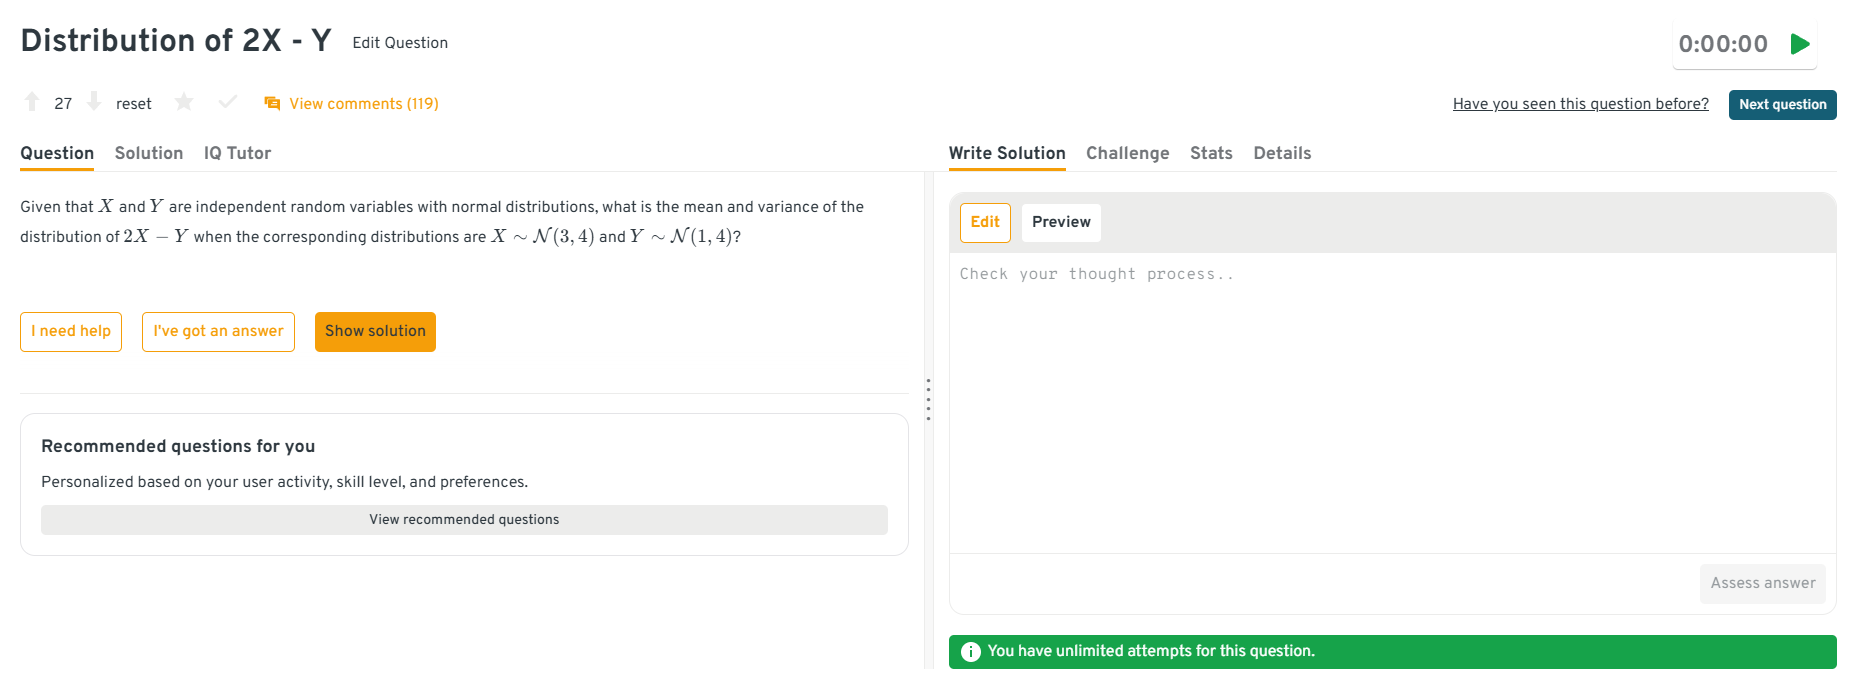
-
This question tests whether you can manipulate distributions confidently and explain your steps clearly. At Optiver, this skill translates to combining signals and understanding how variance scales. You should explain using linearity of expectation to compute the mean and independence to add variances, showing how scaling affects dispersion. The emphasis is on reasoning, not speed.
Tip: Talk through each step out loud rather than jumping to the result. This demonstrates clarity of thought, which Optiver values highly.
Head to the Interview Query dashboard to practice the full range of Optiver style interview questions, including SQL and analytics, probability and statistics, market driven case studies, and behavioral scenarios. With hands-on challenges, built-in code testing, and AI-guided feedback, it is one of the most effective ways to sharpen your reasoning and decision-making skills for Optiver data analyst interviews.
Explain how a probability distribution could not be normal and give an example scenario.
This question evaluates whether you recognize when normal assumptions fail. Optiver works with heavy tailed and skewed data regularly, especially in returns and volume. You should explain examples like skewed, bimodal, or heavy tailed distributions and connect them to real scenarios such as market returns or event driven trading behavior.
Tip: Reference why assuming normality could underestimate risk. This signals strong risk awareness and statistical maturity.
How would you tackle multicollinearity in multiple linear regression?
This question tests your ability to diagnose and mitigate unstable models. At Optiver, correlated signals can distort attribution and decision making. You should explain detecting multicollinearity using variance inflation factors or correlation matrices, then addressing it through feature selection, regularization, or dimensionality reduction depending on the goal.
Tip: Explain how your solution depends on whether prediction or interpretation matters more. This shows thoughtful trade off reasoning under real constraints.
Need customized guidance for your Optiver data analyst interview? Explore Interview Query’s Coaching Program to work one on one with experienced mentors who help refine your strategy, strengthen decision making under pressure, and build confidence for Optiver’s interview process.
Market and Case Based Interview Questions
These questions simulate real scenarios analysts face when supporting traders and researchers at Optiver. They are designed to test how you structure ambiguous problems, prioritize signals under uncertainty, and connect data analysis to real trading decisions rather than abstract metrics.
Trading performance drops sharply for one product. How would you analyze the issue?
This question tests whether you can approach a high impact problem methodically instead of jumping to conclusions. At Optiver, sudden performance drops require fast but disciplined analysis. You should explain starting with data validation to rule out reporting issues, then isolating when the drop began, comparing against similar products or markets, and breaking performance into drivers such as volume, price, or execution quality. The focus is on narrowing the problem efficiently while keeping traders informed.
Tip: Explicitly state how you would communicate interim findings to traders while investigating. This shows prioritization and real time decision support skills.
-
This question tests whether you can translate a business problem into measurable outcomes and trade offs. Although framed around marketing, Optiver uses this to assess how you evaluate return on investment across channels with different dynamics. You should explain defining clear objectives, attributing outcomes to channels, comparing marginal returns, and reallocating spend based on performance rather than intuition. Interviewers look for structured reasoning, not domain specific jargon.
Tip: Emphasize how you would avoid over attributing success to the loudest channel. This signals careful causal thinking, which Optiver values in market analysis.
-
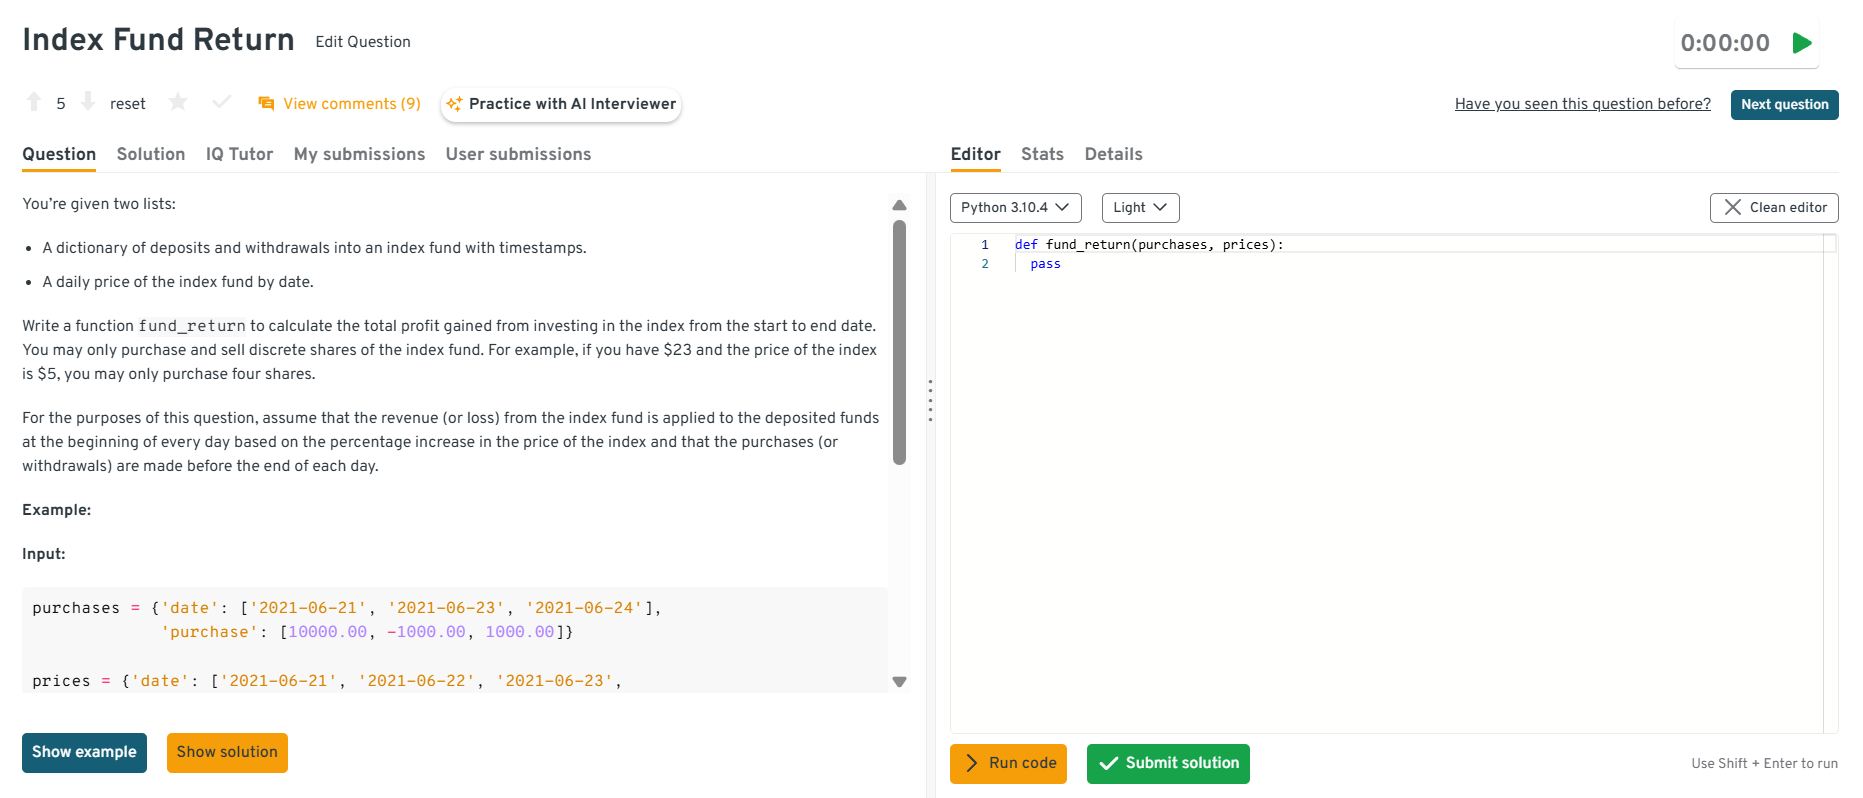
This question tests your ability to model financial flows accurately over time. At Optiver, analysts frequently reconcile cash flows, positions, and prices to explain profit and loss. You should describe tracking cash movements chronologically, converting deposits into shares at prevailing prices, adjusting holdings for withdrawals, and computing final value versus invested capital. The emphasis is on correctness and clear handling of edge cases.
Tip: Mention how you would validate results against known scenarios. This highlights reliability and reduces the risk of silent calculation errors.
Head to the Interview Query dashboard to practice the full range of Optiver style interview questions, including SQL and analytics, probability and statistics, market driven case studies, and behavioral scenarios. With hands-on challenges, built-in code testing, and AI-guided feedback, it is one of the most effective ways to sharpen your reasoning and decision-making skills for Optiver data analyst interviews.
-
This question evaluates how you debug systems that drive financial outcomes. Optiver asks this to see whether you can separate model logic issues from data or assumption errors. You should explain reviewing recent changes, validating inputs, checking constraints, and comparing outputs to benchmarks or manual calculations. Interviewers want to see calm, systematic debugging rather than speculative fixes.
Tip: Call out the importance of isolating one variable at a time. This demonstrates disciplined problem solving in high stakes systems.
How would you assess whether a market event had a lasting impact on trading behavior?
This question tests your ability to distinguish structural change from temporary noise. At Optiver, analysts must decide whether to adjust strategies based on events or wait for normalization. You should explain comparing pre and post event behavior using matched time windows, checking persistence across multiple metrics, and controlling for broader market conditions. The goal is to avoid overreacting to short term shocks.
Tip: Explain why choosing the right comparison window matters more than complex modeling. This shows thoughtful analytical design aligned with real trading decisions.
Struggling with take-home assignments? Get structured practice with Interview Query’s Take-Home Test Prep and learn how to ace real case studies.
Behavioral Interview Questions
Behavioral questions assess how you work with others, handle mistakes, and take ownership in high stakes environments. At Optiver, these questions are especially important because analysts operate close to trading decisions where trust, clarity, and accountability matter every day.
What makes you a good fit for our company?
This question evaluates alignment with Optiver’s culture, pace, and expectations around ownership. Interviewers want to see that you understand what makes Optiver different, such as fast feedback loops, high accountability, and data driven decision making, and that you are motivated by those conditions rather than intimidated by them.
Sample answer: I do my best work in environments where accuracy and speed both matter. In my past roles, I enjoyed working close to decision makers, validating data quickly, and taking responsibility for outcomes rather than just delivering reports. Optiver’s focus on ownership, rigorous thinking, and continuous improvement fits how I like to work and grow.
Tip: Tie your strengths directly to Optiver’s operating style. This shows self awareness and signals that you are likely to thrive in a trading driven environment.
Tell me about a time you caught an error in an important analysis.
This question tests accountability, attention to detail, and integrity. At Optiver, catching errors early is critical because decisions often depend on real time data. Interviewers want to see how you respond when something goes wrong and whether you take ownership beyond simply fixing the mistake.
Sample answer: I once noticed that a key metric I was tracking suddenly shifted in a way that did not align with expected behavior. After digging in, I realized a data join had silently dropped records after a schema change. I corrected the logic, informed stakeholders immediately, and added validation checks so the issue would be flagged in the future.
Tip: Emphasize prevention, not just correction. This shows reliability and reduces future risk, which Optiver values highly.
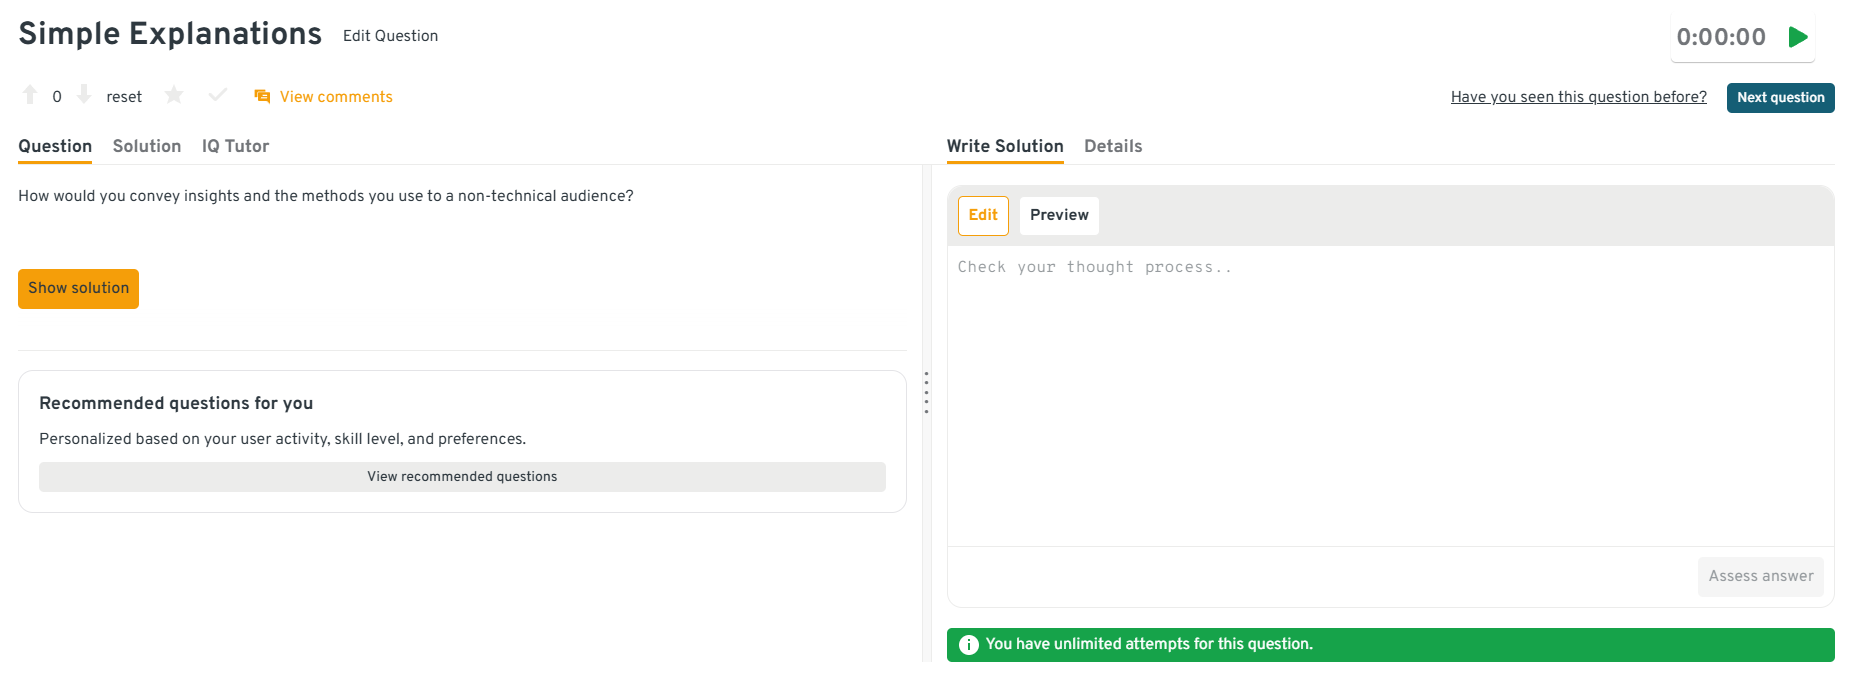
How would you convey insights and the methods you use to a non-technical audience?
This question assesses your ability to translate analysis into action. Optiver analysts frequently explain results to traders who care about implications, not methodology. Interviewers look for clarity, prioritization, and the ability to adjust depth based on the audience.
Sample answer: I start with the conclusion and why it matters, then explain the logic at a high level using concrete examples. If questions come up, I go deeper only where needed. My goal is to make it easy for the audience to decide what to do next, not to walk through every technical step.
Tip: Stress outcome first communication. This demonstrates decision focused thinking, which is essential when supporting traders.
Head to the Interview Query dashboard to practice the full range of Optiver style interview questions, including SQL and analytics, probability and statistics, market driven case studies, and behavioral scenarios. With hands-on challenges, built-in code testing, and AI-guided feedback, it is one of the most effective ways to sharpen your reasoning and decision-making skills for Optiver data analyst interviews.
Describe a situation where you had to deliver analysis under tight deadlines.
This question evaluates composure, prioritization, and judgment under pressure. At Optiver, timelines are often driven by markets rather than schedules, so interviewers want to see how you balance speed with correctness.
Sample answer: I was asked to investigate a sudden performance change with very limited time. I focused first on validating the data and identifying the largest drivers rather than exhaustively analyzing everything. I shared preliminary findings quickly, then followed up with deeper analysis once the immediate question was addressed.
Tip: Highlight how you chose what not to analyze initially. This shows prioritization and maturity under time pressure.
-
This question assesses adaptability and trust building. Optiver analysts work with people who have different mental models and tolerances for detail. Interviewers want to see how you adjust rather than push back defensively.
Sample answer: I once shared an analysis that stakeholders felt was too abstract to act on. I followed up by asking what decisions they needed to make and restructured the analysis around those questions. By reframing the insights in terms of concrete actions, the discussion became much more productive.
Tip: Show that you adjusted your approach rather than blaming the audience. Optiver values analysts who enable decisions through flexible communication.
Want to master the full data analytics path? Explore our Data Analytics 50 learning path to practice a curated set of real world analytics, SQL, statistics, and modeling questions designed to strengthen your analytical reasoning, coding fluency, and decision making skills under realistic interview conditions.
What Does an Optiver Data Analyst Do?
An Optiver data analyst supports real time trading decisions by analyzing market activity, trading performance, and system behavior across global exchanges. The role sits close to traders and quantitative researchers, translating complex data into insights that improve pricing, risk management, and execution quality. Analysts are expected to work with large, fast moving datasets, validate critical metrics, and surface patterns that directly influence how Optiver trades in competitive markets.
Common responsibilities include:
- Analyzing trading data to evaluate strategy performance, identify inefficiencies, and explain profit and loss drivers across products and markets.
- Writing complex SQL queries and Python analyses to investigate anomalies, monitor key metrics, and support time sensitive decision making.
- Building and maintaining dashboards and reports that track market conditions, liquidity, latency, and trading behavior.
- Partnering closely with traders and researchers to test hypotheses, validate assumptions, and refine analytical models.
- Ensuring data accuracy and integrity by designing validation checks and investigating discrepancies in high impact datasets.
How to Prepare for an Optiver Data Analyst Interview
Preparing for an Optiver data analyst interview is about training yourself to think clearly in fast, high impact environments where data is incomplete and decisions matter immediately. You are preparing for a role that sits close to trading, where analytical mistakes can be costly and strong judgment creates real advantage. Your goal is to show that you can reason calmly under pressure, prioritize what matters, and communicate insights that traders can trust.
Read more: How to Prepare for a Data Analyst Interview
Think of preparation as sharpening how you analyze uncertainty, validate assumptions, and explain conclusions with confidence. Below is a focused guide to help you prepare effectively without duplicating skills already covered earlier.
Build intuition for fast feedback environments: Optiver operates in settings where results are visible quickly and mistakes surface immediately. Practice analyzing situations where signals change rapidly and historical patterns may not hold. Train yourself to ask what has changed, why it matters now, and what data would confirm or refute your hypothesis.
Tip: When practicing cases, force yourself to state a first pass hypothesis within two minutes. This demonstrates decisiveness and comfort operating without perfect information.
Practice validating data before trusting results: Optiver interviewers care deeply about whether you question data quality before drawing conclusions. Get used to asking where the data came from, what could be missing, and how errors might propagate into metrics or decisions.
Tip: Explicitly calling out data validation steps signals reliability and risk awareness, which helps interviewers trust your analytical judgment.
Strengthen reasoning under uncertainty: Many Optiver questions do not have a single correct answer. Focus on explaining ranges, trade offs, and confidence levels rather than precise point estimates. Practice explaining why an answer is directionally correct even if inputs are noisy.
Tip: Use phrases like “given this uncertainty, I would expect” or “the risk here is” to show probabilistic thinking rather than overconfidence.
Refine how you communicate with non analysts: Data analysts at Optiver work closely with traders who need concise, actionable insights. Practice summarizing analyses in a few sentences, focusing on impact rather than process. Avoid over explaining unless asked.
Tip: End explanations with a clear takeaway or recommendation. This shows you can translate analysis into decisions, not just calculations.
Prepare ownership driven examples: Behavioral interviews at Optiver strongly emphasize accountability. Review past experiences where you caught an issue, pushed back on an assumption, or improved a process without being asked. Focus on what you owned and what changed because of your actions.
Tip: Frame stories around responsibility and follow through. This highlights trustworthiness, which is critical in trading environments.
Simulate full length interview sessions: Optiver interviews can be mentally demanding. Practice sitting through multiple problems back to back while maintaining clarity and energy. After each mock interview session, review where your thinking became rushed or unclear.
Tip: Track fatigue related mistakes separately from knowledge gaps. This shows self awareness and helps you improve performance consistency.
Want realistic interview practice without scheduling or pressure? Try Interview Query’s AI Interviewer to simulate Optiver style analytics, probability, and modeling interviews and get instant, targeted feedback on how you reason, communicate, and perform under real interview conditions.
Salary and Compensation for Optiver Data Analysts
Optiver’s compensation framework is built to reward analysts who deliver accurate, high impact insights in fast paced trading environments. Data analysts receive a combination of competitive base pay, performance driven bonuses, and long term incentives tied to firm and desk level results. Your total compensation depends on your level, location, and how closely your role supports real time trading and performance analysis. Candidates with strong analytical ownership, market intuition, and experience working under pressure typically fall into mid level or senior bands.
Read more: Data Analyst Salary
Tip: Ask your recruiter whether the role is embedded with a trading desk or part of a centralized analytics team, since this directly affects bonus structure and upside.
Optiver Data Analyst Compensation Overview (2025-2026)
| Level | Role Title | Total Compensation (USD) | Base Salary | Bonus | Equity / Profit Sharing | Signing / Relocation |
|---|---|---|---|---|---|---|
| DA1 | Data Analyst (Junior) | $120K – $160K | $95K–$125K | Performance based | Limited or none | Rare |
| DA2 | Data Analyst II / Mid Level | $150K – $210K | $120K–$150K | Strong annual bonus | Moderate | Case-by-case |
| Senior DA | Senior Data Analyst | $190K – $280K+ | $140K–$180K | High upside | Meaningful | More common |
Note: These estimates are aggregated from 2025 data on Levels.fyi, public job postings, and Interview Query’s internal compensation benchmarks.
Tip: Bonus variability at Optiver can be significant year to year, so evaluate offers based on expected performance bands, not just base salary.
Negotiation Tips that Work for Optiver
Negotiating compensation at Optiver is most effective when you demonstrate a clear understanding of performance based pay and market benchmarks. Recruiters expect candidates to be data driven, precise, and professional when discussing compensation.
- Confirm your level early: Optiver’s leveling determines both base salary and bonus leverage. A shift from junior to mid level can materially change total compensation.
- Anchor with performance driven benchmarks: Use verified sources such as Levels.fyi and Interview Query salaries to ground expectations. Frame your value around accuracy, decision impact, and ownership rather than years of experience alone.
- Understand bonus mechanics: Ask how bonuses are calculated, including firm performance versus desk or team contribution. This context matters more at Optiver than at many traditional tech companies.
Tip: Request a full compensation breakdown, including base salary, bonus target ranges, payout timing, and any signing incentives, so you can evaluate risk and upside accurately before accepting an offer.
FAQs
How long does the Optiver data analyst interview process take?
Most candidates complete the Optiver interview process within three to five weeks, depending on scheduling and role level. Timelines can extend if additional interviews are added or if multiple teams are reviewing your profile. Recruiters typically provide clear updates after each stage.
Does Optiver use online assessments or take home tests?
Some Optiver teams include an online assessment or take home data exercise, particularly for analyst roles that emphasize independent analysis. Other candidates move directly into live technical interviews. The format depends on team needs and hiring volume at the time.
How technical is the Optiver data analyst interview?
The interview is analytically rigorous but not overly focused on advanced software engineering. Optiver prioritizes structured thinking, statistical reasoning, and the ability to interpret real data over complex coding patterns. Clear logic and explanation matter more than flashy solutions.
Is prior trading or finance experience required for Optiver?
Trading or finance experience is helpful but not required. Many successful candidates come from general analytics or quantitative backgrounds. Optiver looks for strong reasoning, curiosity, and the ability to learn market concepts quickly on the job.
What is the difficulty level of Optiver’s SQL questions?
Optiver’s SQL questions are moderately challenging and often scenario driven. You can expect multi step queries, time based logic, and aggregation questions tied to performance analysis. Interviewers focus on correctness, clarity, and handling of edge cases.
What qualities does Optiver value most in data analysts?
Optiver values ownership, precision, and calm decision making under pressure. Analysts who question assumptions, validate data carefully, and communicate clearly tend to stand out throughout the interview process.
Can candidates ask clarifying questions during interviews?
Yes, asking clarifying questions is encouraged at Optiver. Interviewers want to see how you frame problems and verify assumptions before acting. Thoughtful questions signal strong analytical habits and reduce the risk of incorrect conclusions.
How should candidates prepare for Optiver behavioral interviews?
Behavioral interviews focus on accountability, collaboration, and attention to detail. Strong answers emphasize situations where you took ownership, identified risks early, or improved outcomes through careful analysis and communication.
Become an Optiver Data Analyst with Interview Query
Preparing for the Optiver data analyst interview means sharpening your ability to reason under uncertainty, validate critical data, and communicate insights that support real time trading decisions. By understanding Optiver’s interview structure, practicing scenario driven analytics, and refining how you explain assumptions and trade offs, you can approach each stage with confidence. For targeted preparation, explore the full Interview Query’s question bank, practice with the AI Interviewer, or work one on one with a mentor through Interview Query’s Coaching Program to refine your thinking and communication so you are well equipped to stand out in Optiver’s data analyst hiring process.
Optiver Interview Questions
| Question | Topic | Difficulty |
|---|---|---|
Statistics | Medium | |
Write a function Note: This should be done without using the NumPy built-in functions. Example: Input: Output: | ||
A/B Testing | Medium | |
SQL | Easy | |
SQL | Easy | |
Machine Learning | Medium | |
Statistics | Medium | |
SQL | Hard | |
Machine Learning | Medium | |
Python | Easy | |
Deep Learning | Hard | |
SQL | Medium | |
Statistics | Easy | |
Machine Learning | Hard |
Discussion & Interview Experiences