Top 15 Marketing Analytics Projects and Datasets


Overview
According to Similarweb, over 6 billion devices are connected to the internet, approximately 2.5 million terabytes of data are generated daily, and about 1.5 MB of data is created every second for each person. With this pile of data, marketers and business owners need to figure out how to personalize a product, offer it to a customer, and make buying easier. This process is possible with the help of data science.
In a recent report, Forbes Insights and Turn found that companies who adopt data-driven marketing are more likely to have an advantage over the competition and increase profitability. They are six times more likely to be profitable year-over-year.
More and more companies realize that marketing analytics data scientists are now essential to FAANG and other major companies.
This article will go through the fifteen best and most straightforward marketing analytics data science projects to help you practice your marketing analyst skills.
Keyword Research Analysis
The results of the first page of Google search get over 90% of the traffic. So it is becoming increasingly important for a business to appear at the top of popular search engines. Data scientists must constantly find new and innovative ways to improve search engine performance.
In large tech companies, a data scientist can use Google Dataset Search to analyze the most searched keywords to find the best possible ones to use when promoting their company’s products and services, thereby improving its search performance.
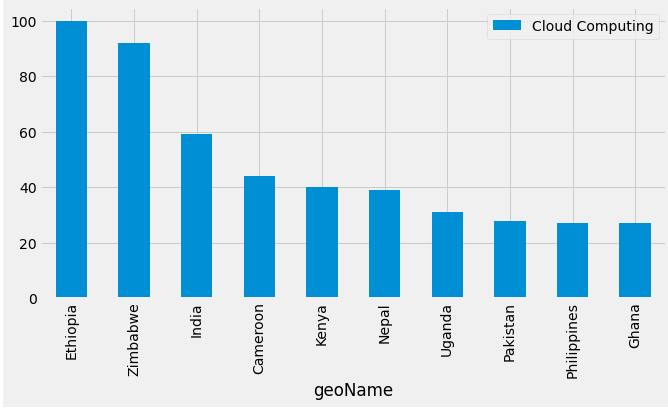
How To Start: Get started with this simple tutorial, which shows you how to generate keywords using Google Trends via Python.
Google Search Analysis
Google search analysis starts after you find the most used keywords. The aim is to analyze the search trends for that keyword on Google, which is very important for a business to reach more customers.
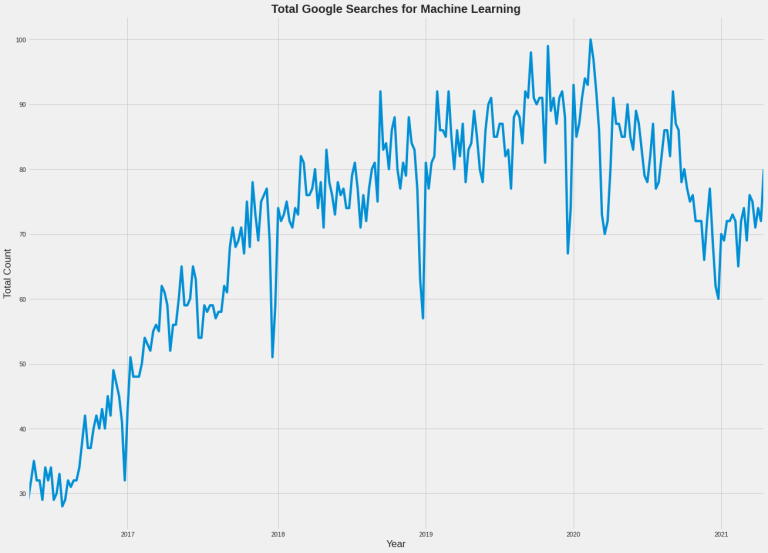
How To Start: You can get started using this tutorial by Aaman Kharwal, which guides you through analyzing trends via pytrends, an unofficial Google Trends API using Python.
Product Reviews Analysis
Online product reviews are one of the essential tools businesses have to boost their sales and credibility; according to Testimonial Engines, 72% of customers won’t take any buying actions until they’ve read reviews. A recent study by Harvard Business Review found that for every one-star increase a business gets on Yelp, they see a 5-9% increase in revenue.
With so many stakeholders and use cases, data scientists can empower marketing and sales teams by conducting product review analysis, which is critical to the growth of e-commerce businesses.
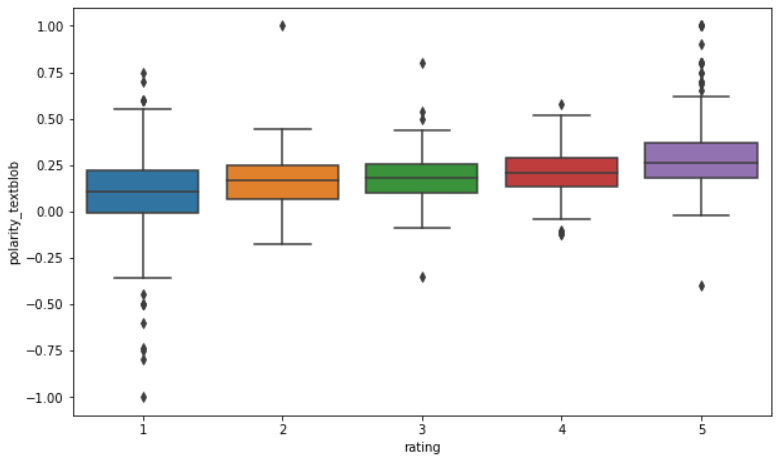
How To Start: Try your hand at building a product review analyzer on product review datasets for Amazon, GameStop, or even Mcdonald’s, and explore what insights the feedback can provide to businesses. You can use this tutorial by Gunnvant Saini to start the analysis using NLP or try this simple tutorial to perform it with Python.
Customer Segmentation Analysis
No two customers are the same, but their pain points, desires, and aspirations can be grouped in helpful ways to inform marketing strategies and drive conversions. Customer segmentation is the process of categorizing consumers based on the overlap of specific criteria in their attributes.
Data scientists can use specific machine learning algorithms to estimate the potential value of each ideal customer segment and the items most likely to appeal to them. Companies can then use this information to drive their content strategy, funnel optimization, and advanced lead targeting.
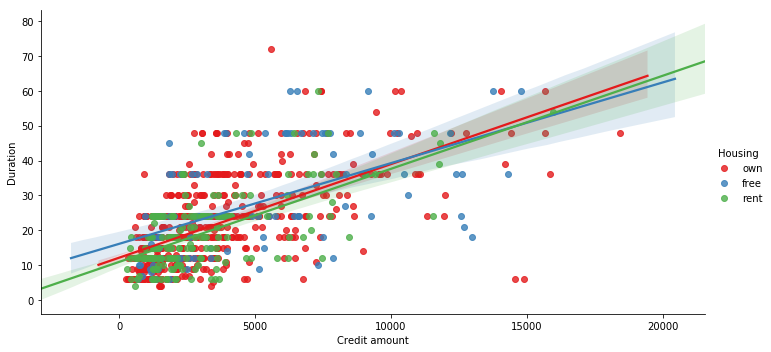
How To Start: Use any customer segmentation dataset available on Kaggle to work on this project idea. Start by importing Python libraries such as Pandas and NumPy for handling data frames, Matplotlib and seaborn for data visualization, Sklearn for machine learning algorithms, etc.
Product Recommendation System
When shopping online, a recommendation system steers you to the items you are most likely to buy. Users are often confused about alternatives and want help refining their search. Therefore, recommender systems are an essential part of our digital world. Invesp, the CRO experts, conducted a survey where 54% of retailers reported product recommendations as the critical driver of the average order value in customer purchase.
Robust predictive analytics systems are the foundation of recommender systems. We see recommender systems every time we go to Amazon or any other e-commerce site.
Whether using a collaborative or content-based filtering system, or a mix of both, a data scientist can help e-commerce businesses discover the big spenders and upsell them using the highest-rated product recommendations through segmentation, leading to an increase in revenue.
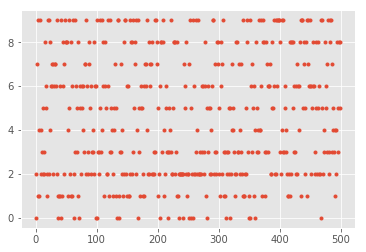
How To Start: You can use this Amazon product review dataset and the accompanying tutorial by Amar Shaw on Kaggle to build your collaborative filtering system based on customers’ purchase history and ratings.
Restaurant Sales Data Analysis
The global online food delivery market was valued at USD 189.70 billion in 2021 and is expected to expand at a compound annual growth rate (CAGR) of 10.8% from 2022 to 2028, with a slew of restaurants, aggregators, and independent cloud kitchens all vying for market share.
Using data science can help restaurant chains gain a competitive advantage. Analyzing sales data and performing EDA can help determine what items sell best, what customers prefer, where people are ordering certain things, what time of day, and whether analytics can group customers into different categories. Not only that, but data scientists can use information from food aggregators to investigate the market and learn more about foodie behaviors and preferences to serve them better.
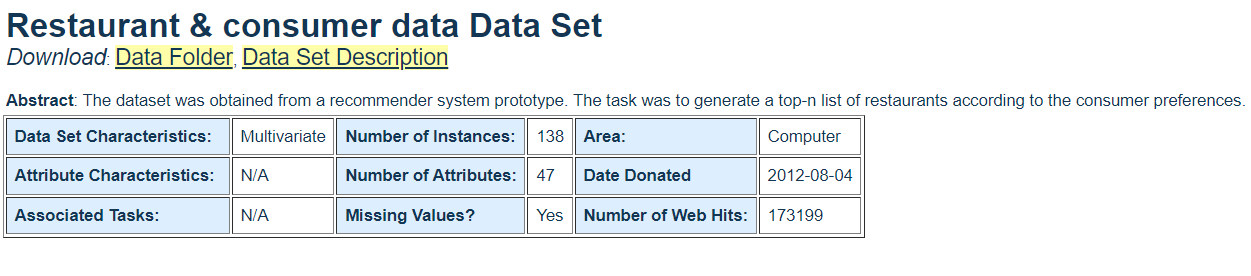
How To Start: You can use this restaurant and consumer dataset from UCI and follow this tutorial for sales data analysis by Pulkit Khandelwal. You can also check out this detailed tutorial by Hargurjeet for an EDA of Zomato’s restaurant dataset.
Market Basket Analysis
Market Basket Analysis is an innovative analytical technique that uses unsupervised learning to understand buying patterns and uncover correlations between purchases. The use of these strategies allows for the prediction of future buying decisions. In other words, it will enable retailers to see the relationship between the items people buy. Additionally, market basket analysis can significantly improve the effectiveness of marketing messages. In addition to your marketing message style, whether a direct offer, email, social media, phone call, or newsletter, you can offer the following best product for a specific consumer.
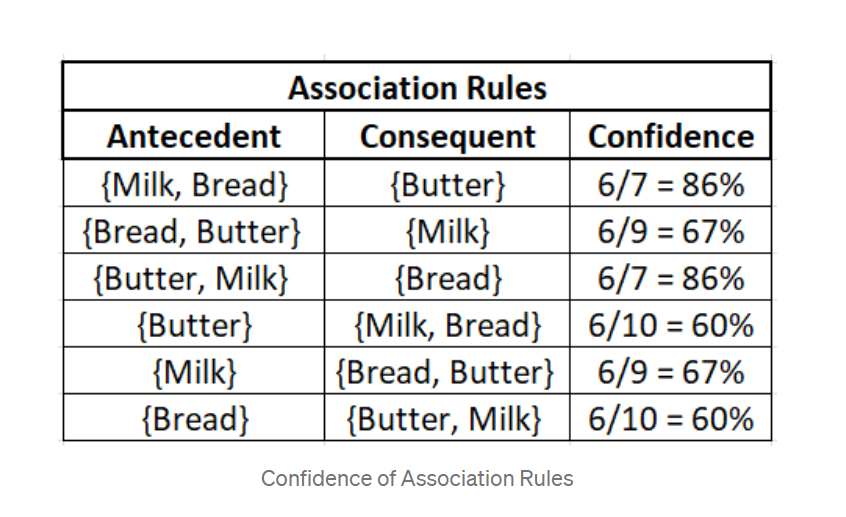
How To Start: Khushee Kapoor provided this excellent tutorial on Kaggle on performing market basket analysis along with a sample dataset that is very beginner-friendly.
Social Media Campaign Analysis
Social media platforms have become part of everyday life, and the number of tracking platforms is growing. However, people face significant challenges when properly harnessing these complex and noisy data streams.
Data scientists can cut through the noise by using their skills to collect, track, analyze and visualize all aspects of social media analytics data to uncover deep insights that give businesses a better understanding of their social footprint and nature and how to monetize and improve their online presence.
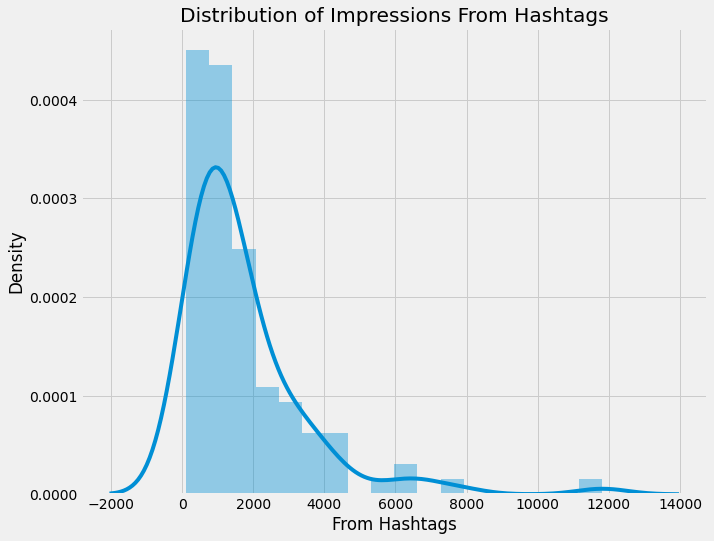
How To Start: The internet is full of social datasets like this one for Instagram and different platforms on Kaggle. Follow this tutorial by Aman Kharwal for an Instagram reach data analysis project.
Credit Card Fraud Detection Analysis
Cybersecurity is a vital part of our lives in a world where everything is digitized and online shopping is the norm. Credit card firms face significant challenges in detecting fraudulent credit card transactions to prevent consumers from being charged for products they did not purchase. According to a recent study by Intuit, the amount of fraud by new credit card accounts saw a 48% increase from 2019. Data scientists can overcome such challenges by combining their skills with machine learning.
A data scientist can create a model that tracks the patterns of all transactions and finds abnormal patterns, deeming them fishy and canceling the transaction. The trick is to find a good dataset and a suitable machine learning algorithm to perform such a task.

How To Start: You can use a credit card fraud detection dataset from Kaggle and follow this tutorial by Abdou Rockikz to build a classification model.
Marketing Campaign Budget Optimization
As a data scientist, you will perform various marketing tasks, but your main goal is to ensure that every dollar of your company’s marketing budget is spent wisely and profitably.
Optimizing who you market specific products to and when your business can spend its money on marketing tactics won’t yield results. Data scientists analyze the performance and results of all marketing campaigns to determine how to optimize spending, cut budgets, what areas to increase spending, and which products to focus on in different markets.
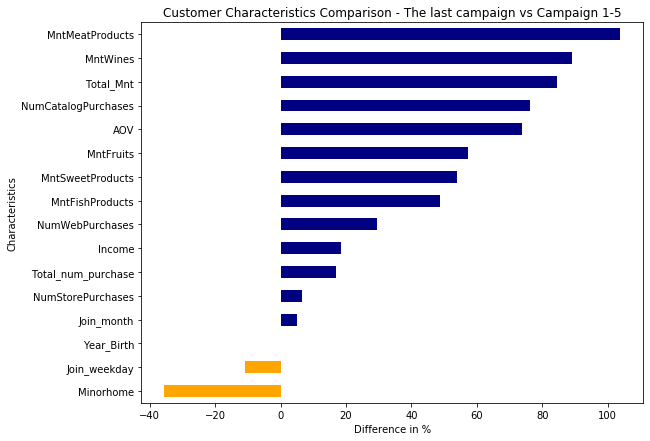
How To Start: John Chen created this easy-to-follow case study and tutorial to take you through the process of market budget optimization and analysis using a free dataset from Kaggle.
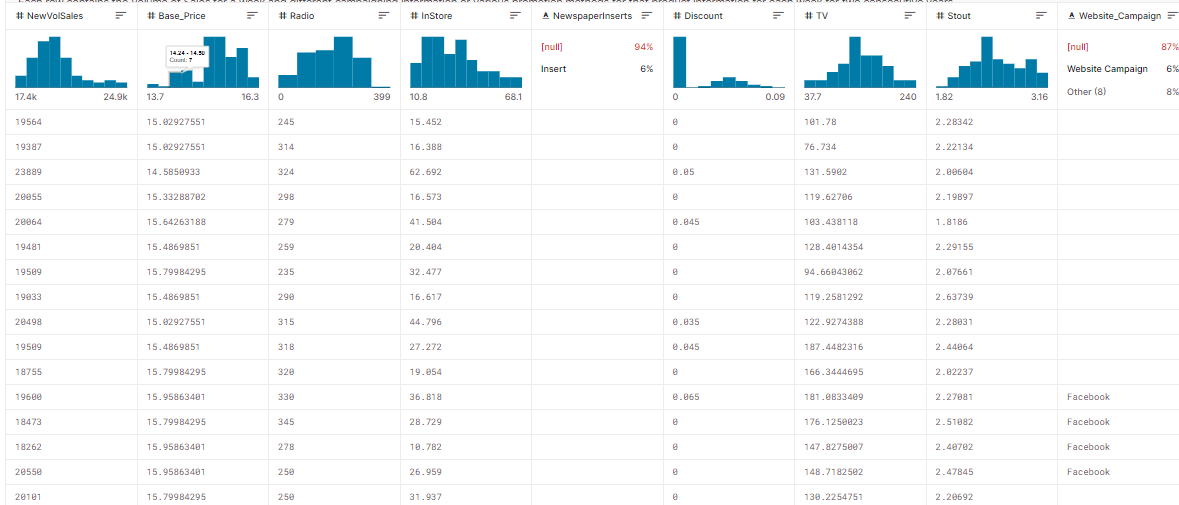
Marketing Mix Analysis
Uncover the impact of different marketing channels on sales and customer engagement by jumping into this dataset. Explore the effectiveness of various marketing mix elements and discover insights that can help optimize marketing budget allocation for better ROI.
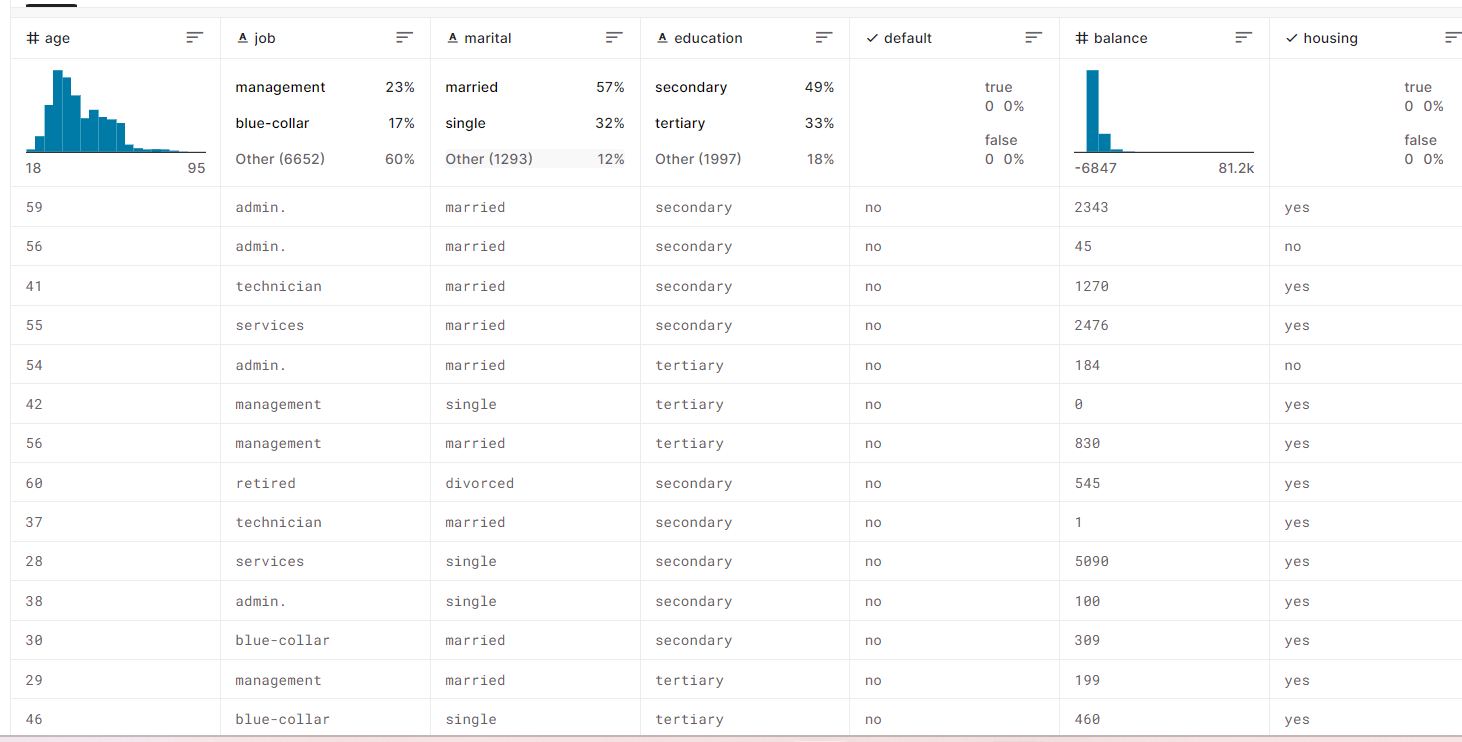
Bank Marketing Strategies
This is a dataset containing banking marketing strategies. Start by downloading this dataset. Analyze customer data to uncover insights on how different marketing campaigns affect customer responses. This dataset provides a rich ground for developing predictive models to enhance the effectiveness of marketing campaigns in the banking sector.
Lead Scoring
Converting leads into customers is challenging, and it is all about how you can tactfully guide them into your marketing funnel. Lead scoring uses analytics to identify potential buyers who go through this channel and decide to use your product or service. Reaching these prospects at the right time is what data scientists can do to help businesses.
Through extensive analysis of collected marketing data and insights from data libraries, data scientists can predict which offers or products are most attractive to customers and demographics at different times. The potential value of each lead can be assessed and then scored based on factors such as the behavior of similar customers, the choice of words they use when interacting with you, and the characteristics of the customer base to which they belong. This process will save companies from spending their marketing budgets on guesswork and trial and error.
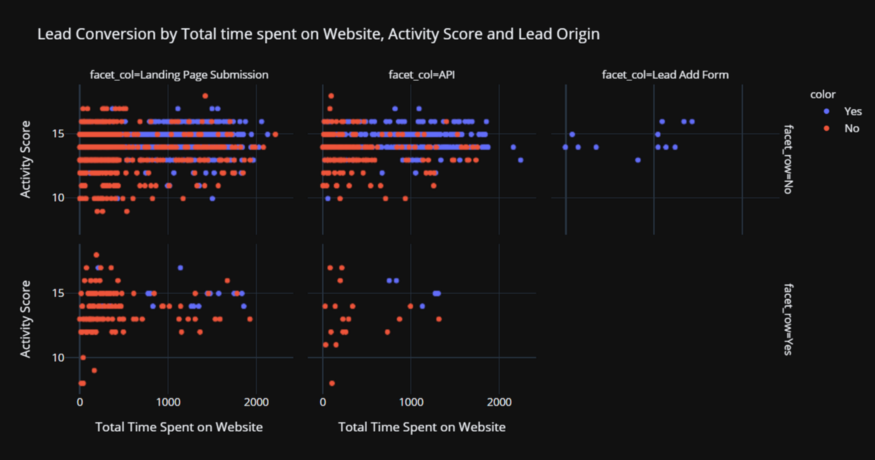
How To Start: This super detailed tutorial by Moez Ali takes you through the steps of starting a lead scoring analysis. You can also find different lead scoring datasets on Kaggle to perform various tests.
SMS Spam Classifier
Through extensive analysis of collected SMS data, data scientists can develop models that accurately predict whether a message is spam or ham. This process involves examining various features of the messages, such as the content, length, and specific keywords used. By doing so, businesses can efficiently filter out spam messages and focus on delivering valuable content to their customers.
How to Start: The provided dataset from Kaggle contains a collection of SMS messages labeled as “ham” or “spam.” This dataset can be used to train machine learning models to automatically classify new messages, saving time and resources while improving the accuracy of spam detection.
Data Professionals Salary Analysis
A recent analysis of salary data for data scientists in various companies reveals significant variations based on location, company size, and industry. These disparities highlight the importance of understanding market trends and the value of data science in deriving actionable insights.
Data scientists can utilize such datasets to build predictive models that forecast salary trends and help organizations make informed decisions about their hiring strategies. Using machine learning algorithms, they can identify patterns and predict future salary changes, ensuring that companies remain competitive and attract top talent.
How To Start: You can begin by exploring a salary dataset from Kaggle and following tutorials on salary prediction models using Python to build your own insights and contribute to data-driven decision-making in the job market.
More data science projects ideas and datasets
If you want to learn more about data science, projects are the perfect opportunity. You’ll find plenty of inspiration in our guides to data science projects:
- Top 10 Regression Datasets and Projects
- Top 10 Python Data Science Projects with Source Code
- Top 30 Data Science Projects with Source Code
- Top 12 Classification Machine Learning Projects and Datasets
- 21 Data Analytics Project Ideas and Datasets
- 10 Sentiment Analysis Project Ideas and Datasets
- 31 Free Datasets for Your Next Project