Netflix Data Scientist Interview Guide: 20 Real Questions & Winning Answers (2026)


Introduction
The Netflix data scientist role sits at the center of how one of the world’s largest streaming platforms makes decisions at scale. With more than 260 million members globally, Netflix relies on experimentation, causal inference, and product analytics to shape everything from personalization and content discovery to pricing, identity, and promotional strategy. Data scientists at Netflix are not support analysts. They are embedded partners who frame ambiguous problems, design rigorous experiments, and translate complex data into decisions that directly affect member experience and long-term growth.
The Netflix data scientist interview reflects that level of responsibility. You are evaluated on far more than whether you can write correct SQL or explain statistical formulas. Interviewers look for strong metric intuition, sound experimentation judgment, and the ability to reason clearly in open-ended scenarios where trade-offs matter. Just as importantly, they assess how you communicate insights, challenge assumptions, and operate within Netflix’s culture of freedom and responsibility. This guide walks through each stage of the Netflix data scientist interview, the most common data science specific interview questions candidates face, and practical strategies to help you prepare with confidence and stand out in a highly selective process.
Netflix Data Scientist Interview Process
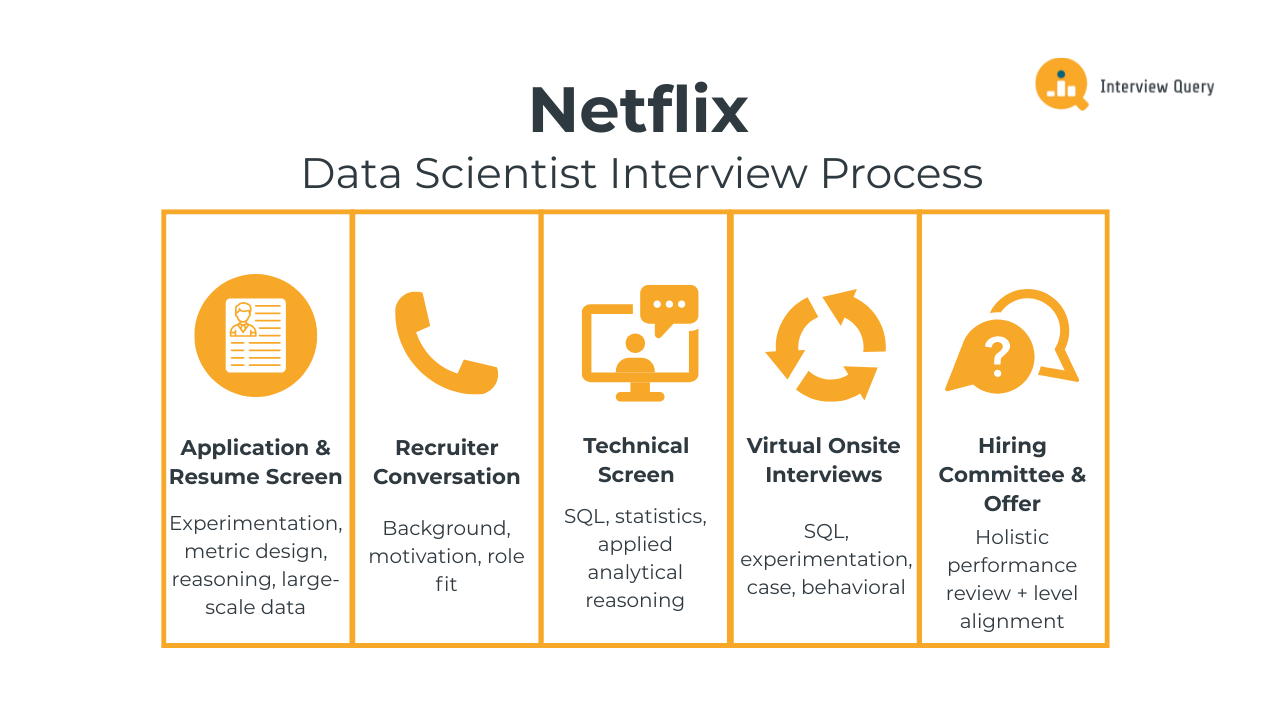
The Netflix data scientist interview process is designed to evaluate how you reason through ambiguous problems, design reliable measurement strategies, and turn analysis into decisions that matter at scale. Across each round, interviewers assess SQL and statistical fundamentals, experimentation judgment, product intuition, and how clearly you communicate trade-offs to cross-functional partners. Most candidates complete the full loop within three to six weeks, depending on role level and team alignment.
Below is a breakdown of each stage and what interviewers at Netflix consistently look for throughout the process.
Application and Resume Screen
During the initial resume review, Netflix recruiters look for evidence that you have worked on problems where data directly informed decisions. Strong resumes highlight experience with experimentation, metric design, causal reasoning, and large-scale behavioral data. Netflix places less emphasis on brand names and more on whether you can clearly articulate ownership, judgment, and measurable impact. Experience working closely with product, engineering, or content partners is especially valued.
Tip: Focus your resume on decisions you influenced, not just analyses you performed. Clearly showing how your work changed a product or strategy signals decision ownership, which is a core expectation for data scientists at Netflix.
Initial Recruiter Conversation
The recruiter call is a short, non-technical conversation focused on your background, motivation for Netflix, and overall role fit. Recruiters use this discussion to understand your experience with experimentation, analytics, or modeling, and to gauge whether your working style aligns with Netflix’s culture of freedom and responsibility. You will also discuss logistics such as location, interview timeline, and compensation expectations.
Tip: Be prepared to explain why Netflix’s way of working appeals to you. Demonstrating self-direction and comfort with autonomy shows cultural alignment, which carries real weight in hiring decisions.
Technical Screen
The technical screen usually consists of one interview that blends SQL, statistics, and applied analytical reasoning. You may be asked to write queries on user or content datasets, define metrics for a product change, interpret experiment results, or reason through data quality issues. Interviewers care less about perfect syntax and more about whether your approach is structured, your assumptions are explicit, and your conclusions are defensible.
Tip: Talk through your logic before and during your solution. Clear reasoning and metric intuition demonstrate analytical maturity, which matters more than speed in this round.
Virtual Onsite Interviews
The virtual onsite is the most in-depth part of the Netflix data scientist interview process. It typically includes four interviews, each lasting about 45 to 60 minutes. These rounds are designed to evaluate how you think across different dimensions of the role, from hands-on analysis to high-level decision making.
SQL and data analysis round: You will work through SQL problems that require querying large behavioral datasets, computing metrics, or investigating changes in user behavior. Examples include measuring engagement shifts, validating experiment integrity, or breaking down trends by cohort. Interviewers assess how you structure queries, handle edge cases, and connect results back to a meaningful question.
Tip: Always explain why a metric or aggregation answers the question being asked. This shows analytical intent, not just technical ability, and helps interviewers trust your conclusions.
Experimentation and causal inference round: This interview focuses on designing and evaluating experiments. You may be asked to design an A/B test, diagnose a failed experiment, or reason about bias, interference, or measurement error. Netflix interviewers look for sound judgment around trade-offs, not rigid textbook answers.
Tip: Call out potential failure modes proactively. Anticipating bias or unintended effects demonstrates strong experimental judgment, a skill that distinguishes senior candidates.
Product and business case round: In this round, you will tackle an open-ended product or business problem, such as evaluating a new feature, content strategy, or growth initiative. You are expected to clarify objectives, define success metrics, and reason through possible outcomes. Structure and clarity matter more than landing on a single “correct” answer.
Tip: Frame your analysis around decisions, not dashboards. Showing that you can guide a team toward a choice signals product partnership strength.
Behavioral and collaboration round: This interview assesses how you work with others, handle disagreement, and operate under ambiguity. Expect questions about influencing without authority, pushing back on flawed metrics, or learning from mistakes. Netflix values thoughtful communication and ownership over polished storytelling.
Tip: Be specific about what you learned and how it changed your approach. Demonstrating growth and self-awareness signals long-term impact potential.
Hiring Committee and Offer
After the onsite, each interviewer submits written feedback independently. A hiring committee reviews your performance holistically, focusing on technical strength, judgment, communication clarity, and cultural alignment. If approved, the team aligns on level and compensation before extending an offer. Team matching may also happen at this stage, depending on business needs and your experience.
Tip: If you have strong preferences around problem space or team type, communicate them clearly and early. Thoughtful alignment helps Netflix place you where you can have the most impact.
Want to strengthen your end-to-end data science skills? Explore our Data Science 50 learning path to practice a curated set of real-world data science interview questions designed to sharpen your SQL, statistics, experimentation, and product judgment, the exact skills Netflix evaluates in data scientists.
Challenge
Check your skills...
How prepared are you for working as a Data Scientist at Netflix?
Netflix Data Scientist Interview Questions
The Netflix data scientist interview includes a mix of SQL, analytics, experimentation, product reasoning, and causal thinking. These questions are designed to evaluate how you work with large-scale behavioral data, reason through ambiguity, and make decisions that balance short term metrics with long term member value. Interviewers are less interested in textbook answers and more focused on how you structure problems, choose metrics, and communicate trade-offs in realistic product scenarios at Netflix.
SQL and Analytics Interview Questions
In this part of the interview, Netflix focuses heavily on your ability to reason about user behavior using data. SQL questions often involve engagement analysis, retention metrics, cohort comparisons, and diagnosing unexpected changes in key metrics. The goal is to see whether you can translate a vague product question into clean, defensible analysis while being mindful of data quality and interpretation risks.
-
This question tests your ability to model social signals and recommendation logic using SQL joins and aggregations. Netflix asks this because many personalization problems involve combining behavioral signals across users while avoiding leakage or redundancy. To solve it, you would join users to their friends, join friends to their liked pages, exclude pages already liked by the user, then group by user and page and rank by the count of friend likes. The emphasis is on structuring joins correctly and reasoning about exclusions, not just writing syntactically correct SQL.
Tip: Explain why you exclude already liked pages before ranking. That shows recommendation judgment and signals you think about user value, not just query mechanics.
Write a query to compare engagement before and after a homepage change.
This question evaluates whether you can design a fair before-and-after comparison without falling into common analytical traps. Netflix asks this because product changes often ship continuously, and naive comparisons can easily mislead decisions. To answer it well, you should describe defining a clear change date, selecting symmetric time windows, segmenting by exposure where possible, and comparing consistent engagement metrics. You should also mention validating that traffic mix and content availability are comparable across periods before interpreting results.
Tip: Proactively naming confounders like seasonality or content launches shows analytical judgment, which Netflix values more than raw SQL complexity.
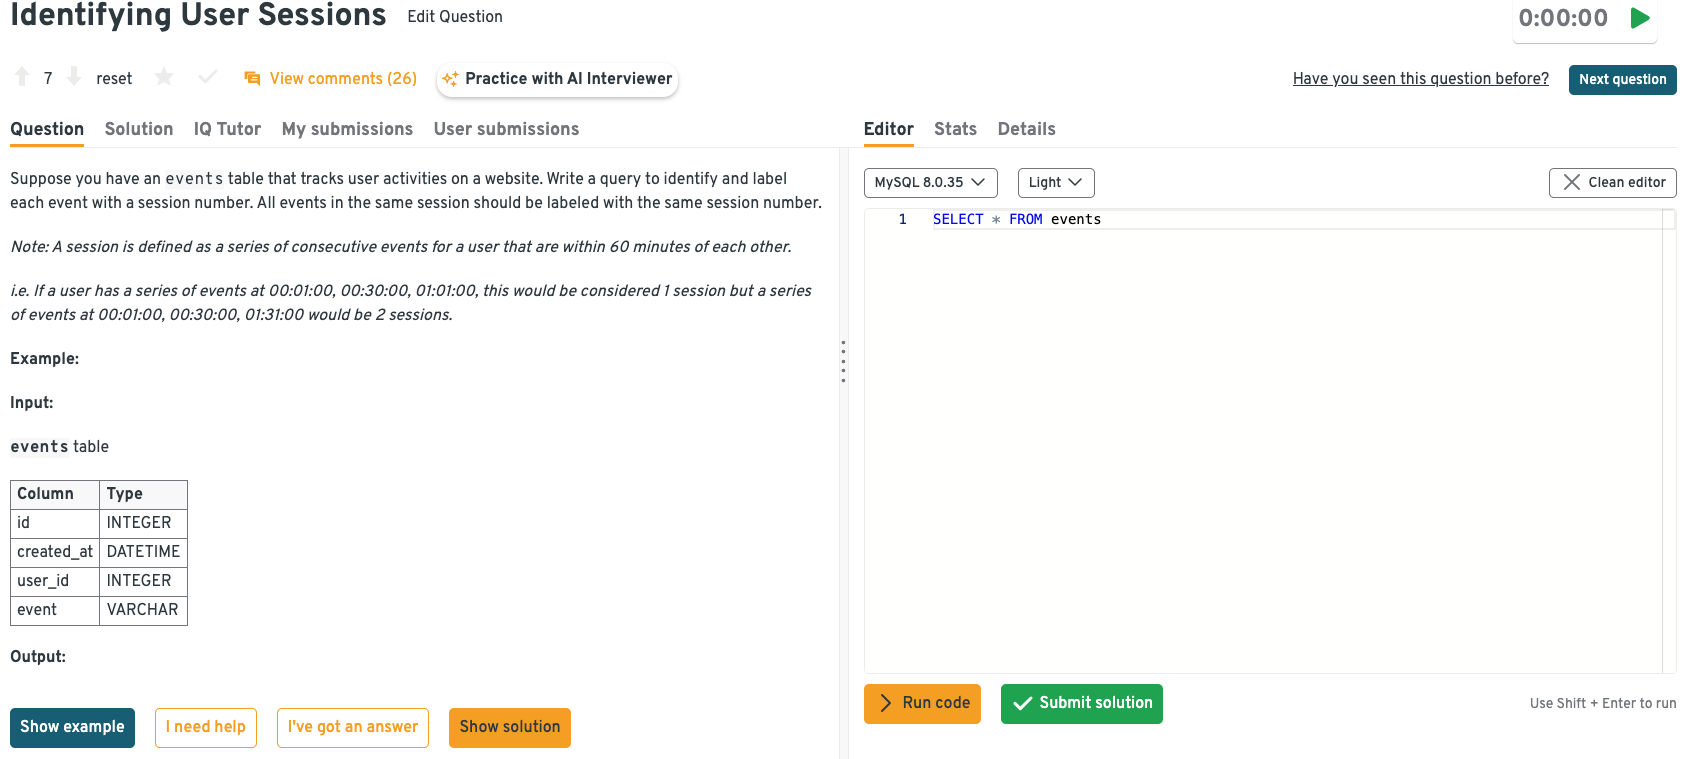
-
This question tests your understanding of user behavior modeling and window functions. Netflix cares about sessionization because many engagement metrics depend on grouping events into meaningful units of behavior. To solve this, you would order events by user and timestamp, use a window function like LAG to compute time gaps, flag new sessions when the gap exceeds 60 minutes, and then create a cumulative sum to assign session IDs. The key is explaining how the logic translates behavior into analysis-ready structure.
Tip: Call out edge cases like long pauses or duplicate timestamps. That signals you think about real data messiness, not just idealized examples.
Head to the Interview Query dashboard to practice Netflix–relevant data science interview questions in one place. You can work through SQL, analytics, case-style, and behavioral questions with built-in code execution and AI-guided feedback, making it easier to prepare for Netflix interviews.
-
This question assesses multi-signal scoring and careful filtering logic. Netflix asks questions like this to see how you combine heterogeneous signals into a single ranking while respecting constraints. To answer it, you would identify eligible candidates by excluding blocked users and existing friends, compute mutual friends and shared likes via joins, apply weighted scores, and then rank candidates to select the top result. Interviewers care about whether you explain the reasoning behind the score construction, not just the final query.
Tip: Briefly justify the weighting logic before writing SQL. That demonstrates decision awareness, which Netflix expects from senior data scientists.
How would you validate a spike in daily active users?
This question tests diagnostic thinking and skepticism toward surprising metrics. Netflix asks it because acting on false spikes can lead teams in the wrong direction. A strong answer walks through checking logging changes, experiment launches, traffic source shifts, bot activity, and definition changes before assuming real growth. You should explain how you would break the metric down by platform, geography, and cohort to isolate the driver, then confirm whether the spike reflects sustained behavior.
Tip: Treat anomalies as hypotheses to test, not truths to celebrate. That mindset signals reliability and protects decision quality at Netflix.
Watch next: Netflix Data Scientist Interview Question: Measure Free Trial Success with A/B Testing
In this question deep dive, we walk through a classic Netflix data science interview question on measuring the success of a thirty day free trial. The video shows how Netflix data scientists frame growth problems end to end, starting from defining acquisition and retention goals, mapping the full user funnel, and selecting core metrics, retention curves, lifetime value, and customer acquisition cost. It also covers how to think about experimentation and causal inference when evaluating trial changes. This breakdown is especially valuable for candidates preparing for Netflix data scientist interviews, where clear metric judgment and decision-focused reasoning matters most.
Experimentation and Causal Inference Interview Questions
This section focuses on how you design experiments under real product constraints and reason about causality when clean randomization is imperfect. Netflix uses these questions to evaluate judgment, risk awareness, and your ability to protect decision quality when experimentation directly influences member experience, content strategy, and long-term retention at Netflix.
How would you design an experiment to test a new recommendation algorithm?
This question tests whether you can balance experimental rigor with business and member risk. Netflix asks it because recommendation changes can have irreversible effects on engagement and retention. A strong answer explains choosing the right unit of randomization, defining primary and guardrail metrics like retention or satisfaction proxies, and monitoring both short-term engagement and longer-term outcomes. You should also discuss exposure consistency, interference between users, and how you would stage rollout if early signals are mixed.
Tip: Always name the top failure modes before the success metrics. That demonstrates experimental judgment and shows you prioritize protecting member experience, not just detecting lift.
-
This question evaluates cohort selection and causal inference under selection constraints. Netflix asks it because content launches often rely on limited early exposure to manage risk. To answer well, explain how you would define eligibility, ensure representativeness across key dimensions like geography and taste profiles, and avoid early adopter bias. You should also outline success metrics, comparison groups, and how you would extrapolate learnings cautiously to a broader audience.
Tip: Emphasize representativeness over early enthusiasm. Netflix values launch decisions grounded in signal quality, not just positive early reactions.
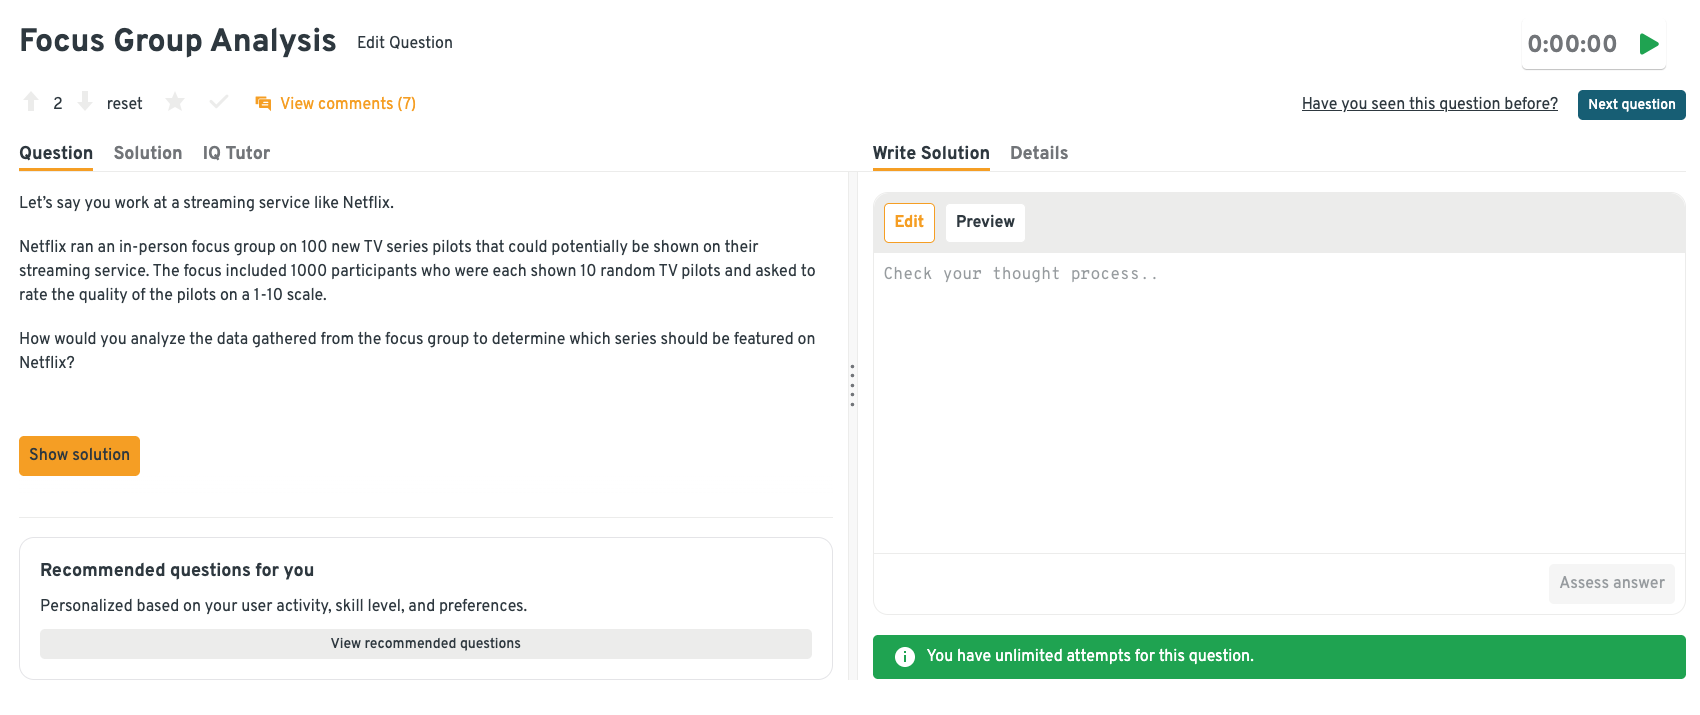
-
This question tests your ability to reason about partial exposure and noisy preference data. Netflix asks it because content decisions often rely on incomplete, subjective signals. A strong answer explains how you would normalize ratings across participants, account for reviewer bias, and compare pilots using confidence intervals rather than raw averages. You should also discuss how these signals complement, rather than replace, behavioral data.
Tip: Call out uncertainty explicitly. Showing restraint in content prioritization signals decision maturity, which Netflix values more than overconfident rankings.
Head to the Interview Query dashboard to practice Netflix–relevant data science interview questions in one place. You can work through SQL, analytics, case-style, and behavioral questions with built-in code execution and AI-guided feedback, making it easier to prepare for Netflix interviews.
-
This question evaluates metric consistency and analytical integrity. Netflix asks it because inconsistent metric definitions can invalidate experiment conclusions. To answer it, explain how you would standardize conversion logic where possible, or compute variant-specific metrics while clearly labeling differences. You should also describe how you would structure the query to avoid mixing denominators or misinterpreting results.
Tip: Always surface metric asymmetry before presenting results. Protecting metric trust is a core responsibility for Netflix data scientists.
How do you validate experiment results after launch?
This question tests your understanding of external validity and long-term ownership. Netflix asks it because experiment wins can decay or reverse after rollout. A strong answer explains monitoring post-launch metrics, comparing results to holdouts or historical baselines, and watching for regression to the mean or behavior shifts. You should frame validation as an ongoing process, not a final checkpoint.
Tip: Treat launch as the start of learning, not the end. Long-term validation signals accountability and decision ownership, which Netflix expects at senior levels.
Struggling with take-home assignments? Get structured practice with Interview Query’s Take-Home Test Prep and learn how to ace real case studies.
Product and Business Case Interview Questions
This section evaluates how well you turn analysis into decisions when the problem is ambiguous, multi-dimensional, and tied directly to business outcomes. Netflix uses these questions to assess whether you can define success clearly, choose the right analytical depth, and guide teams toward action when trade-offs are unavoidable and data signals are imperfect.
-
This question tests your ability to separate short-term acquisition from long-term value. Netflix asks it because free trials can inflate top-of-funnel metrics without delivering durable retention. A strong answer explains how you would track conversion to paid, early engagement quality, and medium-term retention compared to non-trial cohorts. You should also discuss counterfactuals, such as whether these users would have joined anyway, and how trial length influences downstream behavior.
Tip: Emphasize retention-adjusted conversion, not just signup volume. That shows you optimize for long-term member value, which is how Netflix evaluates growth decisions.
-
This question evaluates causal reasoning in the presence of multiple confounders. Netflix asks it because pricing decisions interact with content quality, household context, and alternatives. A strong answer discusses using pricing experiments where possible, supplemented by cohort comparisons, elasticity analysis, and behavioral proxies such as churn sensitivity after price changes. You should explain how you would avoid over-attributing decisions to price alone.
Tip: Explicitly separate correlation from causation in your explanation. Protecting decision integrity around pricing is a core responsibility for Netflix data scientists.
-
This question tests your ability to value content beyond raw view counts. Netflix asks it because licensing decisions require weighing cost against incremental member value. A strong answer explains how you would estimate incremental retention, reactivation, and engagement attributable to the title, compared against a counterfactual where the content leaves the platform. You should also discuss uncertainty and scenario ranges rather than a single point estimate.
Tip: Frame your output as a decision range, not a precise number. That signals judgment and helps leaders make informed trade-offs under uncertainty.
-
This question evaluates segmentation and prioritization. Netflix asks it because not all inactive users are worth reactivating. A strong answer explains how you would segment by past engagement depth, content preferences, and likelihood to return, then align actions accordingly. You should discuss distinguishing between churned users and temporarily dormant ones before recommending interventions.
Tip: Be explicit about who you would not target. Showing restraint demonstrates resource prioritization, a key senior-level signal at Netflix.
-
This question tests cross-market reasoning and hypothesis generation. Netflix asks it because international differences often reflect a mix of product, pricing, content, and market factors. A strong answer outlines how you would compare acquisition channels, content availability, payment friction, and early engagement behavior while controlling for user mix. You should avoid assuming a single driver without evidence.
Tip: Start with hypotheses, not conclusions. Structured exploration across markets signals disciplined business analysis and prevents oversimplified narratives.
Looking for hands-on problem-solving? Test your skills with real-world challenges from top companies. Ideal for sharpening your thinking before interviews and showcasing your problem solving ability.
Behavioral and Collaboration Interview Questions
Behavioral interviews at Netflix evaluates how you operate in Netflix’s high-autonomy environment, where data scientists are expected to exercise judgment, challenge assumptions, and influence decisions without relying on heavy process. These questions help interviewers understand how you communicate, prioritize, and take ownership when the stakes are high and direction is intentionally loose at Netflix.
Tell me about a time you challenged a widely used metric.
This question tests intellectual honesty, judgment, and your ability to improve decision quality without creating friction. Netflix asks it because widely adopted metrics often become defaults, even when they no longer reflect member value. Interviewers want to see whether you can respectfully question assumptions, back your perspective with data, and influence change.
Sample answer: In a previous role, my team relied heavily on a single engagement metric to evaluate a homepage change. I noticed it was increasing even as short-term retention declined. I analyzed downstream behavior, showed that the metric was overly sensitive to accidental clicks, and presented an alternative metric tied to session depth. After aligning with product partners, we updated our success criteria, which changed the launch decision and avoided a retention regression.
Tip: Focus on how you improved the decision, not how you proved others wrong. Netflix values judgment and trust-building over being technically correct.
Describe a time your analysis changed a product decision.
This question evaluates influence and accountability. Netflix wants to know whether your work leads to action and whether you are comfortable owning the outcome. Strong answers clearly connect analysis to a concrete decision and business impact.
Sample answer: I analyzed an experiment that showed a statistically significant lift in engagement but also a subtle increase in early churn. I segmented users by tenure and showed the lift came mostly from new users while long-term members were negatively affected. Based on this, I recommended limiting rollout to new members only. The team adopted this approach, preserving retention while still capturing growth upside.
Tip: Always anchor your story around the decision that changed. Netflix looks for data scientists who move teams forward, not just surface insights.
How would you convey insights and the methods you use to a non-technical audience?
This question assesses communication clarity and empathy. Netflix data scientists regularly present to product leaders who care about decisions, not methodology. Interviewers want to see how you simplify without distorting the truth.
Sample answer: When presenting to non-technical partners, I start with the recommendation and why it matters, then explain the logic using visuals and plain language. For a recent analysis, I avoided statistical jargon and instead explained confidence using concrete scenarios. I offered to share deeper technical details separately, which helped stakeholders act quickly without feeling overwhelmed.
Tip: Lead with the decision, then layer in detail only as needed. This shows you respect stakeholders’ time and understand how analytics is consumed at Netflix.
-
This question evaluates adaptability and collaboration under tension. Netflix asks it because disagreement is common and healthy, but only if handled constructively. Interviewers want to see how you recover trust and realign.
Sample answer: I once presented an analysis that product partners felt was too abstract to act on. I scheduled a follow-up, asked what decisions they needed to make, and reworked the analysis around those questions. By tying metrics directly to launch options, we aligned quickly and moved forward. The revised approach became the template for future analyses.
Tip: Emphasize how you adjusted your approach. Netflix values data scientists who adapt communication to enable action, not defend their first version.
How do you decide what not to analyze?
This question tests prioritization and senior judgment. Netflix asks it because not all analyses are worth the time, even if they are interesting. Strong candidates show they can say no thoughtfully.
Sample answer: I start by asking what decision the analysis would change. If the answer is unclear or the expected impact is small, I deprioritize it. In one case, I declined a deep-dive request and instead proposed a lightweight check that confirmed the risk was low. That freed time for higher-impact work and was appreciated by the team.
Tip: Explicitly tying analysis to decisions signals senior-level prioritization, which Netflix values more than analytical thoroughness alone.
If you want to practice these question types in a realistic setting, the Interview Query question bank and mock interviews are some of the most effective ways to build speed, confidence, and Netflix-level analytical judgment before a Netflix data scientist interview.
What Does a Netflix Data Scientist Do?
A Netflix data scientist designs the measurement systems and analytical approaches that guide product and content decisions for a global streaming service. The role is deeply end-to-end: you translate a fuzzy business question into a measurable hypothesis, define metrics that capture member value, design experiments or quasi-experiments, and turn results into a decision that a cross-functional team can act on. Depending on the team, you might evaluate recommendation changes, quantify the impact of promotional media, improve identity and account integrity, or build causal frameworks that separate true uplift from noise in member behavior.
| What They Work On | Core Skills Used | Tools And Methods | Why It Matters At Netflix |
|---|---|---|---|
| Personalization and recommendations measurement | Metric design, causal inference, segmentation | A/B testing, uplift analysis, heterogeneous treatment effects | Ensures recommendation changes improve engagement without harming long-term retention |
| Experimentation strategy for product launches | Experimental design, power analysis, bias detection | Sample ratio mismatch checks, guardrail metrics, sequential testing | Helps teams ship confidently by preventing false wins and hidden regressions |
| Content and studio decision support | Forecasting, causal attribution, uncertainty communication | Incrementality studies, counterfactual analysis, scenario modeling | Informs what to invest in and how to position content for different audiences |
| Growth, pricing, and plan analysis | Elasticity thinking, cohort analysis, confounding control | Difference in differences, propensity methods, survival analysis | Separates short-term conversion spikes from durable subscriber value |
| Identity and account integrity analytics | Anomaly detection, risk reasoning, metric instrumentation | Funnel diagnostics, rule evaluation, experimentation on interventions | Protects member experience while reducing friction and fraud-related losses |
Tip: Netflix interviewers want to see that you can drive decisions, not just analyses. When you explain past work, make the “so what” unavoidable: the metric choice you made, the trade-off you protected (for example, retention versus clicks), and the decision you enabled. That signals product judgment and stakeholder influence, which is what separates strong candidates here.
How to Prepare for a Netflix Data Scientist Interview
Preparing for the Netflix data scientist interview requires a different mindset than standard data science prep. You are not training for isolated SQL puzzles or abstract modeling questions. You are preparing to reason about real product decisions, imperfect data, and trade-offs that affect millions of members. Success comes from sharpening judgment, metric intuition, and communication just as much as technical depth.
Read more: How to Prepare for Data Science Interviews
The guidance below focuses on skills that consistently differentiate strong candidates at Netflix.
Build strong metric instincts around member value: Netflix data scientists are trusted to define success correctly. Practice articulating why a metric matters, what it misses, and how it could be gamed. Go beyond engagement counts and think about retention quality, satisfaction proxies, and unintended incentives.
Tip: In interviews, explicitly state why you rejected alternative metrics. This shows metric judgment and signals that you protect decision quality, not just analytical convenience.
Practice structured thinking for ambiguous problems: Netflix interview questions are intentionally open-ended. Train yourself to pause, clarify objectives, outline possible paths, and then choose a direction. Interviewers care more about your structure than about covering every angle.
Tip: Say your structure out loud before diving in. Clear framing demonstrates senior level reasoning and helps interviewers follow your logic under ambiguity.
Develop fluency in causal reasoning without overreliance on experiments: Not every Netflix problem can be solved with a clean A/B test. Practice explaining how you would use observational data, natural experiments, or sensitivity analysis when randomization is limited or risky.
Tip: Calling out assumptions and limitations proactively signals intellectual honesty, a trait highly valued in Netflix data scientists.
Refine how you communicate insights to non-technical partners: Netflix data scientists work closely with product, engineering, and leadership. Practice explaining results in plain language, leading with the decision, and backing it up with just enough evidence.
Tip: Start explanations with the recommendation, then justify it. This mirrors how analytics is actually consumed inside Netflix.
Prepare a small set of high-quality project stories: Interviewers often dig deeply into one or two examples. Choose projects where you owned the problem, made trade-offs, and influenced a decision. Be ready to explain what you would do differently today.
Tip: Highlight moments where you chose not to pursue an analysis. Demonstrating prioritization shows judgment, not gaps.
Simulate realistic interview pacing: Practice answering one analytical question, one experimentation problem, and one behavioral prompt back to back. This helps you manage cognitive load and maintain clarity under pressure.
Tip: After each mock, note where your explanations felt fuzzy. Tightening those moments often has the biggest impact on interview performance.
Want to get realistic practice on data science questions? Try Interview Query’s AI Interviewer for tailored feedback that mirrors the way Netflix evaluates data scientists in real interview settings.
Salary and Compensation for Netflix Data Scientists
Netflix’s compensation framework is designed to reward data scientists who consistently drive high-impact decisions through experimentation, causal reasoning, and strong product judgment. Data scientists receive competitive base pay, meaningful annual bonuses, and substantial equity grants that reflect Netflix’s emphasis on ownership and long-term impact. Your total compensation depends heavily on level, scope of responsibility, and location, with most candidates interviewing at the senior individual contributor level. Netflix does not use rigid compensation bands publicly, but market data provides a reliable benchmark for what to expect.
Read more: Data Scientist Salary
Tip: Clarify the level you are being considered for early. At Netflix, level determines expectations around judgment and scope, and compensation can vary significantly even with similar titles.
Netflix Data Scientist Compensation Overview (2026)
| Level | Role Title | Total Compensation (USD) | Base Salary | Bonus | Equity (RSUs) | Signing / Relocation |
|---|---|---|---|---|---|---|
| L4 | Data Scientist (Mid Level) | $190K – $260K | $160K–$190K | Performance based | Included | Offered selectively |
| L5 | Senior Data Scientist | $240K – $340K | $180K–$220K | Above target possible | Significant RSUs | Common for senior hires |
| L6 | Staff / Principal Data Scientist | $320K – $450K+ | $200K–$260K | High performer bonuses | Large RSUs + refreshers | Frequently offered |
Note: These estimates are aggregated from data on Levels.fyi, Glassdoor, TeamBlind, public job postings, and Interview Query’s internal salary database.
Tip: Netflix compensation tends to skew more heavily toward base salary and equity than bonus. Understanding that mix helps you compare offers more accurately.
Average Base Salary
Average Total Compensation
Negotiation Tips That Work for Netflix
Negotiating compensation at Netflix is most effective when you approach the conversation with clarity, confidence, and market awareness. Recruiters expect candidates to be informed and direct, especially at senior levels.
- Confirm level and scope before negotiating numbers: A Senior versus Staff data scientist distinction can shift total compensation by six figures. Make sure the level matches the scope of responsibility discussed in interviews.
- Anchor with credible benchmarks: Use data from Levels.fyi, Glassdoor, and Interview Query salary insights. Frame your value through decisions you have owned, experiments you have led, and measurable impact you have delivered.
- Account for location and role flexibility: Netflix compensation differs across the Bay Area, New York, Los Angeles, and remote roles. Ask explicitly for location-specific ranges so you evaluate the offer accurately.
Tip: Always request a full breakdown including base salary, equity value, vesting schedule, and any signing incentives. Senior Netflix data scientists are expected to negotiate from a well-informed position, and doing so signals confidence and judgment rather than entitlement.
FAQs
How long does the Netflix data scientist interview process take?
Most candidates complete the Netflix interview process within three to six weeks. Timelines vary based on interviewer availability, level calibration, and whether multiple teams are reviewing your profile. Recruiters usually share clear next steps after each stage.
How technical is the Netflix data scientist interview compared to other companies?
Netflix interviews are less about trick questions and more about applied reasoning. You are expected to be comfortable with SQL, metrics, and experimentation, but interviewers focus heavily on judgment, decision making, and how you reason through ambiguous problems.
Does Netflix require heavy machine learning knowledge for data scientists?
It depends on the team. Some roles focus more on experimentation, analytics, and causal inference, while others lean closer to applied modeling. What matters most is your ability to choose the right level of complexity for the decision, not using advanced models by default.
Are Netflix interviews more product focused or analytics focused?
They are strongly product focused. Netflix data scientists are expected to influence decisions, not just report metrics. Interviewers look for candidates who connect analysis to product impact and can explain trade-offs clearly to non-technical partners.
How important is experimentation experience at Netflix?
Experimentation experience is critical. You should be comfortable designing tests, defining success metrics, and reasoning about bias or unexpected outcomes. Even when experiments are not feasible, interviewers expect strong causal thinking.
What makes a candidate stand out in Netflix behavioral interviews?
Ownership and judgment matter most. Strong candidates show they can challenge assumptions, make decisions with incomplete data, and learn from mistakes. Netflix values thoughtful disagreement and accountability over polished but shallow stories.
Does Netflix allow remote interviews and remote roles?
Yes. Most interviews are conducted virtually, and many data scientist roles are remote depending on team and location. Compensation and expectations may vary by location, so clarify this early with your recruiter.
How should I prepare my past projects for Netflix interviews?
Focus on one or two projects where you owned the problem end to end. Be ready to explain the decision context, metric choices, trade-offs you made, and what changed because of your work. Interviewers care more about impact than technical novelty.
Become A Netflix Data Scientist With Interview Query
Preparing for the Netflix data scientist interview means building strong analytical judgment, deep experimentation intuition, and the ability to turn ambiguous questions into clear product decisions. By understanding Netflix’s interview structure, practicing real-world SQL and experimentation scenarios, and refining how you communicate insights, you can approach each stage with confidence. For targeted preparation, explore the full Interview Query question bank, practice with the AI Interviewer, or work one-on-one with an expert through Interview Query’s Coaching Program to sharpen your thinking and stand out in Netflix’s highly selective data science hiring process.
Discussion & Interview Experiences