
Netflix Data Analyst Interview Guide (2025) – Questions, Process & Salary


Introduction
Netflix’s platform streams billions of hours of content every day, driven by insights from sophisticated analytics teams. Landing a role as a data analyst here means demonstrating your ability to translate vast user-event datasets into strategic decisions. This guide will walk you through the Netflix data analyst interview process, outline the types of questions you’ll face, and share best practices to help you shine.
Role Overview & Culture
Netflix data analyst roles are built around transforming massive volumes of viewing and engagement metrics into clear, actionable insights that drive retention and content strategy. You’ll own end-to-end analytics workflows—designing dashboards in SQL or Python, running ad-hoc investigations, and partnering closely with product and engineering teams. Netflix empowers you with a Freedom & Responsibility culture: you choose the tools and frameworks that work best, ship high-quality dashboards rapidly, and iterate based on real-time feedback. Day to day, you might dive into cohort analyses to inform green-lighting decisions or optimize personalization algorithms to boost user engagement.
Why This Role at Netflix?
Joining as a data analyst Netflix means influencing some of the most critical content and product decisions at a company serving over 200 million members. You’ll work on projects that shape what shows get developed, refine recommendation engines, and support pricing experiments—all while enjoying compensation in the top quintile of the market. There’s also a clear career path from analytics into Analytics Engineering or Data Science, letting you grow your technical expertise or leadership scope. Next, we’ll break down the multi-stage interview process you’ll navigate to join Netflix’s elite analytics team.
What Is the Interview Process Like for a Data Analyst Role at Netflix?
The Netflix data analytics interview loop is designed to assess both your technical chops and your business intuition. You’ll move through a recruiter screen, tackle hands-on SQL and spreadsheet cases, and demonstrate how you draw insights that drive real product decisions. Below is a breakdown of each stage and what to expect.
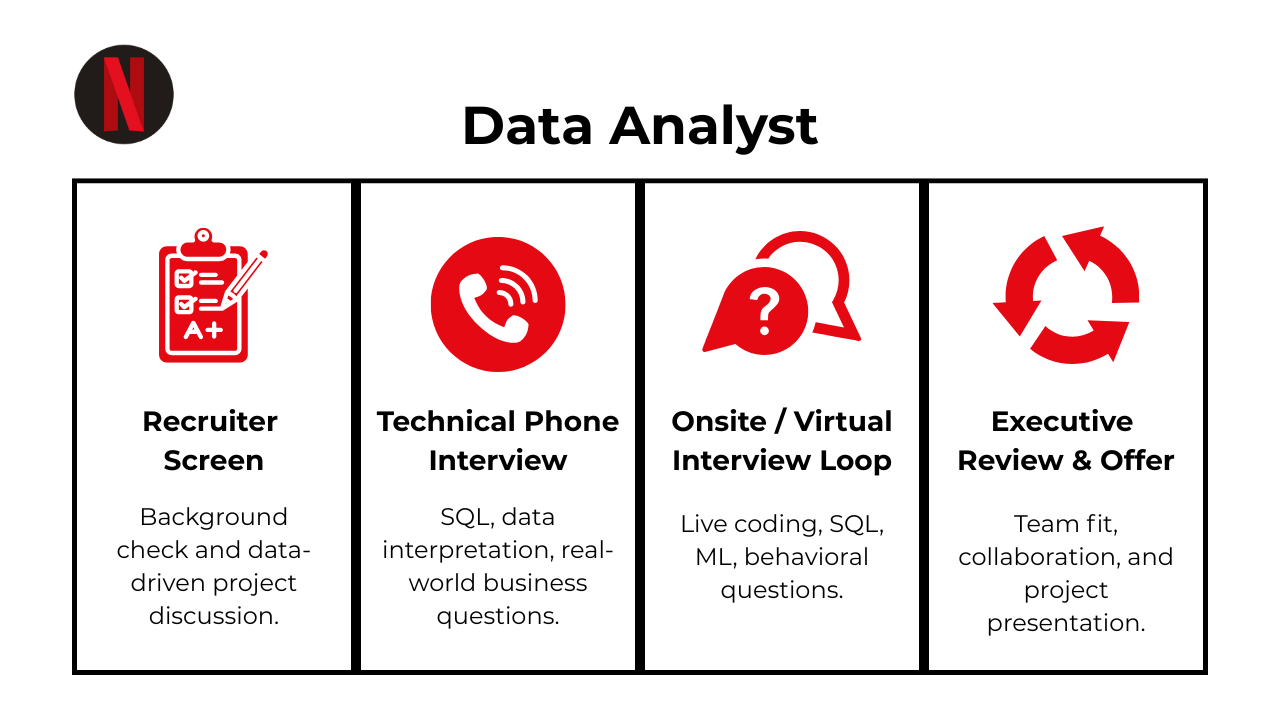
Application & Recruiter Screen
Your résumé and cover letter are reviewed for relevance to analytics and product metrics. The recruiter will check for SQL experience, familiarity with data visualization tools, and your motivation for joining Netflix’s Freedom & Responsibility culture. Be prepared to discuss past projects briefly.
Technical Screen
This 45-minute session tests your practical skills via a live SQL exercise and a mini-case in Excel or Google Sheets. You may be asked to write window-function queries, perform group-by aggregations, or build a simple dashboard mockup. Focus on writing clean, well-commented queries and explaining your analytical approach clearly.
Virtual On-Site
You’ll join two technical rounds (deep SQL drills), a product-sense case where you interpret data to recommend feature changes, and a behavioral interview to evaluate culture fit. Expect to walk through query logic, justify metric choices, and illustrate how your analyses inform strategic decisions.
Hiring Committee & Offer
After your interviews, a cross-functional committee reviews feedback and calibrates levels and compensation. Netflix benchmarks pay to the top of market, so this stage also involves aligning on salary bands and RSU grants.
Behind the Scenes
Interviewers submit feedback within 24 hours, and hiring managers use a “keeper test” mindset—only candidates who excel across all dimensions move forward. You’ll receive updates promptly to keep the process transparent.
Differences by Level
Entry-level analysts (L3) focus more on core SQL and basic visualization; senior analysts (L4+) present a 30-minute business deep-dive on a real metric, showcasing end-to-end ownership and strategic impact.
Up next, we’ll explore the specific questions you can expect in a Netflix data analyst interview.
Challenge
Check your skills...
How prepared are you for working as a Data Analyst at Netflix?
What Questions Are Asked in a Netflix Data Analyst Interview?
When preparing for a Netflix data analyst interview, you should be ready to showcase both deep SQL expertise and a strong sense for product metrics. From writing efficient queries to drive insights on viewer retention to designing experiments that guide feature decisions, the process examines multiple facets of the role. As a data analyst Netflix candidate, you’ll also need to demonstrate how you approach ambiguity and collaborate cross-functionally. Below are the primary question categories you can expect.
SQL / Technical Questions
In Netflix’s world of Netflix big data analytics, these questions assess your ability to write optimized SQL for high-volume datasets. You’ll need to craft window-function queries to calculate rolling retention, detect anomalies in content consumption patterns, and build robust ETL pipelines. Interviewers look for clean, efficient code, proper use of indexing and partitions, and a clear explanation of your thought process—ensuring your solutions scale with billions of daily events.
-
Use window functions: partition rows by
product_id, order bysale_date, and pull the two prior-day totals withLAG(). Multiply each lag by its weight, sum them with the current-day value, and filter out rows where either lag isNULLto satisfy the “two or more preceding dates” rule. Casting to two-decimal precision prepares the metric for executive dashboards. The pattern is common for smoothing daily revenue volatility without sacrificing recency. Compute a weighted-average campaign score where open-rate weight = 0.3 and click-rate weight = 0.7.
Aggregate each campaign’s open-rate and click-rate, apply the given multipliers, and add them for a single effectiveness score. Aliasing the result (
AS weighted_score) makes downstream ranking straightforward. Highlighting how to handle NULL rates or zero-send campaigns shows attention to edge cases. Analysts often surface this KPI to prioritize future email budget.What percentage of users held “Data Analyst” immediately before becoming “Data Scientist”?
Partition each user’s job-history by
user_id, order by start date, and compare each title with its lead row viaLEAD(). Count users whose previous row is “Data Analyst” and current row is “Data Scientist,” divide by distinct users, and round to two decimals. This ordered-event technique is a staple for career-path or funnel transition studies. Calling out timezone normalization for international résumés adds polish.Select a random car manufacturer’s name with uniform probability.
Two idioms work: PostgreSQL’s
ORDER BY RANDOM() LIMIT 1or MySQL’sRAND(). On very large tables, a more efficient approach samples byTABLESAMPLEor uses a random offset between 1 andMAX(id)seeded by the RNG. The interviewer wants to see that you understand uniformity and when naïve shuffles become performance bottlenecks.Label each web-event row with a session number where a session ends after 60 minutes of inactivity.
Within each
user_id, useLAG(event_ts)to compute minute gaps; flag a new session whenever the gap > 60. A cumulativeSUM(new_session_flag)yields a monotonically increasingsession_idyou can append to every row. This window-function pattern powers core retention metrics and lets product teams measure feature engagement at the session level.-
Join
employeestodepartments, rank by salary within each department usingDENSE_RANK(), and filter for ranks ≤ 3. Ordering the final output by department ascending then salary descending meets reporting requirements. Mentioning how to break ties (e.g., by hire date) shows completeness. How many minutes (rounded down) did each plane spend in the air per calendar day?
Subtract
departure_tsfromarrival_ts, convert the interval to minutes withEXTRACT(EPOCH)/ 60, floor the result, and group byplane_idplus flight date. Handling overnight flights may require casting both timestamps into the destination date’s timezone. This calculation feeds fleet-utilization dashboards that optimize maintenance schedules.Find the 2nd-longest flight (by duration) for every unordered city pair.
Normalize
(origin, destination)into an alphabetical pair, compute flight minutes, rank flights within each pair by duration DESC, and grab the row with rank = 2. Skip pairs with fewer than two flights. Correctly treating (LA, NY) and (NY, LA) as identical shows mastery of symmetric grouping.Calculate the first-touch attribution channel for each user who converted.
Join sessions to users, filter
conversion = TRUE, and assignROW_NUMBER() OVER (PARTITION BY user_id ORDER BY session_ts)to pick the earliest converting session. Selecting itschannelcolumn labels the user’s first-touch source. Analysts rely on this query to allocate marketing spend effectively.Identify the top-five product pairs most frequently purchased together.
Self-join the transactions table to itself on the same
order_idwhereproduct_id1 < product_id2alphabetically to avoid duplicates. Count occurrences of each pair, order by count DESC, and limit to five. Scaling tips—such as pre-aggregating per order or leveraging HyperLogLog sketches—demonstrate readiness for billion-row commerce datasets.
Product-Sense & Metrics Questions
Product-sense and metrics questions evaluate how you translate data insights into actionable product decisions. You may be asked to choose a North Star metric for a new streaming feature or outline an A/B test to measure the impact of UI changes. Strong answers define success criteria clearly, justify metric selection with business context, and address both primary KPIs and guardrail metrics to ensure reliable conclusions.
-
Begin with price-elasticity analysis: run geo-priced A/B tests or exploit historical list-price changes to estimate demand curves and calculate own-price elasticity of subscriptions. Complement these experiments with conjoint-survey data to isolate willingness-to-pay relative to catalog size, ad-load, and device support. Segment elasticity by tenure and acquisition channel to see if price sensitivity differs for students vs. families or organic vs. paid traffic. Finally, triangulate findings with churn cohorts around price hikes to ensure conclusions hold over the entire customer lifecycle.
-
In a steady-state model LTV ≈ ARPU ÷ churn = $100 / 0.10 = $1 000. Using the observed tenure approach LTV = ARPU × avg tenure = $100 × 3.5 = $350. Highlight why the two methods diverge (3.5 months implies ~28 % effective churn), and stress aligning on a single definition, adding gross-margin adjustments, and discounting future cash flows when finance requires net-present value.
-
Start with Kaplan-Meier survival curves split by plan to visualize time-to-churn distribution; add log-rank tests for significance. Compute cohort-based retention, churn-hazard rates, and revenue-weighted LTV for each plan. A Cox proportional-hazards model lets you control for confounders like acquisition source or device mix. Heat-map voluntary-vs-involuntary churn reasons to surface actionable product levers.
-
UNION the
mobile_actionsandweb_actionstables into a user-level set labeled by platform, aggregate withCOUNT(DISTINCT platform)to classify each user, then apply conditional aggregation to total users in each bucket. Dividing by the grand total yields the requested percentages. Including aWITHclause for readability and casting decimals to two places prepares the output for exec decks. How would you measure the impact of launching fractional-share trading?
Define north-star metrics such as incremental funded-accounts, average trade size, and daily active traders who couldn’t meet whole-share minimums. Use a staggered rollout or wait-list natural experiment to run diff-in-diff on engagement and revenue-per-user. Track guardrails like order-failure rate or customer-support tickets to ensure feature quality. Finally segment uplift by portfolio size to confirm the product reaches its intended “small balance” audience.
How would you evaluate the success of social media platform TV?
Establish core adoption metrics: creator uploads per day, viewer reach, and median watch-time. Measure quality via completion-rate and repeat-viewers seven days later. Compare creator retention and revenue against short-form posts to assess cannibalization. Set guardrails on feed-time displacement to protect main-app engagement, and build a creator-level LTV model to prove ecosystem health.
-
Leverage natural experiments: difference-in-differences on message-reply rates between users whose contacts adopt the feature early vs. late. Monitor pre-/post- trends in daily messages sent and accepted connection requests while controlling for seasonality. Instrument feature exposure logs to run propensity-score matching that balances activity-level covariates. Triangulate quantitative lift with qualitative survey feedback to capture perceived responsiveness.
Behavioral & Culture-Fit Questions
Behavioral interviews probe your alignment with Netflix’s Freedom & Responsibility culture. Expect to discuss occasions when you drove decisions with incomplete data, handled candid feedback on your analyses, or partnered with cross-functional teams to deliver impactful dashboards. Structure your responses using the STAR method, highlighting situations where you took ownership, demonstrated customer focus, and iterated quickly based on learnings.
Describe a data project you worked on. What were some of the challenges you faced?
Choose an analytics project that mattered to end-users—e.g., building an algorithm-health dashboard or modeling churn drivers. Outline the business goal, the messy realities you uncovered (incomplete events, schema drift, conflicting stakeholder definitions), and the concrete steps you took to unblock progress: backfilling gaps, validating assumptions with small-scale tests, or negotiating a new logging spec. Finish with the impact in terms of decision quality or time saved, showing you can turn obstacles into durable improvements.
What are some effective ways to make data more accessible to non-technical people?
Emphasize layered communication: start with an “executive-summary” metric, then provide drill-downs for curious readers. Mention self-serve dashboards with human-readable KPI definitions, scheduled insights e-mails, and lightweight annotation features that explain spikes in plain language. Point to data-literacy sessions or office hours that you’ve run to boost adoption. Highlight how these tactics reduce ad-hoc requests and foster a culture where everyone speaks the same metric language.
What would your current manager say about you—both your strengths and areas for growth?
Anchor strengths in observable outcomes—e.g., “They’d cite my ability to ship clean SQL and Python pipelines quickly while maintaining rigorous documentation.” For developmental feedback, pick a genuine but non-fatal trait like “I can dig too deep before socializing early findings” and describe steps you’re taking (weekly preview memos, tighter sprint demos). This balanced answer signals self-awareness, coachability, and a growth mindset.
Talk about a time when you had trouble communicating with stakeholders. How did you overcome it?
Pick an episode where differing definitions or metric priorities created friction—perhaps marketing cared about “views” while product cared about “completed plays.” Explain how you held a metric-alignment workshop, translated jargon into business outcomes, and produced a one-pager that reconciled goals. Stress the outcome: faster sign-off on dashboards and fewer re-work cycles, proving you can bridge analytic depth with business clarity.
Why did you apply to our company, what are you looking for next, and why are you a good fit?
Craft a concise narrative that connects the company’s data scale and creative culture to your passion for turning large, real-time datasets into user-impactful insights. Map two or three of your signature skills—experimentation design, subscriber-lifecycle modeling, storytelling with data—to upcoming initiatives you’ve read about. Close with what you hope to learn (e.g., deeper personalization problems or global growth analytics), showing mutual benefit.
How do you prioritize multiple deadlines, and what systems keep you organized?
Describe a lightweight framework—impact × urgency matrix or OKR alignment—to slot tasks into must-do, time-allow, and delegate buckets. Mention tooling: Kanban boards for visibility, calendar time-blocks for focus work, and automated Slack reminders for recurring SLA checks. Highlight proactive comms: publishing weekly status notes so PMs can negotiate scope early, preventing last-minute surprises.
Tell me about a time you uncovered a data-quality issue after a dashboard was already live. How did you handle the situation?
Outline how you detected the anomaly (monitoring alert, stakeholder question), immediately flagged the risk, and implemented a “data unavailable” banner to prevent misinterpretation. Walk through your root-cause analysis—schema change, late ETL window, or incorrect join logic—and the permanent fix, such as adding unit tests or creating an automated checksum. Emphasize transparency and speed as keys to maintaining trust.
Describe how you balanced depth versus speed when stakeholders asked for a quick metric that required complex modeling.
Explain how you delivered an approximate answer using a defensible proxy or small sample, clearly labeling caveats, while scheduling a follow-up deep dive. Note how this dual-track approach satisfied immediate decision needs without sacrificing methodological rigor, demonstrating practical judgment in a fast-moving environment.
How to Prepare for a Data Analyst Role at Netflix
Landing a data analyst role at Netflix means demonstrating both technical excellence and cultural fit. Focus on honing your core skills while internalizing the company’s values to stand out in each interview stage.
Sharpen SQL & Python-Pandas
Netflix allocates roughly 60 % of the technical screening to SQL and data manipulation. Practice writing window-function queries, CTEs, and efficient joins on large datasets, then translate those same principles to Pandas workflows. Time yourself on real-world problems—this not only builds proficiency but also helps you articulate your approach under pressure.
Practice Metric Design & A/B Testing
About 25 % of your evaluation will center on defining and analyzing metrics. Prepare by sketching North-Star and guardrail metrics for hypothetical features, then design basic A/B tests to measure impact. Explain how you’d interpret results, handle false positives, and adjust for significance and power—showing you can turn data into product insights.
Study Netflix Culture Memo
Familiarize yourself with the famous culture memo and weave its principles into your stories. Whether discussing autonomy or context over control, reference key phrases to demonstrate that you understand why “Freedom & Responsibility” underpins decision-making and how you’ll uphold these values as part of the team.
Think Out Loud & Iterate
Interviewers value hypothesis-driven reasoning. As you solve problems, verbalize your assumptions, initial ideas, and the trade-offs you’re weighing. Show how you’d refine a query or analysis based on emerging insights—this transparency highlights your collaborative mindset and aligns with Netflix’s iterative ethos.
Mock Interviews & Feedback
Run through at least two full SQL/problem-solving sessions and one product-sense case with peers. Be sure to dissect the Netflix data analyst job description beforehand to tailor your examples to the role’s priorities. After each mock, collect detailed feedback on your technical accuracy, communication clarity, and cultural alignment to fine-tune your performance. Check out Interview Query’s mock interview simulation.
FAQs
What Is the Average Salary for a Netflix Data Analyst?
Average Base Salary
Average Total Compensation
When researching Netflix data analyst salary, you’ll find competitive cash and equity packages designed to reward high impact. Candidates often compare base pay with total equity grants to understand the full value—known in the industry as the data analyst Netflix salary. Senior roles may also benchmark against peer positions; discussing Netflix data analyst compensation can help you negotiate a package that reflects both your experience and the company’s top-of-market standards.
Are There Job Postings for Netflix Data Analyst Roles on Interview Query?
Yes! Check out our dedicated jobs board to see current openings, detailed role descriptions, and insider interview tips tailored to Netflix data analyst positions. See the latest openings and insider tips to jumpstart your application process.
Conclusion
Mastering the Netflix data analyst interview structure—from SQL drills and product-sense cases to behavioral narratives—is the most direct path to landing an offer. For deeper, role-specific prep, check out our Netflix Analytics Engineer Interview Guide and Netflix Data Scientist Interview Guide, and consider sharpening your technique through our mock interviews with experienced coaches.
To boost your SQL prowess—the backbone of every data analyst role—dive into our SQL Learning Path for targeted exercises and real-world scenarios. You’re not alone on this journey: just like Dania Crivelli did, you can refine your skills, practice strategically, and emerge ready to impress at every stage of the Netflix interview process.
Netflix Interview Questions
| Question | Topic | Difficulty | ||||||||||||||||||||||||||||
|---|---|---|---|---|---|---|---|---|---|---|---|---|---|---|---|---|---|---|---|---|---|---|---|---|---|---|---|---|---|---|
SQL | Hard | |||||||||||||||||||||||||||||
Let’s say we have two tables, We are trying to find paired products that are often purchased together by the same user, such as wine and bottle openers, chips and beer, etc.. Write a query to find the top five paired products and their names. Notes:
For the purposes of satisfying the test case, p2 should be the item that comes first in the alphabet.
The Example: Input:
Output:
| ||||||||||||||||||||||||||||||
SQL | Medium | |||||||||||||||||||||||||||||
SQL | Medium | |||||||||||||||||||||||||||||
SQL | Easy | |
Machine Learning | Medium | |
Statistics | Medium | |
SQL | Hard | |
Machine Learning | Medium | |
Python | Easy | |
Deep Learning | Hard | |
SQL | Medium | |
Statistics | Easy | |
Machine Learning | Hard |
Discussion & Interview Experiences