
Uber Business Intelligence Interview Guide (2026): Funnel Cases, SQL & Prep


Introduction
Demand for business intelligence roles is expected to increase by 20% through 2028, according to a recent CompTIA analysis. This demand is especially evident at global companies operating real-time marketplaces, such as Uber. Since Uber’s core product areas have expanded from Mobility to also include Delivery and Uber for Business, they share a common challenge of balancing multiple user needs across a complex funnel. As a result, business intelligence analysts are expected to reason end-to-end: diagnosing funnel drop-offs, defining clear metrics, and translating data into actionable recommendations for riders, drivers, couriers, merchants, and partners.
These expectations directly shape the Uber business intelligence interview process. Rather than testing abstract analytics knowledge, interviews focus on how you think about funnels, own metrics, evaluate trade-offs, and make decisions based on stakeholder perspectives. Through this guide, you’ll learn what Uber evaluates at each interview stage, the types of business intelligence questions and cases you’re likely to face, and how to prepare effectively with Interview Query.
Uber Business Intelligence Interview Process
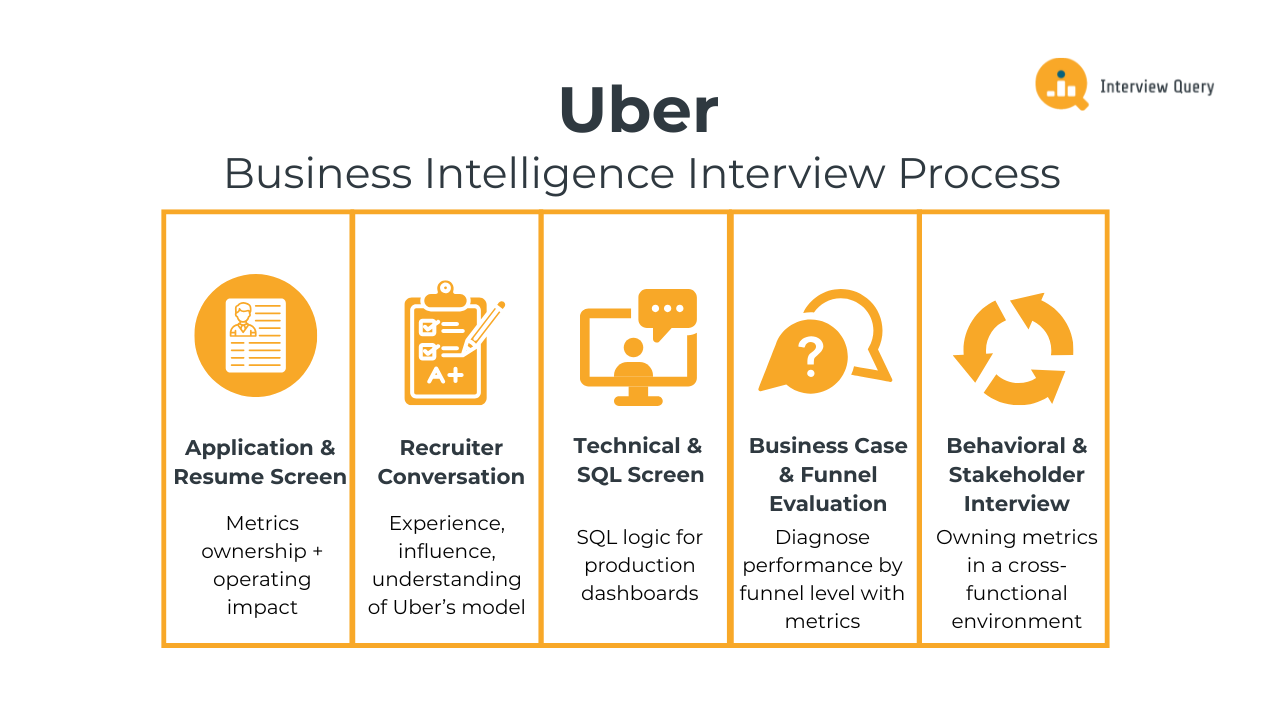
Uber’s business intelligence interview process is structured and intentionally business-heavy. Most candidates progress through four to five rounds, although the exact sequence can vary depending on seniority and team, such as Mobility, Eats, Freight, or Uber for Business. What doesn’t change is how Uber evaluates talent: your ability to frame business problems, define and own metrics, and translate data into scalable city- and marketplace-level decisions. Below is a breakdown of what to expect at each stage, and how to prepare strategically.
Application and resume screen
The resume screen is the first filter in the Uber analytics hiring process, and it is highly impact-driven. Recruiters and hiring managers look for clear evidence that you have owned metrics tied to real business outcomes. Tool lists and generic dashboards matter far less than examples showing how your analysis influenced product, operations, or strategy decisions.
A strong business intelligence resume clearly links analysis to outcomes: launches influenced, experiments shipped, cost savings realized, or performance issues resolved. Uber values candidates who can show judgment and business intuition alongside technical execution.
Tip: Explicitly name the cadence and audience of your metrics (e.g., “weekly ops review,” “VP-level readout,” “city-level performance tracking”) to signal BI ownership. Reading Interview Query’s company-specific Uber interview guide can help you rewrite analytics bullets to emphasize the metric ownership and operating impact Uber screens for.
Recruiter conversation
This conversation validates that your experience aligns with Uber’s definition of business intelligence, not exploratory data science or purely stakeholder-requested analysis.
Recruiters listen for clarity around:
- The types of metrics you owned on an ongoing basis
- How often your work has informed decisions (daily, weekly, quarterly)
- Whether you have supported execution teams, leadership, or both
- Your understanding of Uber’s marketplace model
No SQL is tested here, but BI candidates who describe themselves primarily as “answering questions” or “running analyses on request” often struggle here.
Tip: Frame your experience around monitoring, diagnosing, and escalating business performance. Recruiters want to hear how you kept the business informed beyond just responding to tickets.
Technical and SQL screen
The SQL screen evaluates whether you can support ongoing business monitoring. Queries often mirror the logic behind production dashboards: funnel health, retention tracking, supply-demand balance, or SLA performance. Correct syntax matters, but interviewers care more about how you frame the problem and explain the logic behind your approach.
This means taking a loosely defined question (for example, “How is driver supply doing?”) and turning it into a well-scoped metric with a clear definition, time window, and population. You’re also expected to surface edge cases, explain assumptions, and describe how you would interpret the output. Follow-up questions typically probe how your results would inform a product or operational decision, not just whether the query runs.
Tip: Treat every query as if it feeds a recurring dashboard that will be reviewed weekly by the products or operations team. This mindset forces you to define metrics precisely and choose sensible filters; Interview Query’s structured SQL Interview learning path then reinforces this by giving you end-to-end problems to practice on.
Business case and funnel evaluation interview
This is the core of the Uber business intelligence interview and the interview stage many candidates underestimate, as it looks like a standard analytics case but is actually testing executive-level business judgment.
A canonical example involves diagnosing a drop in Uber Eats orders by evaluating performance at each funnel stage (e.g., app open → menu view → checkout → completed order).
In a typical Uber Eats or Mobility case, strong BI candidates:
- Define funnel stages that map to operational ownership
- Select metrics that are stable, comparable, and reviewable over time
- Identify where performance broke relative to baseline or trend
- Propose follow-ups that deepen monitoring, not just one-off cuts
The goal is not just to diagnose business performance, but to design a metric framework that leadership could reuse in weekly or monthly business reviews, such as a North Star metric focused on the top-line outcome or a funnel decomposition that maps cleanly from demand entry to fulfillment. Interviewers want to see that you can lock definitions, establish baselines, and create a structure that makes future diagnosis faster and more reliable.
Tip: Anchoring your analysis around “what would go on the weekly business review slide” urges you to explain what metrics would be presented, reviewed, and used for decision-making. Interview Query’s metric-focused business case challenges help with structuring cases around repeatable performance reviews rather than ad hoc analysis.
Behavioral and stakeholder interview
The behavioral round evaluates how you operate as an owner of core business metrics, not just an analyst producing one-off insights. At Uber, BI professionals are responsible for defining, maintaining, and defending metrics that leadership uses to evaluate performance, such as completed trips, order conversion rate, courier utilization, ETA accuracy, or cancellation rate. This interview tests whether you can protect the integrity of those metrics while working across product, engineering, and operations teams.
Strong candidates clearly explain:
- What metric they owned (e.g., order completion rate, driver supply hours, on-time delivery)
- Why the metric mattered to the business and who used it
- What disagreement or risk existed (misinterpretation, metric gaming, conflicting goals)
- How they used data to resolve it, including assumptions, tradeoffs, and final decisions
- What changed afterward, such as a new definition, dashboard, or review process
Interviewers are not looking for “I aligned everyone” stories. Rather, they want to see how you used data, definitions, and tradeoff reasoning to drive alignment when incentives were misaligned.
Tip: Make sure your stories go beyond delivering insights by choosing examples where you defended metric integrity or changed how performance was measured, such as reframing a goal to better support marketplace health.
Overall, the strongest candidates prepare by thinking in funnels, recurring reviews, tradeoffs, and decisions under uncertainty. Choose to simulate the real experience ahead of time through Interview Query’s mock interviews, where you can replicate Uber-style SQL screens, funnel cases, and stakeholder discussions, with targeted feedback on metric framing, clarity, and decision-making.
Challenge
Check your skills...
How prepared are you for working as a Business Intelligence at Uber?
What Questions Are Asked in an Uber Business Intelligence Interview?
Uber business intelligence interview questions are grounded in real operational problems from Uber Eats, Mobility, and city-level marketplaces. These questions focus on how candidates define and analyze core marketplace metrics, such as trip request conversion, driver supply utilization, and cancellation and completion rates. Beyond identifying these measurable KPIs, strong candidates also demonstrate the ability to explain tradeoffs between leading and lagging indicators and how insights would inform product, pricing, or operational decisions. Below are the most common categories of Uber business intelligence interview questions, along with examples that reflect how they are tested in practice.
Read more: Business Intelligence Interview Questions
SQL and metrics interview questions
SQL and metrics questions at Uber test whether you can support business decisions with clean, logical analysis. These questions often embed SQL requirements within a broader business context, forcing you to define metrics carefully and explain what the results mean.
Write a query to calculate Uber Eats conversion by funnel stage.
This question evaluates your ability to define clean funnel metrics and translate product flows into SQL. A strong approach starts by explicitly ordering funnel stages (e.g., app open → menu view → checkout → order placed) and calculating stage-to-stage conversion using consistent denominators. You should also consider time windows, duplicate events, and how these metrics would be monitored week over week.
Tip: Call out which funnel cuts would be reviewed in a weekly Eats performance meeting and which ones would only be investigated during anomalies, showing that you understand how BI metrics live beyond the query.
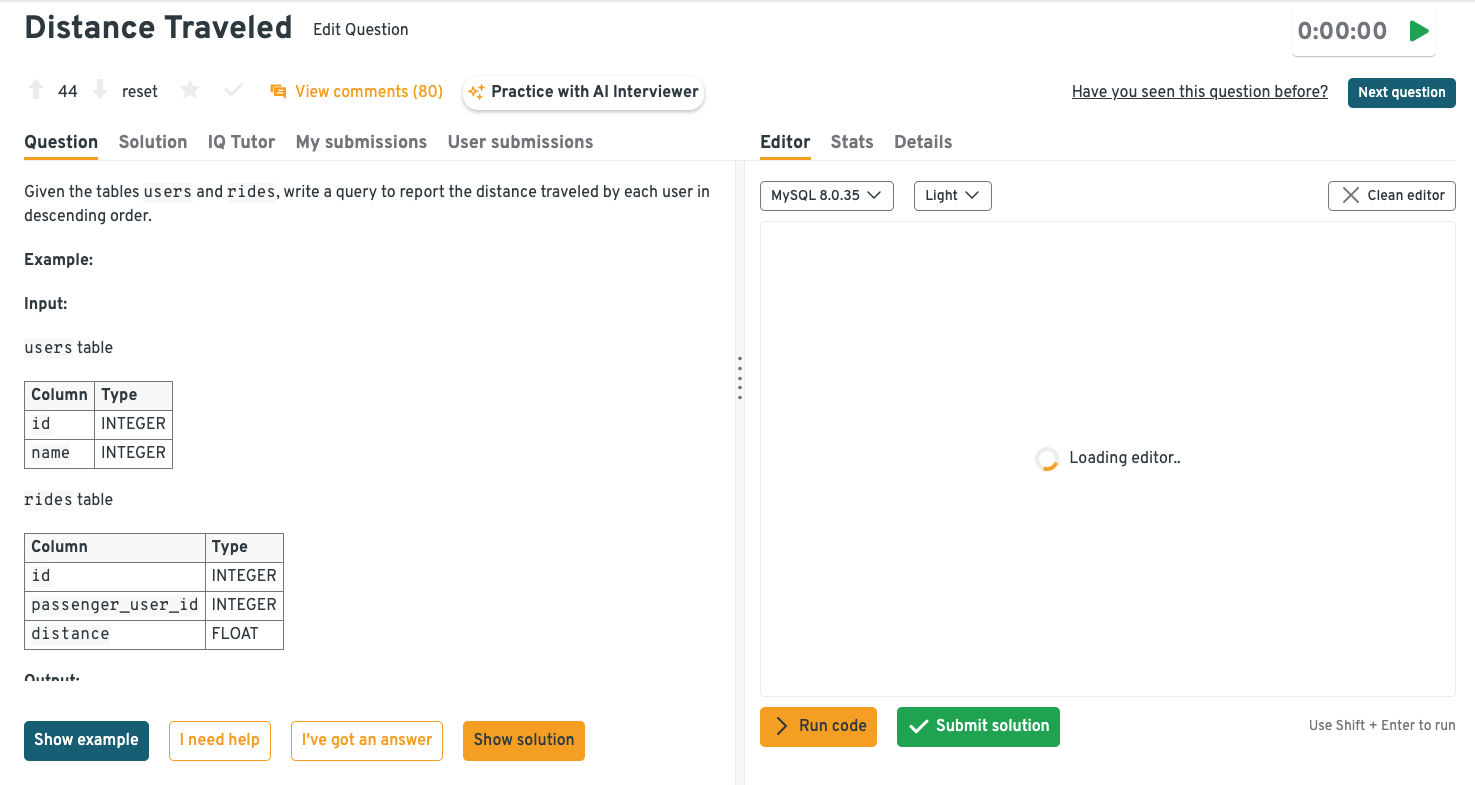
Rank Uber users by total distance traveled across all completed rides.
This prompt tests aggregation, filtering, and ranking logic commonly used in BI dashboards. The solution involves summing distance across completed rides per user, excluding canceled or in-progress trips, and then applying a window function or ordering to rank users. Clear handling of ties and null values signals production-ready thinking.
Tip: Mention how extreme values or power users might distort downstream metrics and whether you’d cap, segment, or monitor them separately to reflect real-world marketplace reporting instincts.
Practice this and other Uber-style SQL and metrics questions on the Interview Query dashboard, where you can write queries in the built-in editor and check your answers step-by-step with detailed solutions walkthroughs.
Select a driver using a weighted random algorithm to simulate Uber’s driver–rider matching logic.
Here, interviewers assess your understanding of probabilistic selection and advanced SQL patterns. The approach typically relies on cumulative weights and a random value to probabilistically select a driver, ensuring higher-weighted drivers are chosen more often. Explaining why this mirrors real matching behavior is just as important as writing the query.
Tip: To signal marketplace-level thinking, tie the weighting logic back to a business lever (reliability, ETA, fairness) and briefly note how changes to the distribution would affect supply health.
How would you measure courier reliability over time?
This question evaluates metric design, temporal analysis, and operational judgment. A solid answer defines reliability through repeatable signals such as on-time delivery rate, cancellation frequency, or acceptance consistency, tracked at a courier level over rolling time windows. Segmenting by tenure or city can help distinguish systemic issues from individual behavior.
Tip: Emphasize stability over sensitivity by referencing rolling windows or minimum activity thresholds. Uber BI teams care deeply about metrics that don’t whipsaw week to week.
Write a query to identify cities with declining Eats retention.
This tests cohort analysis, trend comparison, and business interpretation. The solution usually involves defining a retention cohort (such as users active in their first week), calculating return rates over subsequent periods, and comparing trends by city. Strong candidates explain how they would smooth noise and confirm the decline is meaningful before escalating it to stakeholders.
Tip: Mention how you’d package the output for action, such as flagging cities for ops follow-up or pairing the metric with supply or pricing context, to show you think beyond detection and toward intervention.
Ready to strengthen your SQL skills? Explore Interview Query’s SQL learning path to practice real-world queries and master techniques for writing clean, production-ready SQL, helping you meet Uber’s standards for BI roles.
Funnel and product analytics interview questions
Uber places heavy emphasis on funnel and product analytics questions because many BI roles support core user and marketplace flows. For Uber Eats–aligned teams, this often means a stronger focus on product analytics since changes in the app experience affect conversion, fulfillment, and retention. Candidates are commonly asked to understand marketplace dynamics and analyze end-to-end funnels, such as the Eats order fulfillment funnel that moves from order placement to delivery completion. While SQL is often used to pull metrics, interviewers care far more about how you structure the funnel, define success at each stage, and connect metrics to business levers.
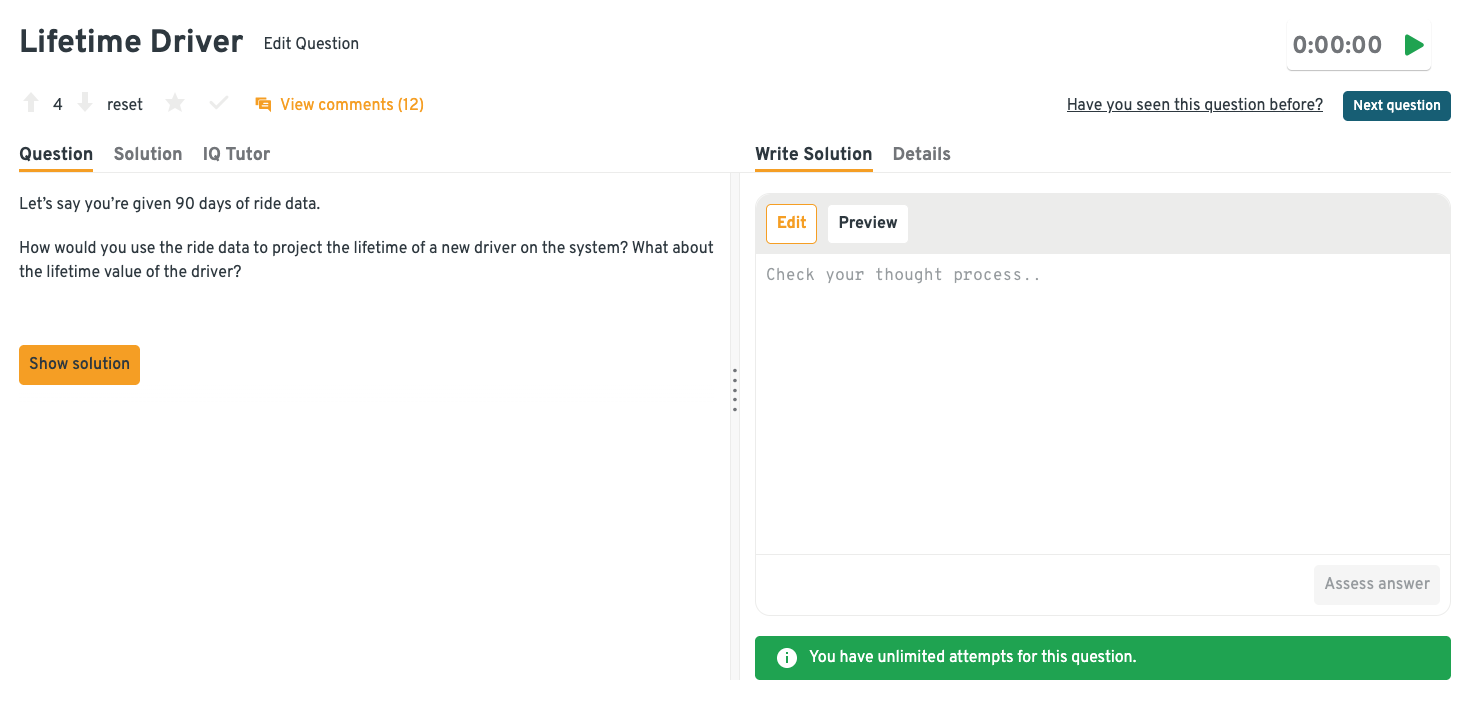
Use early ride activity to project driver lifetime and lifetime value on the Uber platform.
Here, interviewers assess your ability to turn limited data into forward-looking estimates. The solution typically segments drivers by early engagement signals, models churn probabilities over time, and combines expected lifetime with unit economics like earnings and incentives. Strong answers acknowledge uncertainty and explain how projections would be validated and recalibrated.
Tip: Mention how these projections would inform real decisions like incentive targeting or onboarding investment. BI candidates stand out when they tie models directly to operating levers.
Try answering this and other Uber-style analytics questions on the Interview Query dashboard. Use the IQ Tutor for guided hints, or browse the comments section to compare approaches and learn from detailed solutions.
If Eats conversion drops at funnel level 4, where do you investigate first?
This prompt evaluates diagnostic thinking and funnel intuition. An effective response isolates what level 4 represents operationally, then checks adjacent stages to rule out tracking or denominator shifts. From there, investigation should branch into supply availability, pricing, or user friction specific to that step.
Tip: Reference how quickly this metric would be escalated and who would own the follow-up, as naming the decision path shows familiarity with Uber’s fast-paced operating model.
How would you compare funnel performance between Uber Eats and Rides?
This question measures your ability to align metrics across different product surfaces. A solid approach normalizes funnels by mapping equivalent stages, such as intent, matching, and completion, before comparing conversion and drop-off rates. Differences should be interpreted in light of user context, frequency, and time sensitivity.
Tip: Explicitly state which comparisons are directional versus decision-driving. BI leaders care about avoiding false equivalence across fundamentally different marketplaces.
How do you decide which funnel metric to prioritize when multiple stages decline?
Interviewers use this to assess prioritization and business judgment under ambiguity. A strong answer weighs impact by combining volume, elasticity, and downstream effects rather than treating all declines equally. Candidates should also explain how they’d validate whether the declines share a common root cause or represent separate issues.
Tip: Prepare a repeatable prioritization heuristic you can articulate quickly (for example, impact × reversibility × confidence). Also tie prioritization back to the next business review or launch milestone to ground decisions in timing and accountability.
Define a metric framework to evaluate whether Uber Eats creates net positive value for Uber.
This question tests strategic metric design and business modeling skills. A strong approach starts by defining contribution margin at the order level, then rolling it up to account for fixed costs, incentives, and shared infrastructure across Uber’s ecosystem. The framework should also consider long-term effects such as cross-platform user retention and frequency uplift.
Tip: Bring up which metrics would be reviewed in a quarterly business review versus monitored weekly. This clear separation between strategic and operating metrics signals strong BI judgment.
Watch Next: Uber Eats Case Walkthrough
This video complements the written guide by walking through an Uber Eats funnel case step-by-step, showing how to frame metrics and reason about user drop-offs.
In the video, data scientists Jay Feng and Raveena Mathur define funnel stages before diving into metrics. They also demonstrate how to isolate performance issues while communicating findings in an interview-ready way. Watch the full video to see BI problem-solving in action and hear how to structure your answers clearly.
Behavioral interview questions
Behavioral questions at Uber focus on stakeholder management, decision-making under ambiguity, and ownership. Interviewers want evidence that you can influence outcomes using data, even when authority is limited.
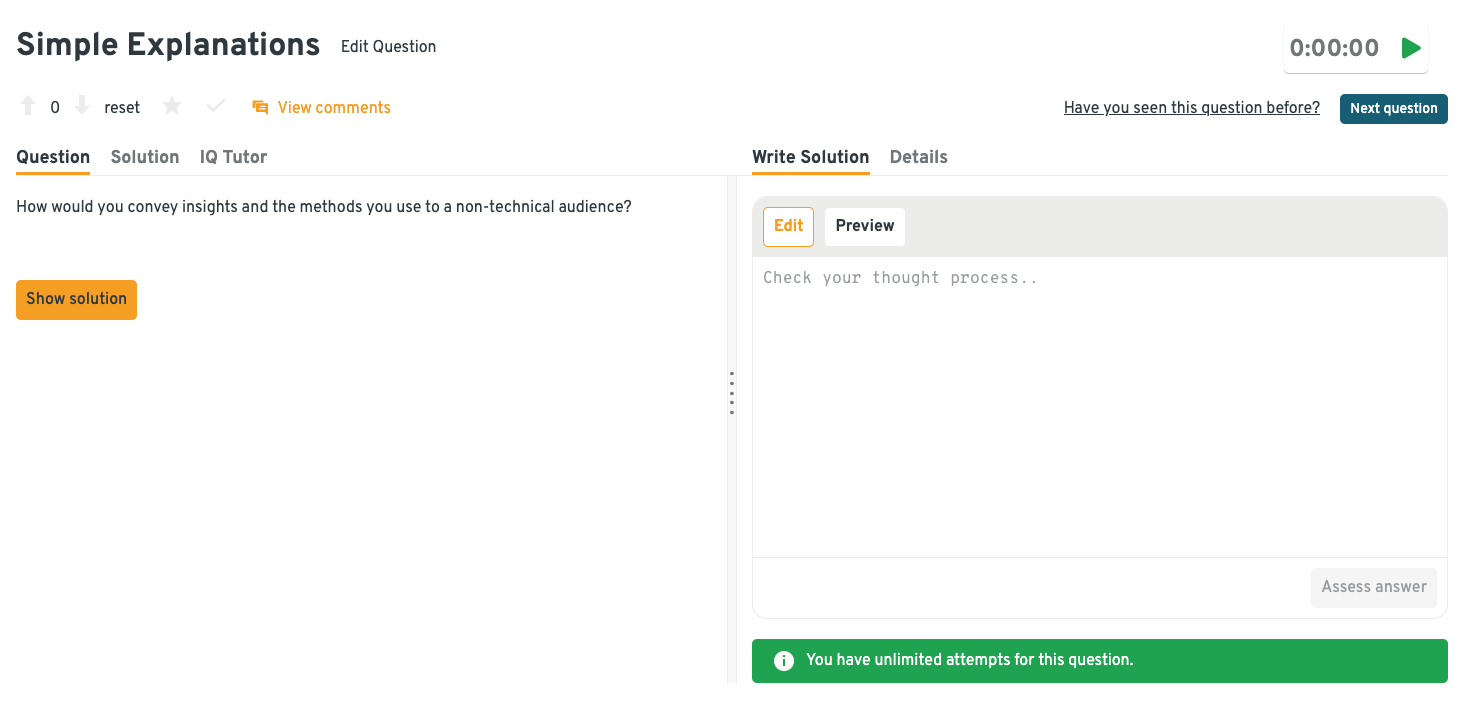
How would you convey data insights and your analytical approach to a non-technical audience?
Uber BI partners with ops, product, and business teams who don’t think in SQL or dashboards, so this question tests your ability to translate analysis into decisions. Remember to tie insights to business metrics (e.g., conversion, ETA, cost, or revenue) and show how communication led to action.
Sample answer: “I focus on framing insights around the business question first, then use one or two clear metrics to support the takeaway. For example, I presented a rider drop-off analysis by highlighting that a 30-second increase in pickup ETA reduced conversion by 4%, rather than walking through the model details. I used a simple chart and a concrete recommendation to cap ETA variance in high-density zones. That change helped improve completed trips by 2% week over week.”
Head to the Interview Query dashboard to solve additional behavioral questions and get feedback using tools like the IQ Tutor and comments section. These are helpful for refining not just technical answers, but also how you structure, quantify, and communicate impact in behavioral responses.
Describe a time when you had trouble communicating with stakeholders and how you resolved it.
This evaluates how you handle misalignment across fast-moving, cross-functional teams at Uber. Strong answers show how you adapted your communication style and quantify outcomes such as faster decision-making, reduced rework, or improved KPI movement.
Sample answer: “I once worked with a regional ops team that felt my analysis wasn’t actionable enough. I followed up by aligning on their success metrics and reframed the results around driver supply hours and cancellation rate. After adjusting the dashboard and recommendations, the team implemented changes that reduced cancellations by 6% in two weeks. The improved communication also cut follow-up questions by more than half.”
Describe a time you balanced speed versus accuracy in your analysis.
Uber operates in real time, so BI teams often need to deliver “good enough” insights quickly without sacrificing business trust. Candidates should explain the trade-off, justify their decision, and quantify how speed enabled timely action or prevented negative impact.
Sample answer: “During a surge pricing experiment, leadership needed results within 24 hours to decide on rollout. I used a simplified aggregation approach instead of a full causal model, clearly noting assumptions and confidence levels. The analysis showed a 3% revenue lift with minimal rider churn, which enabled a same-week expansion. A deeper analysis later confirmed the initial direction with similar results.”
Describe a time when your analysis challenged a popular assumption or business intuition.
This tests whether you can use data to push back on intuition and influence better decisions. High-quality answers show how data changed minds and quantify the upside of correcting the assumption.
Sample answer: “A common belief was that longer driver online hours always led to better rider experience. My analysis showed diminishing returns beyond a certain supply threshold, with no improvement in ETA but higher incentive costs. I presented that reallocating incentives could save 8% in weekly spend without hurting fulfillment. The team adjusted the incentive structure and saw immediate cost efficiency gains.”
Tell me about a time you had to influence a decision without direct authority.
BI roles at Uber rely heavily on influence rather than ownership, so this question evaluates persuasion through data and storytelling. Candidates should quantify the business result and show how alignment was built across teams.
Sample answer: “I partnered with product and ops teams to change a marketplace setting I didn’t own. I built a clear analysis showing a 5% improvement in trip completion if we adjusted batching logic during peak hours. By walking stakeholders through the data and trade-offs, I got buy-in for a pilot. The change rolled out globally and increased completed trips by ~1.5%.”
These Uber Business Intelligence sample questions reflect what the interview is really testing across each round: your ability to turn data into business impact at scale while communicating clearly and challenging assumptions. To go deeper with your interview prep, explore Interview Query’s question bank for hands-on SQL drills, analytics case prompts, and behavioral examples designed for BI and data roles.
How to Prepare for an Uber Business Intelligence Interview
Effective prep for the Uber business intelligence interview centers on how well you can reason through funnel-level problems under ambiguity. Unlike interviews that reward memorized formulas or polished dashboards, Uber evaluates whether you can structure unclear questions, define actionable metrics, and communicate insights that influence decisions in live marketplace. Your preparation should reflect that reality.
Practice funnel breakdowns aloud: Take common Uber scenarios, such as a drop in Uber Eats orders or slower courier availability, and expect a structured funnel-level diagnosis. Practice clearly defining each stage of a funnel (for example, app open → browse → add to cart → checkout → order completed) and explaining what success looks like at each step. You should be able to explain why a metric belongs at a given stage and how it connects to a product or operational lever, such as pricing, availability, or UI changes.
Tip: Don’t just list stages; explain why each boundary matters and what business action could move it. Interview Query’s real-world business cases and challenges are especially useful here for stress-testing your logic under follow-ups.
Build metric trees for recurring marketplace problems: Uber expects BI candidates to decompose high-level outcomes (conversion, fulfillment, retention) into metrics that teams can actually influence. Practice decomposing outcomes into component drivers across the marketplace, such as:
- Demand-side inputs (user conversion, frequency, price sensitivity)
- Supply-side inputs (driver or courier availability, utilization), and
- Marketplace factors (ETA, batching, cancellations, incentives).
Interviewers expect you to reason through which metrics are controllable, who owns them, and which ones to investigate first.
Tip: If you can’t name an owner or lever for a metric, it’s probably too abstract. Use Interview Query’s Product Metrics learning path to train yourself in proposing metric trees before jumping to solutions.
Review core marketplace dynamics: Understand how supply, demand, and pricing interact across cities and times of day, and how those dynamics differ between Eats and Rides. Avoid applying static product analytics logic, and instead account for real-time constraints like driver shortages, peak demand, or weather effects. Be prepared to discuss how key metrics behave differently during peak vs. off-peak hours, in dense vs. sparse cities, or under supply constraints.
Tip: When practicing cases, explicitly ask yourself how marketplace conditions might change your interpretation of the data. Uber’s engineering blog provides useful context on how its systems manage supply-demand balance.
Practice making recommendations with imperfect data: Many Uber BI cases end with “What would you do next?” and not a clean answer. You are expected to make a reasonable recommendation even when the data is imperfect, directional, or limited. Strong candidates clearly state assumptions, acknowledge uncertainty, and propose a next step, such as a follow-up analysis, experiment, or metric to monitor.
Tip: Explicitly communicate your confidence level and what additional data would change your decision. This signals decision readiness, not just analytical caution.
Use mock case interviews that simulate ambiguity and pushback: Uber interviewers often challenge assumptions or introduce new information mid-case to see how candidates adapt. Practice staying structured when your initial hypothesis is questioned or when metrics conflict.
Tip: Focus less on speed and more on clarity, signposting, and decision rationale. Interview Query’s questions dashboard includes guided solutions and discussion threads that help benchmark whether your reasoning would stand up in a real Uber interview.
If you want targeted feedback on your case structuring, metrics framing, and communication under pressure, Interview Query’s 1-on-1 coaching can help you practice with industry experts and refine your approach for real Uber-style scenarios.
Role Overview and Culture at Uber
The business intelligence role at Uber is built around decision ownership, not passive reporting. BI professionals sit at the intersection of product, operations, and strategy, owning critical north-star metrics or outcomes, such as completed trips or orders, gross bookings, and user retentions, and funnel metrics that start from app open and end at order or trip completion. Across Mobility and Uber Eats, their work directly informs product strategy, marketplace operations, and city-level execution.
On a day-to-day basis, Uber BI teams turn complex, real-time marketplace behavior into insights that leaders can act on. Analysts define what “success” means for key initiatives, pressure-test assumptions, and continuously refine metrics as the business evolves.
Typical responsibilities include:
- Owning core funnels and metrics, such as Eats acquisition-to-first-order or rider request-to-trip completion
- Monitoring marketplace health by analyzing rider demand, courier and driver supply, ETAs, and cancellation rates
- Partnering cross-functionally with product managers, ops leaders, and regional teams
- Driving executive decision-making on investments, incentives, or new initiatives by creating concise analyses and dashboards
- Scaling insights across regions by adapting analyses to markets with varying local dynamics, regulations, and supply conditions
Culturally, Uber operates one of the most complex two-sided marketplaces in the world. Decisions often need to be made in real time, with incomplete data and competing priorities across users, couriers, and merchants.
The role also offers broad exposure across Uber’s ecosystem, including Rides, Eats, Grocery, and Ads. Many BI professionals build careers that span product analytics, strategy, and operations, making this role especially appealing for candidates who want to stay deeply analytical while shaping business direction.
Curious how this role compares? Check out Interview Query’s Uber data analyst and Uber business analyst guides to understand how responsibilities, expectations, and career paths differ across analytics roles.
Average Uber Business Intelligence Salary
Uber business intelligence roles are compensated at the higher end of the analytics market, reflecting how closely BI partners with product, operations, and leadership on high-stakes marketplace decisions. According to data sources like Levels.fyi, total compensation scales not just with tenure, but with scope. In other words, owning metrics that influence pricing, supply, or growth often translates directly into higher equity grants. While base pay is strong at every level, long-term upside increasingly comes from stock as responsibility and business impact grow.
Compensation by level
| Level | Total / Year | Base / Year | Stock / Year | Bonus / Year |
|---|---|---|---|---|
| Business Intelligence Analyst | ~$155K | ~$120K | ~$25K | ~$10K |
| Senior Business Intelligence Analyst | ~$185K | ~$140K | ~$35K | ~$10K |
| Staff Business Intelligence Analyst | ~$215K | ~$155K | ~$45K | ~$15K |
Compensation typically rises meaningfully after equity vesting begins in year two, especially at senior and staff levels.
Average Base Salary
Regional salary comparison
| Region | Salary range | Notes |
|---|---|---|
| United States (Bay Area) | $170K–$220K | Highest compensation driven by scope and equity |
| United States (Other major metros) | $145K–$195K | Slightly lower equity component |
| Europe | $110K–$155K | Lower base, limited equity in some regions |
| Asia-Pacific | $95K–$145K | Wide variation by country and cost of labor |
Overall, Uber tends to reward BI professionals who own high-impact metrics, such as conversion, fulfillment, or unit economics. Compensation reflects not just analytical skill, but the ability to influence decisions at scale.
Want to benchmark an offer or plan your next level-up? Explore Interview Query’s salary guides to compare Uber BI pay against similar roles and prepare for compensation conversations with real market data.
FAQs
How difficult is it to crack Uber business intelligence interviews?
The Uber BI interview is challenging because of its ambiguity, not because of obscure technical questions. Candidates who struggle often jump to solutions too quickly, skip clear funnel definitions, or treat metrics as descriptive rather than decision-driving. However, the interview is very learnable with the right preparation. By practicing how to break down funnels, define north-star and supporting metrics, and communicate tradeoffs clearly, candidates can show interviewers that they are ready to operate effectively and demonstrate structured thinking in Uber’s fast-moving marketplace.
What is the difference between business intelligence and BizOps at Uber?
Business intelligence and business operations roles often collaborate closely at Uber, but their core responsibilities differ. Business intelligence professionals focus on defining metrics, diagnosing performance, and providing analytical clarity across funnels and marketplaces. BizOps roles typically emphasize strategy execution, program management, and operational problem-solving. In interviews, BI candidates are evaluated more heavily on metric design and analytical reasoning, while BizOps candidates face broader strategic scenarios.
Are Uber Eats and Uber Rides cases different in interviews?
Yes. While both businesses share marketplace principles, Uber Eats cases often emphasize funnel analysis, conversion, and supply reliability across restaurants and couriers. Rides cases tend to focus more on real-time supply-demand balance, pricing, and geographic coverage. Interviewers expect you to recognize these structural differences rather than applying identical metrics to both.
How deep does SQL testing go in the Uber BI interview?
SQL expectations are solidly intermediate. You should be comfortable with joins, aggregations, window functions, and cohort analysis. However, Uber does not reward overly complex queries. Interviewers care more about whether you define the right metrics and explain how results would drive decisions than about syntactic tricks.
Are Uber business intelligence roles city-level or global?
Both exist. Some BI roles support city or regional teams, focusing on localized marketplace dynamics. Others operate at a global or product level, defining metrics used across regions. Interview questions often probe whether you understand how metric definitions and targets should change between city-level and global contexts.
Start Your Uber Business Intelligence Journey with Interview Query
Overall, to succeed in an Uber business intelligence interview, you need to think in funnels, reason through marketplace tradeoffs, and communicate insights that drive decisions across Mobility and Uber Eats.
Interview Query helps you prepare with resources built specifically for analytics and business intelligence roles. You can practice with a curated question bank covering SQL, product analytics, and behavioral interviews, follow the Product Metrics Interview learning path to strengthen funnel reasoning, and simulate the Uber environment through mock interviews with peer feedback.
If you want to become an Uber business intelligence, structured preparation makes the difference. Start building confidence, clarity, and consistency with Interview Query today.
Discussion & Interview Experiences