
Tiger Analytics Interview Questions & Process (2025 Guide)

Introduction
Tiger Analytics is a data-centric consulting firm that turns complex analytics and AI solutions into tangible business impact for Fortune 500 clients. If you’ve ever wondered about the Tiger analytics interview questions or the Tiger analytics interview process, you’re not alone—candidates seek clarity on assessment style, technical rigor, and culture fit. This guide provides an end-to-end overview and links to deep dives for each role so you can focus your preparation where it matters most.
Why Work at Tiger Analytics?
Cutting-Edge AI & ML Projects
You’ll partner with global enterprises to deploy models into production within weeks, from customer-churn prediction to real-time pricing. With a rapid-deployment culture, you’ll see your work drive outcomes almost immediately, leveraging the latest in machine learning and AI research.
Rapid Career Growth in Data Roles
Tiger Analytics’ flat hierarchy empowers you to take ownership early—whether you’re crafting your first dashboard or leading a cross-functional proof-of-concept. High performers move into senior analyst or data scientist tracks quickly, with visible impact and competitive compensation at every level.
Flexible, Distributed Teams
Work alongside US, Europe, and India-based colleagues in a hybrid model that balances autonomy with collaboration. With major hubs in Chennai, Bangalore, and Hyderabad, you’ll enjoy global mobility and cross-cultural learning opportunities.
What’s Tiger Analytics’ Interview Process Like?
The Tiger Analytics interview process typically unfolds over 2–4 weeks, though exact steps can vary by role. You’ll start with an online assessment, move through one or more technical rounds, tackle a case-study or project deep dive, and finish with behavioral interviews that explore culture fit and values.
Stage 1: Online Assessment (Hackerearth)
Your first hurdle is a 30–60 minute quiz combining multiple-choice questions with coding challenges. Expect to see “tiger analytics Hackerearth test questions” focused on Python, SQL, or basic statistics—designed to screen fundamental skills quickly.
Stage 2: Technical Round – Python / SQL
Next, you’ll face a live-coding session or take-home exercise. Depth varies by role: data engineers might optimize ETL pipelines, while data scientists build feature-engineering scripts. Common themes include Tiger Analytics python coding questions” and Tiger Analytics SQL interview questions.
Stage 3: Case Study or Project Deep Dive
You’ll be given a real-world, data-driven scenario to prepare over 48 hours—often mirroring client engagements. Be ready to present your analysis, methodology, and business recommendations in a concise deck or whiteboard session.
Stage 4: Behavioral & Culture Fit
In the final panel, hiring managers and HR explore your alignment with Tiger Analytics’ values: client obsession, rapid experimentation, and collaboration. Prepare STAR-style stories that highlight how you’ve driven results under tight timelines and navigated stakeholder dynamics.
Process differs for each role—see our Data Scientist guide, Data Engineer guide, and other role-specific breakdowns.
With this roadmap, you’ll know Tiger Analytics interview questions to expect and how the Tiger Analytics interview process unfolds. Dive into the guide that matches your target role to master each stage and land your offer. Good luck!
Challenge
Check your skills...
How prepared are you for working at Tiger Analytics?
Most Common Tiger Analytics Interview Questions
Candidates often wonder which topics recur across roles and how to channel their prep most effectively. Below, you’ll find pointers on where to find role-specific question banks, what coding challenges to expect, and how behavioral and values-based prompts are framed.
Role-Specific Interview Guides
- Tiger Analytics Data Scientist Interview Guide
- Tiger Analytics Data Engineer Interview Guide
- Tiger Analytics Data Analyst Interview Guide
- Tiger Analytics Machine Learning Engineer Interview Guide
- Tiger Analytics Business Analyst Interview Guide
- Tiger Analytics Software Engineer Interview Guide
Technical Coding Questions (Python & SQL)
Popular searches like Tiger Analytics python coding questions and Tiger Analytics SQL interview questions show candidates should expect a mix of data-manipulation scripts and query-optimization tasks. Typical challenges include writing window-function queries to compute rolling metrics, optimizing Pandas pipelines for large data sets, and debugging performance bottlenecks in Python loops. Cross-reference each exercise with the role-specific guides above for detailed solutions and best practices.
Rotate a square matrix 90° clockwise in-place.
This Python-side classic shows up in almost every Tiger Analytics screen—from SWE to MLE—because it quickly exposes your grasp of array indexing, boundary handling, and space constraints. Interviewers expect the layer-by-layer swap solution, a Big-O proof of O(N²) time / O(1) space, and a short discussion of edge cases (odd dimensions, 1×1 matrices). Be ready to contrast naïve “build a new matrix” approaches with the in-place algorithm and explain why the latter is preferable for large image or tensor data in production.
-
This window-function staple appears in DS, DE, BA, and SWE interviews because it tests familiarity with DENSE_RANK / ROW_NUMBER and edge-case thinking. The panel wants to hear why your solution avoids skipping values when multiple employees share the top salary and how indexes (e.g., department_id, salary) influence performance on tens of millions of rows. Extra credit: compare alternative sub-query and CTE strategies and note which databases support them.
Given an array 0…n with one missing value, design an O(n) algorithm to find the missing number.
Tiger loves this exercise for its simplicity and versatility—it can be solved with arithmetic series math, XOR tricks, or hash sets. You’ll be asked to articulate the time/space trade-offs of each approach and to validate with a small example. Follow-ups often pivot to streaming data (“n is huge and you read integers once”) to assess scalability mindset.
Return the indices of two numbers that add up to a target in O(n) time.
The canonical “two-sum” problem checks whether you instinctively reach for a hash map, understand amortized lookup cost, and can handle duplicates or negative numbers. Expect to defend your choice of data structure, outline memory impact, and consider extensions such as very large arrays distributed across nodes. Clear variable naming and early exit logic matter here.
Generate all prime numbers ≤ N.
This appears in Python rounds for SWE, DE, and MLE roles because it uncovers algorithmic range: a quick loop for small N is fine, but Tiger hopes you’ll mention the Sieve of Eratosthenes and its O(N log log N) efficiency. Discuss memory versus speed, boundary cases (N < 2), and how you’d optimize for GPUs or parallelism if N ≈ 10⁹.
-
This problem tests your ability to reason about sorting as a pre-processing step (O(n log n)) to achieve pairwise O(n) scanning, rather than quadratic brute force. Interviewers probe for stability when duplicates exist and how you maintain ascending order in the final list. It’s a quick litmus for big-O intuition and clean edge-case handling.
Compute the three closest SAT-score student pairs and report the score gap.
Frequently given to BAs and DEs, this SQL window-function task examines LEAD/LAG usage and tie-breaker logic (alphabetically higher name pair). The team cares about demonstrating ordered partitions, efficient indexing on score, and why self-joins would be less performant. Be prepared to talk through data skew and how to paginate results for millions of students.
-
This date-range overlap query shows up in nearly every Tiger track because it blends window functions with Boolean aggregation. Key signals include understanding of inclusive vs. exclusive boundaries, handling NULL end_dates, and database-specific interval functions. Interviewers often extend the problem to count overlapping ranges or optimize with generated columns and B-tree indexes.
-
Tiger’s consulting work demands rock-solid join logic and time-series reasoning; this question checks both. A correct solution requires partitioning by user_id, ordering by session time, and filtering conversions—all while keeping the query performant with selective predicates and composite indexes. You’ll be asked how the output feeds dashboards and downstream ML models.
Produce a word-frequency dictionary for a paragraph and return the top N terms with counts.
This Python task is common because it mixes text preprocessing, algorithmic efficiency, and data-structure choice (Counter vs. manual dict). Interviewers expect you to normalize case, strip punctuation, and explain complexity: O(total_words) for counting and O(N log k) for retrieving the top N terms via a heap. Discussion often shifts to memory optimization for very large corpora or streaming tokenization.
Behavioral Questions for Freshers
Tiger Analytics interview questions for freshers often center on teamwork, adaptability, and a growth mindset. You might be asked to describe times when you learned a new tool under time pressure, collaborated on a group project with shifting requirements, or received feedback and iterated on your approach. Structuring your responses with the STAR method (Situation, Task, Action, Result) ensures clarity and impact even if you lack extensive professional experience.
Describe a data project you worked on. What were some of the challenges you faced?
Interviewers use this prompt to see whether you can break a problem down, set priorities, and push through ambiguity even with limited corporate experience. Show that you can explain business context, your individual contribution, and how you measured success. Be ready to talk about trade-offs (e.g., accuracy vs. deadlines) and how you escalated blockers. Telling a concise STAR story proves you can own tasks from start to finish despite being early in your career.
What are some effective ways to make data more accessible to non-technical people?
Freshers are often asked this to gauge user-empathy and communication skills. Tiger’s consultants routinely explain dashboards or statistical results to business stakeholders; hiring managers want evidence you can translate jargon into plain English. Discuss specific tactics—data visualizations, layered documentation, standardized metric definitions—and reference a time you simplified insights for classmates or internship mentors. Highlight any tools you used (Tableau, Looker, Markdown wikis) to demonstrate practical know-how.
What would your current manager say about you, and what constructive criticisms might they give?
The company values self-awareness over polished perfection. Good answers pair a real strength (e.g., “I’m meticulous with SQL edge cases”) with an actionable weakness (“I tended to over-explain code; I now use architecture diagrams”). Recruiters listen for evidence that you actively seek feedback and track improvement. Avoid humble-brag clichés—pick a genuine area you’re already addressing through courses, peer reviews, or time-boxing techniques.
-
Even junior analysts must field questions from product, ops, or client teams. This scenario tests conflict-resolution skills and emotional intelligence. Explain how you identified the root misunderstanding, adapted your medium (e.g., switched from SQL snippets to a slide deck), and validated that everyone was aligned. End with the measurable outcome—faster sign-off, fewer change-requests, or smoother sprint planning.
Why did you apply to our company, and what makes you a good fit?
At the fresher level, motivation is a big hiring signal because technical depth is still growing. Tie Tiger’s industry-agnostic, problem-solving culture to your own career goals, citing specific case studies or thought-leadership pieces you’ve read. Then bridge to your skill set—perhaps coursework in time-series forecasting or a Kaggle project that mirrors Tiger’s work. Concrete parallels reassure the panel you’ve done real research, not boiler-plate flattery.
How do you prioritize multiple deadlines, and how do you stay organized when you have many?
Fresh grads often juggle capstone projects, exams, and internships—interviewers want to hear that story. Talk about frameworks (Eisenhower matrix, sprint boards, calendar blocking) and how you communicate delays early. Include a metrics-driven outcome such as “delivered 3 dashboards ahead of demo day while maintaining a 95 % test-coverage target.” Emphasize learnings you can transfer to client projects with tight SLAs.
Describe a time you had to learn a new tool or programming language quickly to hit a deadline.
This home-grown question checks adaptability—the trait Tiger prizes when deploying consultants to varied tech stacks. Detail how you scoped what to learn, the resources you used (official docs, MOOCs, pair programming), and how fast you achieved productive output. Include any quality checkpoints (unit tests, code review) that proved competence.
Tell us about a situation where you received critical feedback and how you incorporated it.
Early-career hires must ramp fast, so coachability is key. Explain the feedback context (peer code review, presentation dry-run), the specific change you made, and the performance lift that followed. Show humility but end on the proactive steps you now take—e.g., rubber-duck sessions or automated linting—to avoid repeating mistakes.
Give an example of working effectively in a team when you were the most junior member.
Tiger’s project pods mix experience levels, so leaders look for collaboration and initiative. Describe how you volunteered for a sandbox task, asked clarifying questions, and shared interim results to unblock others. Emphasize interpersonal tactics—Slack etiquette, concise stand-ups—that kept the project running smoothly and demonstrated leadership potential without overstepping.
How do you stay motivated when performing repetitive data-cleaning tasks?
Reality at analytics firms often involves scrubbing messy datasets. Interviewers probe for grit and process orientation. Discuss creating reusable scripts, documenting data-quality rules, or automating checks with CI pipelines. Framing menial work as a chance to sharpen regex, pandas, or SQL window-function chops shows you can find learning value in every step of the pipeline.
Mission & Values Questions
Tiger Analytics places great emphasis on client obsession, rapid experimentation, and ethical data use. Expect prompts that probe how you’ve driven client-centric solutions under tight deadlines, proposed innovative prototypes, or upheld data privacy standards. Preparing concise stories that highlight your alignment with these values will demonstrate both cultural fit and your readiness to contribute from day one.
Tell us about a time you went above and beyond to uncover a client’s real pain-point rather than just delivering the requested analysis.
The firm’s “client obsession” mantra means analysts must think like advisors, not order-takers. Interviewers look for evidence that you dug into root causes, asked second-layer “why” questions, and possibly reframed the scope. Detailing how that extra discovery changed the final deliverable—and boosted client satisfaction or revenue—shows you understand the consultative mindset Tiger expects.
Describe an instance where you rapidly prototyped a machine-learning or BI solution under an aggressive deadline. What trade-offs did you make?
Rapid experimentation is core to Tiger’s agile culture. The panel wants to know if you can balance speed with statistical rigor—e.g., shipping an MVP with fewer features but strong validation metrics. Highlight how you managed stakeholder expectations, documented assumptions for later iterations, and measured post-release impact.
Give an example of how you handled sensitive or personally identifiable data to ensure privacy and compliance.
Ethical data use is non-negotiable, especially with global clients subject to GDPR, HIPAA, etc. Explain safeguards you implemented—tokenization, role-based access, differential privacy—and any audits or peer reviews you passed. Showing familiarity with legal frameworks signals you won’t expose Tiger or its clients to risk.
Walk us through a situation where experimental results contradicted a senior stakeholder’s intuition. How did you advocate for the data while maintaining the relationship?
This probes integrity and communication under pressure. Discuss how you verified the analysis, prepared clear visual evidence, and framed insights in business language. Emphasize collaboration—perhaps you proposed an A/B hold-out or additional metric check—to align on facts without ego clashes.
Tell us about a project where you integrated feedback loops to continuously improve a deployed model or dashboard.
Tiger values “iterate and learn.” Describe monitoring pipelines—error tracking, model-drift alerts, or user-engagement KPIs—and the cadence for refinements. Evidence that you treat delivery as the start of a lifecycle, not the finish line, shows long-term ownership.
Describe a time you identified an automation opportunity that saved significant analyst hours or cloud costs.
Cost-effective innovation matters to clients. Outline how you spotted repetitive tasks or over-provisioned resources, proposed a script or workflow change, and quantified savings. Interviewers listen for initiative, ROI framing, and the ability to socialize best practices across teams.
Share an example of mentoring or up-skilling teammates to raise overall project quality.
Even early-career hires are expected to contribute to Tiger’s learning culture. Talk about leading a lunch-and-learn on advanced pandas tricks, setting up a shared code-review checklist, or pairing with a colleague on SQL optimization. The key is demonstrating collaborative growth, not individual heroics.
Tell us about a situation where you balanced model accuracy against interpretability to meet client needs.
Many engagements require transparent decisions (e.g., credit-risk, healthcare). Explain the business context, algorithms considered, and why you might have chosen a GAM over XGBoost—or added SHAP explanations—so stakeholders could trust the output. This displays pragmatic value alignment.
Describe how you validated that your analysis or model genuinely drove the intended business metric rather than a vanity metric.
The company stresses outcomes over dashboards. Discuss causal inference, control groups, or pre-post analyses you used to link analytics work to revenue, churn reduction, or operational efficiency. Quantifying the lift and acknowledging confounding risks show scientific rigor.
Give an example of collaborating with multidisciplinary teams (e.g., domain experts, UI designers, data engineers) to deliver a holistic solution.
Tiger’s projects span the full analytics stack. Demonstrate how you translated domain jargon into data specs, aligned engineering constraints with model requirements, and iterated with designers for an intuitive interface. Showing respect for every specialty underscores your fit within cross-functional pods.
Tips When Preparing for a Tiger Analytics Interview
Your Tiger Analytics interview experience will be defined by realistic coding screens, case-study deep dives, and values-based discussions. Use the guidance below to structure your prep.
Replicate the Online Assessment Environment
Set a 60-minute timer and practice Hackerearth-style Python/SQL quizzes in a blank editor. Familiarize yourself with common pitfalls—missing imports, off-by-one errors, and inefficient loops—so they don’t slow you down on test day.
Master Python & SQL Foundations
Focus on advanced SQL clauses (window functions, CTEs) and efficient Pandas operations (vectorization, chunked reading). Reinforce these skills by revisiting role-specific coding questions from our guides and timing yourself to build both speed and accuracy.
Craft Compelling Data Stories
When presenting case-study findings, weave in clear metrics (e.g., “reduced query time by 40%”) and business impact (e.g., “improved client decision speed”). Practice structuring slides or whiteboard sketches that lead stakeholders logically from problem definition to recommendation.
Research Consulting Case Frameworks
Blend analytical rigor with business context by learning frameworks like MECE, hypothesis-driven problem solving, and cost-benefit analysis. This approach ensures you can pivot seamlessly between data calculations and strategic recommendations during your case round.
Prepare Thoughtful Questions for Each Round
End every interview by asking tailored questions about Tiger Analytics’ delivery model, upcoming client initiatives, or the team’s technology roadmap. Demonstrating curiosity about their processes and challenges underscores your genuine interest and cultural fit.
Good luck—your structured prep will turn the unknowns of the interview into familiar challenges ready for you to conquer.
Salaries at Tiger Analytics
Average Base Salary
Average Total Compensation
Tiger Analytics offers competitive compensation that often exceeds market averages for similar roles. While the overall Tiger Analytics salary ranges vary by level and geography, data-focused positions typically command premiums. For example, the Tiger Analytics data scientist salary is structured to attract top statistical talent, and the data engineer salary at Tiger Analytics reflects the growing demand for robust pipeline expertise. Across the board, total rewards include base pay, performance bonuses, and equity components that align with industry-leading consultancies.
Conclusion
Understanding the Tiger Analytics interview process and practicing against role-specific question banks are the two most reliable ways to build confidence and secure an offer. Bookmark the detailed guides for Data Scientist, Data Engineer, Data Analyst, Machine Learning Engineer, Business Analyst, and Software Engineer to focus your study where it matters most.
- Tiger Analytics Data Scientist Interview Guide
- Tiger Analytics Data Engineer Interview Guide
- Tiger Analytics Data Analyst Interview Guide
- Tiger Analytics Machine Learning Engineer Interview Guide
- Tiger Analytics Business Analyst Interview Guide
- Tiger Analytics Software Engineer Interview Guide
To take your preparation further, schedule a mock interview with Interview Query and learn from success stories like Jayandra Lade.
FAQs
What are the typical Tiger Analytics interview rounds?
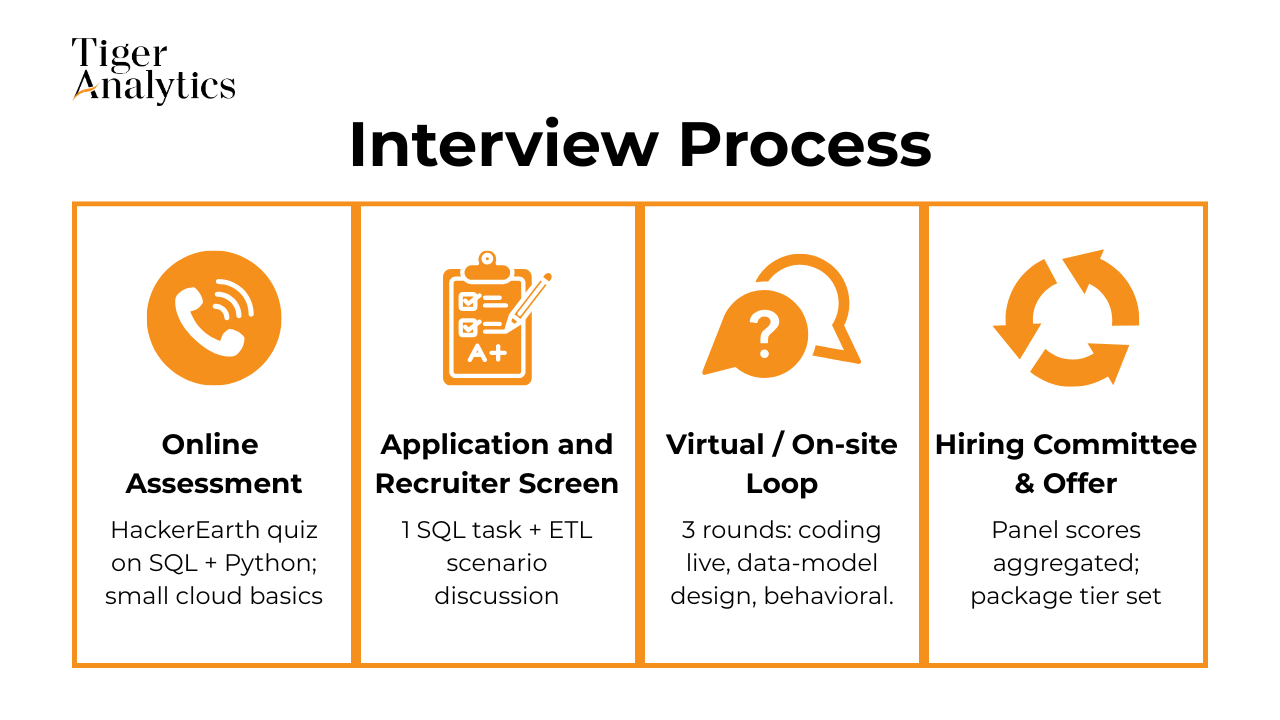
Tiger Analytics interview rounds generally follow this structure:
- Online Assessment: A timed Hackerearth quiz covering Python, SQL, or case-based problems.
- Technical Phone Screen: Live coding and ML or analytics discussion.
- Virtual Onsite Loop: Multiple back-to-back interviews including case studies, system design, and behavioral.
- Hiring Committee & Offer: Panel debrief, compensation calibration, and final decision.
How long does the Tiger Analytics hiring process take?
The process usually spans 3–4 weeks, though factors like candidate availability, panel scheduling, and urgent client needs can accelerate or extend this timeline.
What is the interview experience like at Tiger Analytics for freshers?
Many report that the Tiger Analytics interview experience for entry-level roles emphasizes core problem-solving and communication skills. Freshers can expect straightforward Python/SQL challenges, guided case studies, and supportive panelists who value curiosity and a learning mindset.
How difficult are the Tiger Analytics Python coding questions?
Candidates typically encounter mid-level algorithmic problems—such as array manipulations, graph traversals, and recursion—and data-cleaning tasks involving Pandas or list comprehensions. While not “hard” in the competitive coding sense, these questions assess both correctness and efficiency.
What SQL topics are most tested by Tiger Analytics?
The most common SQL themes include:
- Joins: Inner, outer, and self-joins for combining related tables.
- Window Functions: ROW_NUMBER(), RANK(), and rolling aggregations.
- Optimization: Index usage, CTEs vs. subqueries, and execution-plan considerations.
Discussion & Interview Experiences