Adobe Data Analyst Interview Guide (2025) – Questions, Process & Tips


Introduction
Preparing for an Adobe data analyst interview means stepping into a role where creativity meets data at scale. Adobe powers tools used by millions worldwide, and its analysts play a critical part in shaping those experiences. With average U.S. compensation for data analysts reaching $85K–$110K and demand for analytics roles up 20% since 2024, competition is fierce, and preparation is key.
In this guide, we’ll break down what the adobe data analyst role looks like day-to-day, highlight the culture that emphasizes “Creativity for All,” and explain how analysts influence product direction through dashboards, SQL reporting, and experimentation. You’ll also get a detailed look at the interview process, the most common data analyst adobe questions, and practical strategies to stand out. Whether you’re targeting your first analyst role or looking to grow into product analytics, this is your roadmap to landing the job.
Role Overview & Culture
Life as an Adobe data analyst is about turning massive volumes of Creative Cloud usage data into insights that shape products millions rely on daily. On a typical day, analysts query large datasets with SQL, build dashboards in Tableau or Power BI, and design experiments to test new product features. They partner closely with product managers and designers to define success metrics, track adoption, and recommend improvements based on user behavior.
Culturally, Adobe blends rigor with creativity. The company prizes a data-driven mindset but encourages analysts to think beyond numbers, translating findings into stories that inspire product direction. Collaboration is core: analysts sit alongside engineering, marketing, and design teams to influence roadmaps with evidence. With visibility into product launches and the chance to impact global tools like Photoshop, Acrobat, and Illustrator, analysts experience firsthand how their work enables Adobe’s mission of “Creativity for All.”
Why This Role at Adobe?
The Adobe data analyst role stands out because of the scale of impact and the clear path for growth. Analysts influence decisions behind products like Photoshop and Illustrator that touch millions of creators worldwide. Every dashboard or experiment has the potential to shift how people design, collaborate, and express ideas.
Career growth is also a major draw. The company invests in its people through a dedicated learning budget, mentorship programs, and internal mobility across product lines. For anyone who wants to pair technical rigor with creative impact, the data analyst Adobe role is a rare opportunity to grow into a strategic partner at the center of innovation.
What Is the Interview Process Like for a Data Analyst Role at Adobe?
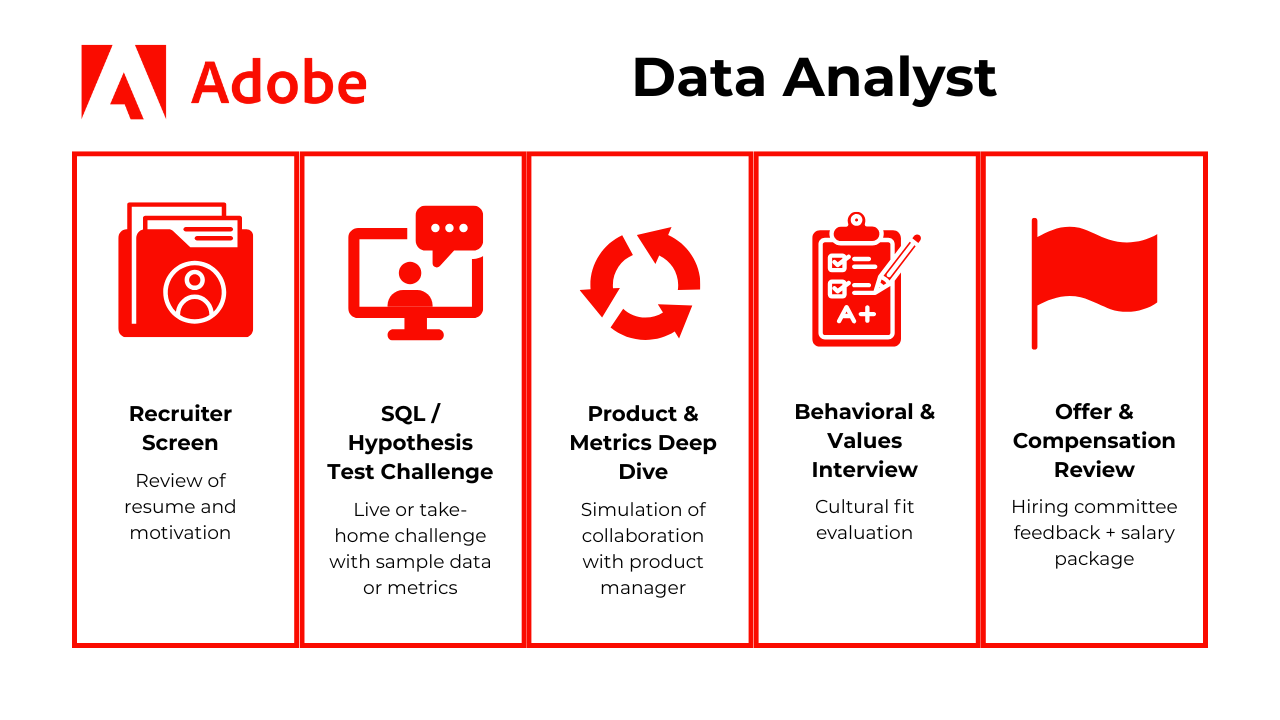
Recruiter Screen
This introductory call evaluates your overall fit for the Adobe data analyst role. The recruiter will walk through your resume, probe into your motivation for joining Adobe, and ask about your most impactful analytical projects. They may explore how you’ve collaborated with stakeholders, communicated insights, and contributed to business outcomes. Since this is also your first impression, clarity and enthusiasm matter as much as technical skill.
Tip: Prepare a concise, story-driven introduction that highlights your technical skills (SQL, Python, Tableau) and ties them directly to product-facing outcomes. Practice a 2–3 minute pitch of your background that makes you memorable. If you don’t have any prior experience, here’s how you can create a data analyst resume to showcase your skills.
SQL/Hypothesis Test Challenge
This technical round assesses your ability to query data and think analytically about results. It typically involves a live SQL session or a take-home challenge using sample Creative Cloud usage data or funnel performance metrics. You might be asked to write queries to calculate retention, identify drop-offs, or measure engagement. Beyond coding, you’ll be expected to interpret the results and suggest the next hypothesis or experiment.
Tip: Don’t just stop at the SQL output, always explain why it matters. Frame your answer in business terms: “The data shows a 15% drop in activation; the next test I’d run is X to validate if onboarding changes would fix it.” You can review the ultimate SQL cheat sheet to improve your skill and ace any SQL problems.
Product & Metrics Deep Dive
In this round, you’ll simulate working with a product manager. Expect to define success metrics for a new feature, propose experiments, or interpret A/B test outcomes. You’ll likely face questions about trade-offs between leading and lagging metrics, pitfalls like Simpson’s paradox, or how to measure ambiguous outcomes such as “creativity.” Adobe looks for analysts who can bridge data with product strategy and influence decisions.
Tip: Use a structured approach like “Goal → Metric → Experiment → Trade-offs.” This shows you can move fluidly from strategy to data to actionable insights, exactly what product teams expect. You can read about the complete breakdown of data analytics case study to enhance your creative problem-solving.
Behavioral & Values Interview
This round tests whether you embody Adobe’s culture of inclusivity and experimentation. Interviewers may ask how you’ve handled ambiguity, championed diverse perspectives, or navigated conflicts in cross-functional teams. They want to see curiosity, resilience, and influence without authority. Expect open-ended prompts like, “Tell me about a time you disagreed with a stakeholder. How did you handle it?”
Tip: Frame answers with the STAR method (Situation, Task, Action, Result), but add a reflection at the end. For example: “Here’s what I learned, and how I’d apply it at Adobe.” This demonstrates growth mindset and alignment with “Creativity for All.”
Offer & Compensation Review
After the interviews, Adobe’s hiring committee consolidates feedback across rounds to decide leveling and fit. If successful, you’ll receive an offer that typically includes base salary, annual bonus eligibility, and a professional learning stipend. The recruiter will also share details about your initial team placement and discuss longer-term career mobility within Adobe.
Tip: Research compensation benchmarks before this stage and prepare thoughtful questions about team structure and growth opportunities. This positions you as forward-thinking, not just focused on pay.
Behind the Scenes
Hiring decisions at Adobe are collaborative. A panel debrief and hiring manager discussion weigh technical ability, communication skills, and culture alignment equally. Feedback is usually finalized within 3–5 business days, with recruiters providing transparent updates. Adobe values process clarity, so candidates rarely feel left in the dark.
Tip: After each round, jot down key questions you were asked and your responses. This helps you spot themes and refine your narrative for subsequent interviews.
Differences by Level
For senior candidates, expectations go beyond technical execution. You may be asked to prepare a business case presentation, lead a stakeholder alignment scenario, or design an experiment framework for a large-scale launch. These exercises measure your ability to influence strategy, mentor peers, and drive measurable business outcomes. Leadership maturity and vision are just as critical as data fluency.
Tip: If you’re interviewing for senior levels, prepare a polished 10-15 minute case study from your past work that showcases both technical depth and strategic leadership. This demonstrates readiness to operate at Adobe’s higher bar.
Challenge
Check your skills...
How prepared are you for working as a Data Analyst at Adobe?
What Questions Are Asked in an Adobe Data Analyst Interview?
Coding/Technical Questions
The following Adobe SQL interview questions focus on common tasks you’ll face when extracting and transforming large datasets. Expect window functions, joins, and analytical queries in the Adobe Data Analyst interview.
Query top three users with most upvotes on non-deleted comments
Use
GROUP BY,ORDER BY, and possibly window functions to rank users by total upvotes on valid comments. Filter out deleted records using aWHEREclause or join. Consider usingRANK()if multiple users are tied in score. This question checks your ability to aggregate and filter across complex conditions.Tip: Always state your assumptions (e.g., “I’m assuming deleted = 1 means removed”) before writing the query. Interviewers value clarity of thought as much as code correctness.
Identify customers with more than three transactions in a week
This can be approached using a
GROUP BYwithCOUNT(*)over a 7-day window per user. You’ll need to derive the week or rolling window usingDATE_TRUNCor conditional filtering. Look out for duplicate users across different time spans. Useful for understanding behavioral segmentation at Adobe.Tip: If you’re unsure about time functions (
DATE_TRUNC,WEEK()), explain both possible approaches: calendar week vs. rolling 7-day window. Demonstrating flexibility earns points.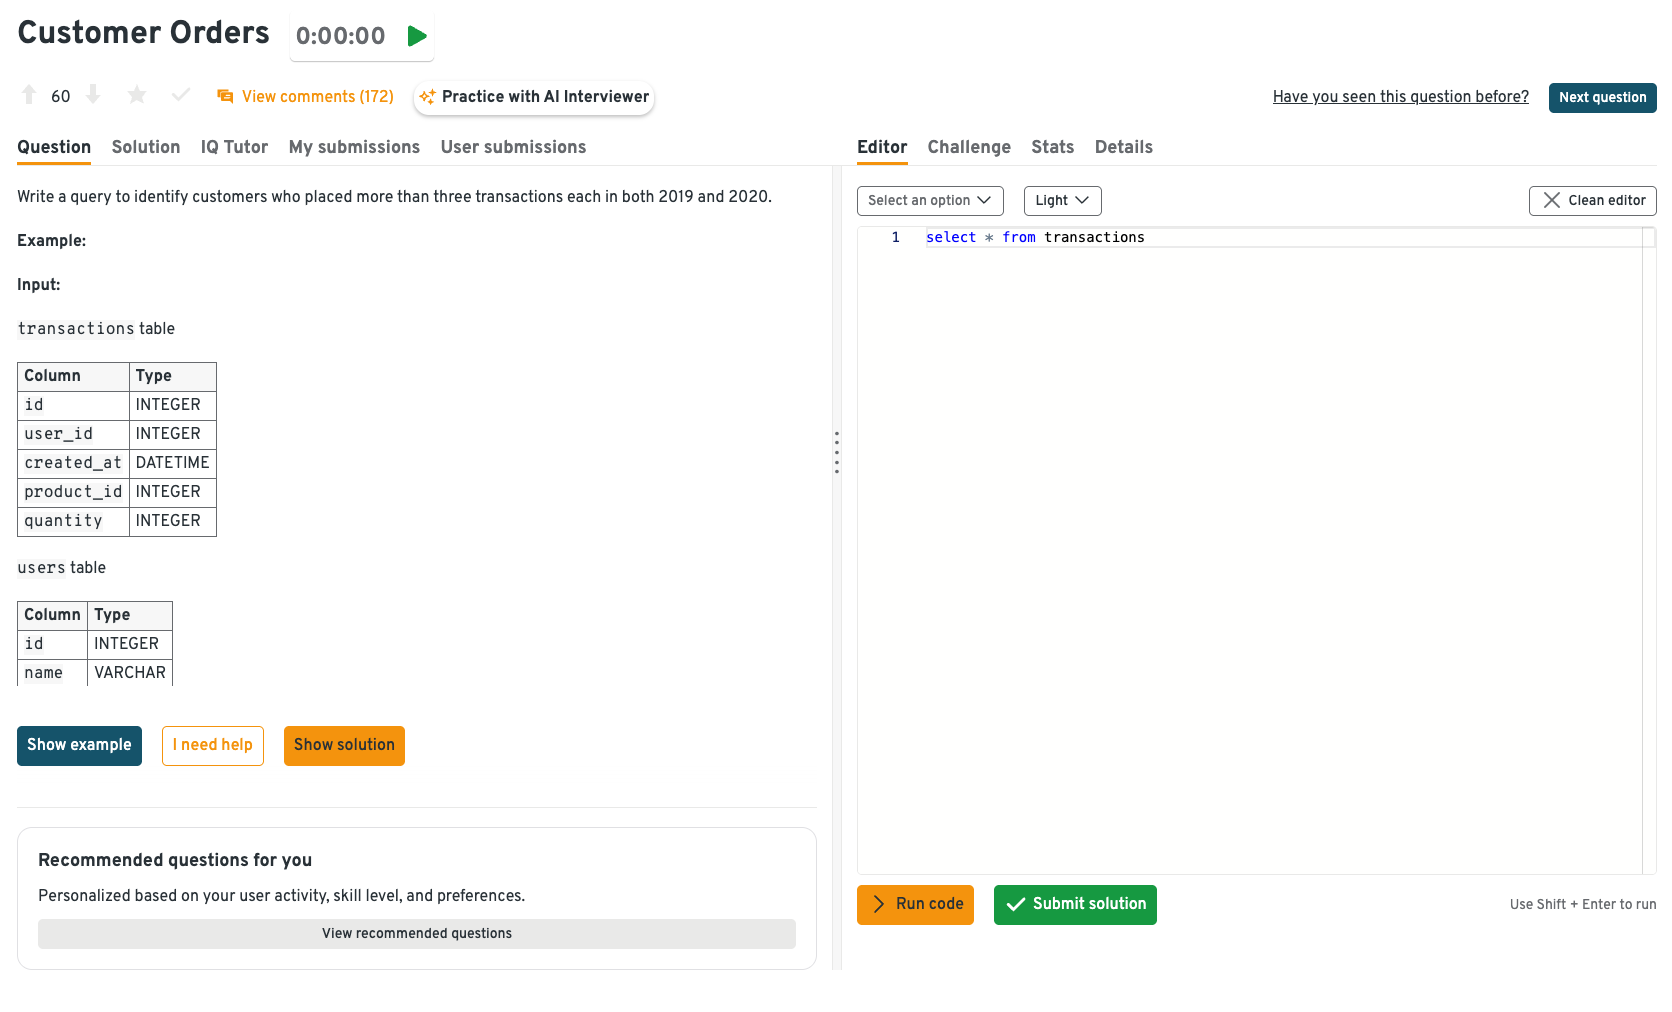
You can solve this problem on Interview Query dashboard. This dashboard makes practicing SQL interview questions much more effective by combining code execution, schema details, and solution hints in one place. On the left, you can view the schema and question requirements, while the right-hand editor allows you to write and run SQL directly against the sample dataset. Features like “Show example,” “I need help,” and “Show solution” provide step-by-step learning support, and the timer helps you simulate real interview pressure. By practicing in this environment, you can build confidence, validate their queries instantly, and develop the problem-solving speed expected in technical interviews at companies like Adobe.
Query total amount spent on each item by users
Multiply quantity by price and aggregate by item and user. Use
SUM(quantity * price)grouped by user and item identifiers. Handle edge cases like missing values or joins with product metadata. Relevant to pricing optimization scenarios for digital tools at Adobe.Tip: Go beyond the query. Suggest how the result could be applied, like identifying high-value products or tracking bundle performance. This shows business impact awareness.
Write a query to find the third purchase of every user
Use
ROW_NUMBER()partitioned by user and ordered by purchase timestamp. Filter where row number equals three. This is a classic SQL window function challenge. It tests your understanding of sequential behavior, which is helpful in modeling purchase funnels.Tip: When using window functions, always explain why you chose
ROW_NUMBER()vs.RANK()orDENSE_RANK(). It shows you understand subtle differences in SQL ranking logic. You can review the window functions in SQL to avoid any common mistakes in the real interview.Weekly Active Creators with Rolling 7-Day Window
Schema
events(user_id, event_name, event_time TIMESTAMP) — includes open_app, export_file, share_link, etc.
Task: Return daily counts of active creators (users with ≥1 “create” action: export_file or share_link) using a rolling 7-day window.
WITH create_events AS (
  SELECT
    user_id,
    DATE(event_time) AS d
  FROM events
  WHERE event_name IN ('export_file', 'share_link')
  GROUP BY 1,2
),
rolling_days AS (
  SELECT
    d,
    GENERATE_SERIES(d - INTERVAL '6 day', d, INTERVAL '1 day')::date AS d_in_window
  FROM (SELECT DISTINCT d FROM create_events) dd
)
SELECT
  r.d AS as_of_day,
  COUNT(DISTINCT c.user_id) AS active_creators_7d
FROM rolling_days r
LEFT JOIN create_events c
  ON c.d = r.d_in_window
GROUP BY 1
ORDER BY 1;
Tip: If volume is huge, replace GENERATE_SERIES with a date spine table and pre-aggregate per day to keep scans small.
Product Metrics & Experimentation Questions
During Adobe data analyst interview, expect to evaluate product launches, retention trends, and A/B test design. These questions cover real-world performance monitoring and experimentation logic.
Describe how to measure the success of IGTV
To measure IGTV’s success, you’d look beyond raw views and track deeper engagement like repeat viewership, completion rate, and average watch time compared to other video formats. You’d also weigh outcomes against costs, such as production resources or ad spend, to ensure ROI. Benchmarking IGTV against Stories, Reels, or competitor platforms gives additional context on whether users find the format valuable.
Tip: Always layer business impact on top of engagement metrics. Interviewers want to see that you can connect user activity to long-term product or revenue goals.
Investigate causes for a 10% dip in ad fill rate
Ad fill rate is calculated as
ads_served / ads_requested, so a dip could stem from changes in supply (fewer ads requested) or demand (fewer ads served). You’d break this down by geography, publisher, device type, or ad slot to identify anomalies and compare against historical baselines. This helps uncover whether the issue is systemic, like demand-side changes, or localized, such as a partner integration problem.Tip: In interviews, mention a systematic framework like “supply vs. demand” and walk through it step by step. It signals structured thinking under pressure.
Define metrics to evaluate the launch success of fractional share trading
For a new product launch, success metrics should balance adoption, engagement, and retention. You’d measure activation rate (how many eligible users make at least one fractional trade), average trade volume per user, and re-engagement over subsequent weeks. Tracking churn or inactivity after the first trade helps determine if the feature is sticky or simply a novelty.
*Tip: When defining launch success, always frame metrics in stages of the funnel (adoption, engagement, and retention) to show you can capture the full product lifecycle.*
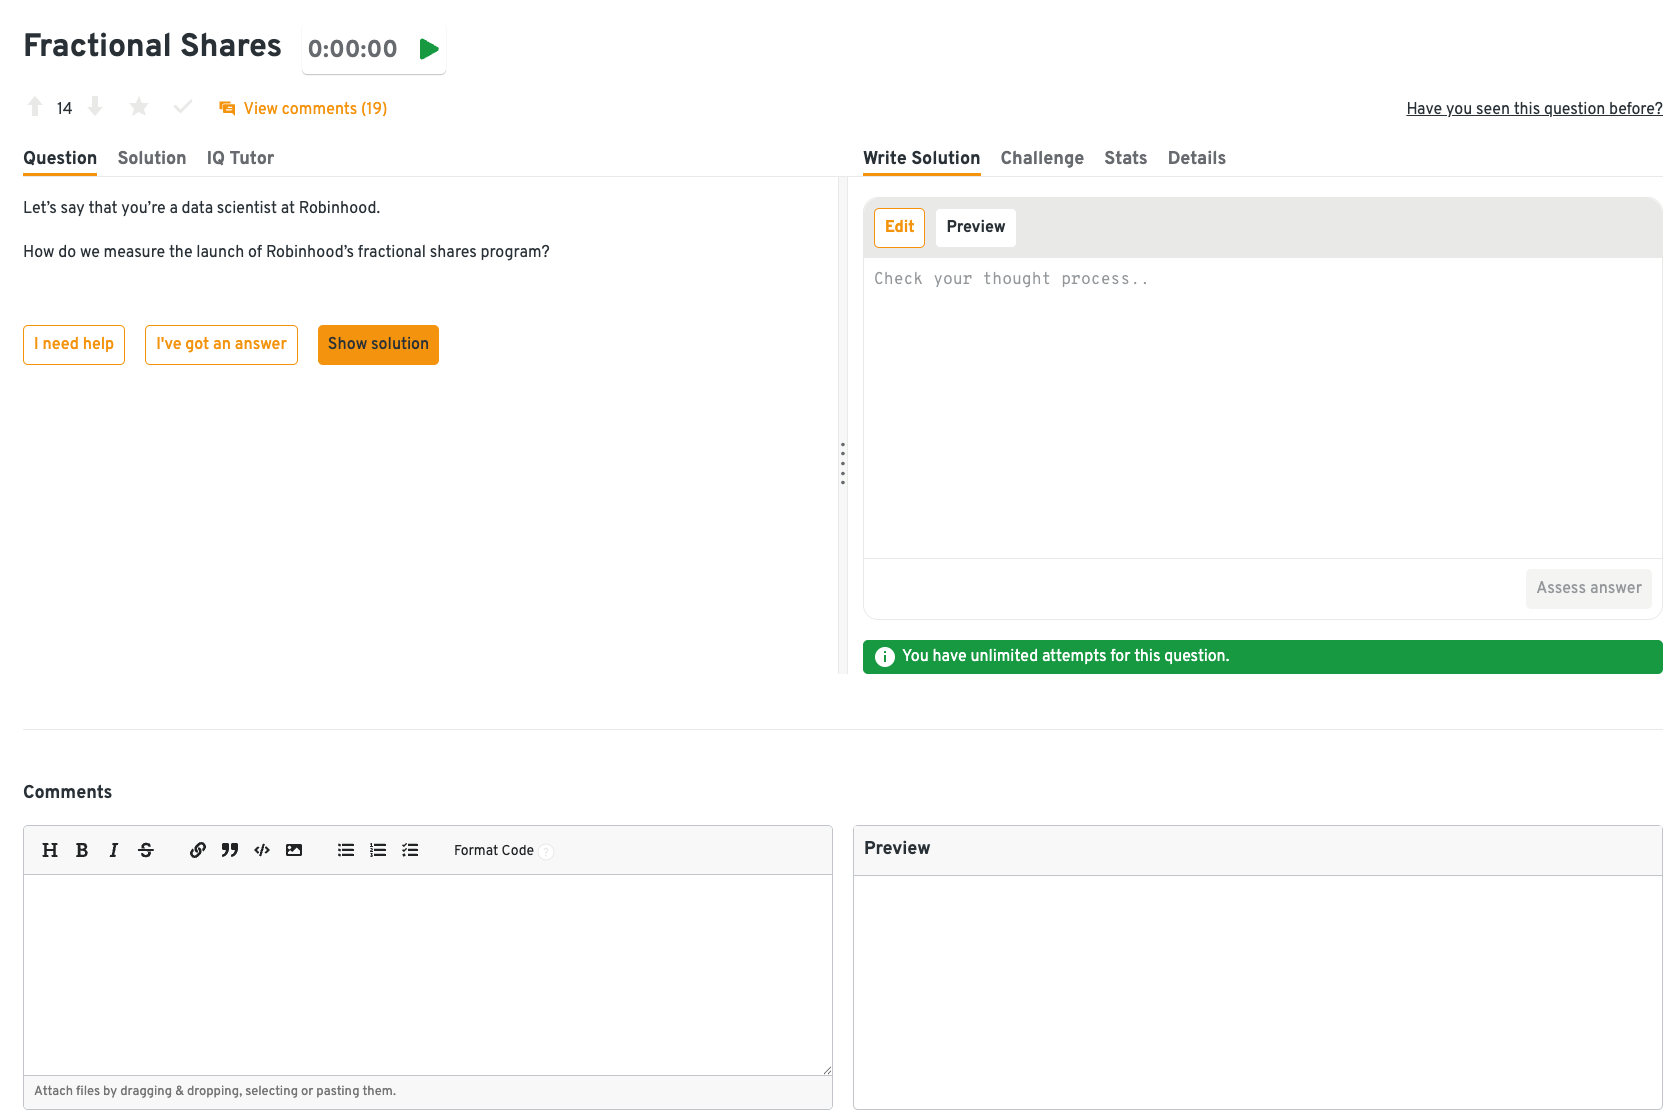
Using Interview Query dashboard for this question can guide you through the same problem-solving flow used in real interviews. The left panel clearly states the scenario and prompt, while the right panel gives space to draft and refine your answer, simulating how you’d structure responses in front of an interviewer. Integrated tools like “I need help,” “I’ve got an answer,” and “Show solution” let you control your level of guidance, ensuring a balance between independent thinking and learning support. By practicing in this environment, you can strengthen your ability to frame metrics across adoption, engagement, and retention, exactly the structured approach expected in high-level data analyst interviews.
How would you evaluate retention across user cohorts over a 6-month period?
You’d calculate cohort-based retention curves, grouping users by signup month and tracking how many return each subsequent week or month. Visualizing this as a cohort matrix highlights patterns like drop-offs or sticky segments across acquisition sources. Normalizing results by channel ensures fair comparisons, revealing whether retention issues are product-related or tied to marketing quality.
Tip: In retention questions, always mention visuals (curves, heatmaps, matrices). Companies like Adobe value candidates who can turn numbers into stories that influence strategy.
How would you design an A/B test to measure Adobe Acrobat onboarding flow improvements?
You’d start by defining the primary success metric, such as onboarding completion rate or first-week engagement with key features. The test would involve randomly assigning users into control and treatment groups, ensuring balance across key demographics. You’d monitor the experiment for statistical significance while avoiding premature peeking, and consider whether a staggered rollout is needed to mitigate risk.
Tip: Highlight both experiment design (metrics, randomization) and practical pitfalls (peeking, sample size, bias). This shows you understand not only the theory but also the execution challenges.
Behavioral or Culture‑Fit Questions
These questions assess how you handle ambiguity, communicate insights clearly, and collaborate across teams, all essential for thriving as an Adobe data analyst.
Tell me about a time you had to work with incomplete data. What did you do?
When faced with missing or incomplete data, show that you didn’t freeze, but adapted. Use the STAR method: describe the situation, how you identified gaps, what proxies or external sources you used, and how you communicated limitations. Emphasize delivering value despite uncertainty.
Example: In a web analytics project, I discovered that 20% of session logs were missing due to a tracking bug. I compared affected versus unaffected days to estimate the missing portion, validated against external Google Analytics exports, and clearly flagged the margin of error in my report. This allowed the team to move forward with 90% confidence rather than pausing the entire analysis.
Tip: Always state assumptions clearly. Adobe interviewers value transparency in how you handle ambiguity and communicate limitations.
Describe a situation where you had to explain a complex analysis to a non-technical stakeholder.
Here, show that you can translate technical details into business outcomes. Keep the explanation simple, structured, and supported with visuals.
Example: I once had to explain a churn prediction model to a marketing director. Instead of discussing algorithms, I presented three customer personas with their churn probabilities and suggested tailored retention campaigns. The director immediately grasped the value, and the company launched a targeted email campaign that reduced churn by 12%.
Tip: Use storytelling. Frame data insights as “what it means” rather than “how it works.”
Give an example of a time when a project didn’t go as planned. How did you handle it?
Describe what went wrong, how you adapted, and how you maintained stakeholder trust. Be honest but show resilience. End with a lesson learned. Shows accountability and problem-solving under pressure.
Example: During an A/B test on a new onboarding flow, we realized halfway that randomization wasn’t balanced due to a technical bug. Instead of discarding everything, I rebalanced the cohorts statistically, documented the issue, and re-ran the test. The outcome delayed launch by a week, but it preserved data integrity and led to stronger internal QA processes.
Tip: Frame setbacks as opportunities to improve systems and processes, not just one-off mistakes
Tell me about a time you took initiative on a data project.
Walk through how you spotted an opportunity or inefficiency, pitched your idea, and took action. Highlight impact with a concrete result. Proactivity is valued in data-driven cultures like Adobe’s.
Example: While monitoring weekly dashboards, I noticed a steady decline in search traffic to a product page. I dug deeper, found broken backlinks, and alerted the SEO team. They fixed the issue, and traffic recovered by 18% in the next month. This proactive step prevented further revenue loss and built trust with leadership.
Tip: Interviewers want evidence of ownership. Always quantify the benefit of your initiative.
Describe a time when you had a conflict on a team. How did you resolve it?
Share the root cause of the conflict, your approach to resolution, and the final outcome. Emphasize empathy and active listening. Collaboration and culture fit are key Adobe values.
Example: In a cross-functional project, engineering wanted to prioritize speed while design insisted on more polish, creating delays. I facilitated a meeting where both sides presented trade-offs. Together, we agreed on a phased release: launch the MVP first, then iterate on design improvements. This compromise kept the timeline intact and satisfied both teams.
Tip: Show that you prioritize team goals over individual wins. Adobe values inclusive problem-solving.
How to Prepare for a Data Analyst Role at Adobe
Recreate a Creative Cloud Funnel with Public Data
Use publicly available datasets, such as Google Analytics sample data or Kaggle’s e-commerce clickstream data, to simulate Adobe’s funnel from signup → feature usage → conversion. Define key metrics like activation rate, DAU/WAU/MAU, and conversion rate, then layer retention logic to see how cohorts perform over time. This mirrors the Adobe data analyst experience of connecting user behavior with business outcomes.
Tip: Don’t just stop at the numbers. Visualize the funnel using Tableau or Python to practice stakeholder-ready storytelling. Here are 37 data analytics project ideas and datasets to help you build a portfolio and showcase your skills.
Drill 10 “Medium” Adobe SQL Interview Questions
Work through SQL problems involving joins, CTEs, and window functions since these are staples of Adobe’s technical screens. Aim for real-world style questions: ranking users, calculating rolling retention, or segmenting customers by activity. Practicing at this level of complexity will ensure you can confidently solve queries under time pressure.
Tip: After solving each problem, explain why your approach works out loud. This simulates the verbal reasoning you’ll need in Adobe interviews. If you want to practice more similar questions, here are 70 SQL scenario-based interview questions and answers to build your confidence.
Practice Timed Experiment Framing
Adobe values analysts who can explain A/B test design clearly and concisely. Time yourself to outline a full experiment in under five minutes: goal, hypothesis, success metric, and edge cases (e.g., seasonality, novelty effects). This sharpens your ability to handle product interviews where experiment framing often comes up unexpectedly.
Tip: Use the G-M-H-T framework (Goal → Metric → Hypothesis → Trade-offs) to stay structured when you’re under time pressure.
Record Mock Behavioral Interviews
Set up mock behavioral practice sessions focused on ambiguity, cross-functional collaboration, and inclusive decision-making. Recording your responses lets you analyze pacing, clarity, and whether you’re hitting the STAR structure consistently. This is especially useful for refining storytelling—something Adobe weighs heavily in cultural and values interviews.
Tip: After playback, ask yourself: “Would my story convince someone I’d thrive in Adobe’s collaborative, ambiguous environment?” If not, refine the narrative. You can schedule a mock interview on Interview Query to receive personalized feedback from professionals.
Learn the Required Data Analyst Skills
Beyond interview prep drills, dedicate structured time to mastering the core skill set expected of an Adobe data analyst. Start with SQL, focusing on joins, CTEs, window functions, and query optimization, since these form the backbone of Adobe’s technical screens. Build fluency in Python or R for statistical analysis and modeling, particularly A/B test evaluation, regression, and forecasting. Strengthen your data visualization skills in Tableau or Power BI, making sure you can turn raw data into dashboards that highlight actionable insights. Finally, sharpen business acumen by practicing metric definition, funnel breakdowns, and storytelling with data.
Tip: Treat learning as project-based, e.g., “use SQL to build a churn cohort table” or “visualize funnel drop-offs in Tableau.” Concrete mini-projects stick better than passive study. You can review the top 100+ data analyst interview questions to help you better prepare for the real interview.
FAQs
What Is the Average Adobe Data Analyst Salary?
The Adobe data analyst salary in the U.S. varies by level. Here’s the breakdown:
- Overall: The total pay range for a data analyst at Adobe is approximately $114K-$172K per year, with 81% of base pay, 6.2% of bonus, and 12.6% of stock.
- Senior analyst: The total compensation ranges from $121K to $174K per year.
Are there current job postings for Adobe data analyst roles?
Yes! See the latest openings and get insider tips from our Jobs Board. You will also see roles across top tech companies.
What does an Adobe data analyst do exactly?
An Adobe data analyst translates raw product and user data into insights that guide Creative Cloud and Experience Cloud strategies. Day to day, they write SQL queries, design dashboards, analyze A/B test results, and define metrics to track adoption or retention. They work closely with product managers, designers, and engineers to turn numbers into decisions.
Is a data analyst a high-paying job?
Yes. Data analysts are well-compensated, especially at major tech companies like Adobe. According to Glassdoor, U.S. data analysts at Adobe earn an average of $114K–$172K per year, depending on location and experience. Compensation often includes bonuses and learning stipends.
What is needed to become an Adobe data analyst?
Most Adobe data analyst roles require strong SQL, experience with Python or R for analysis, and skills in data visualization tools like Tableau or Power BI. A bachelor’s degree in analytics, statistics, computer science, or business is typical, though equivalent experience also counts. Beyond technical skills, Adobe values product intuition, experimentation knowledge, and clear storytelling. You can read about the data analyst career path to learn about how to prepare for your first data analyst job.
How to prepare for a data analyst technical interview at Adobe?
Preparation should cover SQL (joins, window functions, aggregations), statistics (hypothesis testing, experiment design), and product metrics. Practice with real datasets, simulate funnel analysis, and rehearse A/B test framing under time pressure. Adobe also values communication—practice explaining your reasoning clearly, not just writing correct code.
How to answer “Why should we hire you as a data analyst?”
The best approach is to connect your technical strengths with business impact. Frame your answer around three points: (1) your technical toolkit (SQL, Python, visualization), (2) your ability to translate data into actionable insights, and (3) your fit with Adobe’s mission of “Creativity for All.” A sample framing: “You should hire me because I can bridge technical analysis with business strategy: my SQL and A/B testing skills let me uncover insights, and my storytelling ensures teams act on them.”
Is the Adobe data analyst interview hard?
The interview is considered moderately challenging. Expect technical SQL questions, a product metrics case, and behavioral interviews focused on collaboration and ambiguity. Strong preparation in SQL and product sense significantly improves your chances.
Conclusion
Landing a role as an Adobe Data Analyst means mastering the core interview concepts: SQL fluency, experimentation design, stakeholder storytelling, and product intuition. With the right preparation, you can turn interviews into strategy conversations and showcase your ability to drive impact at scale.
Ready to practice? Start with our Adobe interview questions to drill real SQL and product cases that mirror the interview. Then explore our Adobe Data Engineer and Adobe Product Analyst guides for interview structure, tips, and sample answers to expand your prep.
Ready to tackle the interview? Schedule a 1-on-1 mock loop and get tailored coaching to refine your answers before the real loop.
Adobe Interview Questions
| Question | Topic | Difficulty |
|---|---|---|
Machine Learning | Medium | |
Let’s say that you work at a bank that wants to build a model to detect fraud on the platform. The bank wants to implement a text messaging service in addition that will text customers when the model detects a fraudulent transaction in order for the customer to approve or deny the transaction with a text response. How would we build this model? | ||
Data Structures & Algorithms | Medium | |
SQL | Medium | |
SQL | Easy | |
Machine Learning | Medium | |
Statistics | Medium | |
SQL | Hard | |
Machine Learning | Medium | |
Python | Easy | |
Deep Learning | Hard | |
SQL | Medium | |
Statistics | Easy | |
Machine Learning | Hard |
Discussion & Interview Experiences