

Breaking Down the Amazon BIE Interview


Introduction
Amazon’s data ecosystem has grown to unprecedented scale, powering more than $600 billion in annual revenue across retail, AWS, logistics, and advertising. Its systems generate billions of events per day, and every improvement in delivery speed, pricing, or customer experience depends on clean, reliable, and actionable data. Business intelligence engineers sit at the center of that engine.
If you are preparing for Amazon business intelligence engineer interview questions, this guide will show you exactly what to expect: the role, the interview process, the question types, and how to prepare effectively. Use it as your roadmap to stand out in one of the most data-driven environments in the world.
What does an Amazon business intelligence engineer do?
Amazon business intelligence engineers turn complex, fragmented data into insights that drive decisions across the company. They build the pipelines, models, and dashboards that teams rely on, while ensuring Amazon’s operational metrics remain accurate, explainable, and scalable.
Core responsibilities include:
- Designing Redshift and Athena data models that support large-scale analytics.
- Writing complex SQL to validate data, automate reporting, and support experiments.
- Building dashboards that track delivery metrics, financial performance, or product health.
- Developing and maintaining ETL pipelines for batch or near real-time processing.
- Investigating anomalies and resolving root causes across upstream and downstream systems.
- Partnering with product, data science, operations, and finance teams to define KPIs and influence decisions.
- Ensuring data accuracy through documentation, quality checks, and consistency standards.
A strong Amazon BIE does more than write queries. They provide clarity in ambiguous situations, challenge flawed metrics, and use data to influence decisions that directly impact customers and global operations.
Why this role at Amazon
The business intelligence engineer role at Amazon gives you a rare combination of scale, ownership, and impact. You work on datasets that reflect billions of customer interactions, shape the metrics that leadership uses to run the business, and partner with teams across retail, logistics, and AWS. It is an ideal role for someone who wants deep technical work, clear business influence, and meaningful career growth in one of the most data-driven companies in the world.
Amazon Business Intelligence Engineer Interview Process
The Amazon business intelligence engineer interview process evaluates how you think with data, communicate with stakeholders, and embody Amazon’s Leadership Principles. It is not only a SQL test. Each stage is designed to probe different aspects of your skills: technical depth, product sense, ownership, and judgment under ambiguity.
Recruiter screen
After your application is reviewed or you are contacted by a recruiter, you will complete a 30–40 minute phone or video screen. This is the first filter for experience, motivation, and overall fit.
The recruiter will review your background, why you want to join Amazon, and how your past work aligns with Business Intelligence Engineer responsibilities. Expect light probing on your SQL comfort level and several behavioral questions grounded in Amazon’s Leadership Principles, such as Customer Obsession, Ownership, and Bias for Action.
This stage tests
- Alignment between your experience and BIE responsibilities
- Clarity on why Amazon and why the BIE role specifically
- Ability to communicate impact clearly and concisely
- Baseline alignment with Amazon’s Leadership Principles
Tip: Prepare concise, metrics-driven stories for your core roles and a clear answer to “Why Amazon, and why BIE?” Tie each example explicitly to at least one Leadership Principle.
Online assessment
For many BIE roles, the next step is an online assessment focused primarily on SQL. The format typically includes several timed SQL questions of increasing difficulty in a HackerRank-style environment, with some roles also including light Python or scripting-based data manipulation.
You will write and debug queries against realistic schemas, covering joins, filtering, aggregations, and window functions. The platform usually provides sample test cases and immediate feedback on correctness.
What Amazon looks for
| Skill area | Evaluation focus |
|---|---|
| SQL fundamentals | Joins, aggregations, filtering, window functions |
| Query correctness | Accurate logic and edge case handling |
| Data intuition | Reasonable assumptions on imperfect data |
| Speed and focus | Working efficiently under time constraints |
Tip: Practice SQL under timed conditions and validate your logic with small test cases. Favor clear, readable queries and use CTEs instead of deeply nested subqueries.
Technical phone screen
Candidates who pass the online assessment typically move to one or two technical phone screens, each lasting 45–60 minutes over Amazon Chime. These interviews blend live SQL exercises with behavioral discussion rather than separating technical and behavioral sections.
You will usually share your screen, write SQL in a shared editor, and explain your reasoning as you go. Questions often involve joins, aggregations, window functions, and debugging existing queries. Interviewers also ask about past projects, how you handled ambiguous data problems, and how you worked with stakeholders.
This stage tests
- Ability to write correct SQL under light time pressure
- Comfort interpreting intermediate results and debugging logic
- Clarity when explaining assumptions and trade-offs
- Real-world application of Leadership Principles in past work
Tip: Think aloud throughout the exercise. Restate the problem, outline your approach, and confirm assumptions before writing code. Follow-up questions are often signals to dive deeper, not indications you are off track.
On-site or virtual interview loop
The final loop typically consists of four to five back-to-back interviews, each lasting 45–60 minutes. Some candidates reported completing as many as six to seven total interviews across the full process. You will meet BIEs, data scientists, product managers, and at least one Bar Raiser.
Behavioral and technical questions are often mixed within the same session rather than isolated into separate rounds. The exact structure varies by team, but SQL is consistently evaluated and treated as a non-negotiable skill across BI and data roles.
You can expect coverage across three core areas.
SQL and data manipulation You will write queries against realistic schemas such as orders, sessions, or fulfillment data. Interviewers may ask you to reason about performance, optimize an existing query, or explain trade-offs in your approach. Tip: Explain why you choose specific joins, filters, or window functions. When discussing optimization, focus on query structure, indexing concepts, and data volume assumptions.
Data modeling, ETL, or dashboard design You may be asked to design a reporting model, outline an ETL pipeline, or critique an existing dashboard. Some loops include case studies or visualization exercises that test how you interpret charts and propose better metrics. Tip: Start from the business question. Clearly state the grain of your data, key dimensions, and how the output will be used by stakeholders.
Behavioral and business insight These interviews focus on how you use data to drive decisions, handle ownership during failures, and communicate insights. Expect deep dives into a small number of projects. Tip: Use structured responses and quantify impact whenever possible. Explicitly connect each story to Leadership Principles such as Dive Deep, Deliver Results, and Earn Trust.
Bar raiser interview
One interview in the loop is conducted by a Bar Raiser, a trained interviewer from outside the immediate team. Their role is to assess whether you raise the hiring bar for Amazon overall, not just whether you fit a specific team.
This interview often blends technical and behavioral questions, with strong emphasis on decision-making, handling ambiguity, and learning from failure. Expect probing follow-ups and scenario variations.
What Bar Raisers emphasize
| Area | What they assess |
|---|---|
| Judgment | Balancing speed, quality, and customer impact |
| Ownership | Responses when systems fail or metrics look wrong |
| Depth | How well you understand trade-offs in past work |
| Consistency | Alignment with Leadership Principles across stories |
Tip: Be specific and honest. If you do not know something, explain how you would approach finding the answer. Bar Raisers care deeply about reasoning, self-awareness, and long-term judgment.
Differences by level
While the interview structure is broadly similar, expectations increase with seniority.
Entry-level or new-grad BIEs Interviews emphasize SQL fundamentals, clear thinking with clean datasets, and the ability to learn quickly. Candidates are expected to write correct queries, interpret basic metrics, and communicate clearly.
Mid-level BIEs Candidates are expected to work with messier data, design stable reporting models, and own dashboards or pipelines within a domain. Interviewers look for examples of pushing back on flawed metrics and influencing decisions with data.
Senior BIEs Interviews focus on end-to-end ownership, long-term metric strategy, and cross-functional leadership. Strong candidates discuss designing foundational datasets, standardizing KPIs, mentoring others, and driving large initiatives with ambiguous scope.
Tip: Match your examples to the level you are targeting. Senior candidates should focus on multi-quarter impact and cross-team alignment rather than isolated analyses or one-off dashboards.
Challenge
Check your skills...
How prepared are you for working as a Business Intelligence at Amazon?
Amazon Business Intelligence Engineer Interview Questions
Amazon BIE interview questions test how you work with data end-to-end: querying, modeling, defining metrics, and communicating insights to non-technical partners. You will see a mix of SQL exercises, design and metrics prompts, and behavioral questions tied to Leadership Principles. At a high level, questions fall into four categories: SQL and data manipulation, data modeling and ETL design, metric definition and insights, and behavioral and leadership.
SQL and data manipulation interview questions
SQL is the backbone of the BIE role at Amazon. You will be asked to write queries on the spot, reason about performance, and explain your logic clearly. Questions often use schemas that resemble Amazon’s domains, such as orders, shipments, user sessions, and experiments.
-
You can solve this by grouping employees by department, counting total employees and those with salary over 100K, computing the percentage, and ranking departments by that percentage. Use
HAVINGto filter departments with at least ten employees, and a window function likeDENSE_RANK()to rank by the high-earner percentage.Tip: In your explanation, highlight how window functions let you rank rows without losing detail, and mention that you would typically pre-aggregate large tables to keep the query performant.
Given a slow-running query on a 100 million row table in Redshift, how would you diagnose and optimize it?
Start by inspecting the query plan with
EXPLAINandSVL_QUERY_REPORTto see where time is spent. Check whether distribution and sort keys are aligned with your joins and filters, look for unnecessary large scans or cross joins, and see if predicates can be pushed earlier. You might improve performance by changingDISTKEY/SORTKEY, adding selective filters sooner, using result caching, or refactoring into staged CTEs or temp tables.Tip: Do not jump straight to adding hardware; Amazon expects BIEs to optimize logically first. Talk through both immediate fixes (query rewrite) and longer-term improvements (schema or key design).
Calculate the first touch attribution for each
user_idthat converted.To compute first-touch attribution, join the
user_sessionstable with anattributionoreventstable, filter to sessions that led to conversions, and then find the earliest session peruser_id. The channel or source of that earliest session becomes the first-touch channel for that converting user.Tip: Mention how you would handle ties or missing timestamps and how you might materialize the result into a dimension table for repeated use in dashboards.
Write a query to get the number of customers that were upsold.
You can define an “upsold customer” as a user who made multiple purchases over time or upgraded to a higher-priced product. Group transactions by
user_id, count distinct purchase dates or product tiers, and filter to users who meet your upsell criteria. Then return the count of these users.Tip: Be explicit about your upsell definition and connect it to business logic, such as moving from a basic to premium plan or increasing average order value.
Write a SQL query to find the average number of right swipes for different ranking algorithms.
Join the
swipestable with avariantsor experiment table that contains ranking algorithm labels. Filter to users with at least a minimum number of swipes (for reliable estimates), group by algorithm variant and any relevant thresholds, and compute the average of a binaryis_right_swipeflag or the ratio of right swipes to total swipes.Tip: Explain how you would guard against small-sample noise, for example by requiring at least N users per variant or using confidence intervals when reporting results.
-
This question tests your ability to combine deduplication logic with window functions in SQL. Interviewers look for correct partitioning and ordering, as well as a clear explanation of why your approach removes duplicates before ranking.
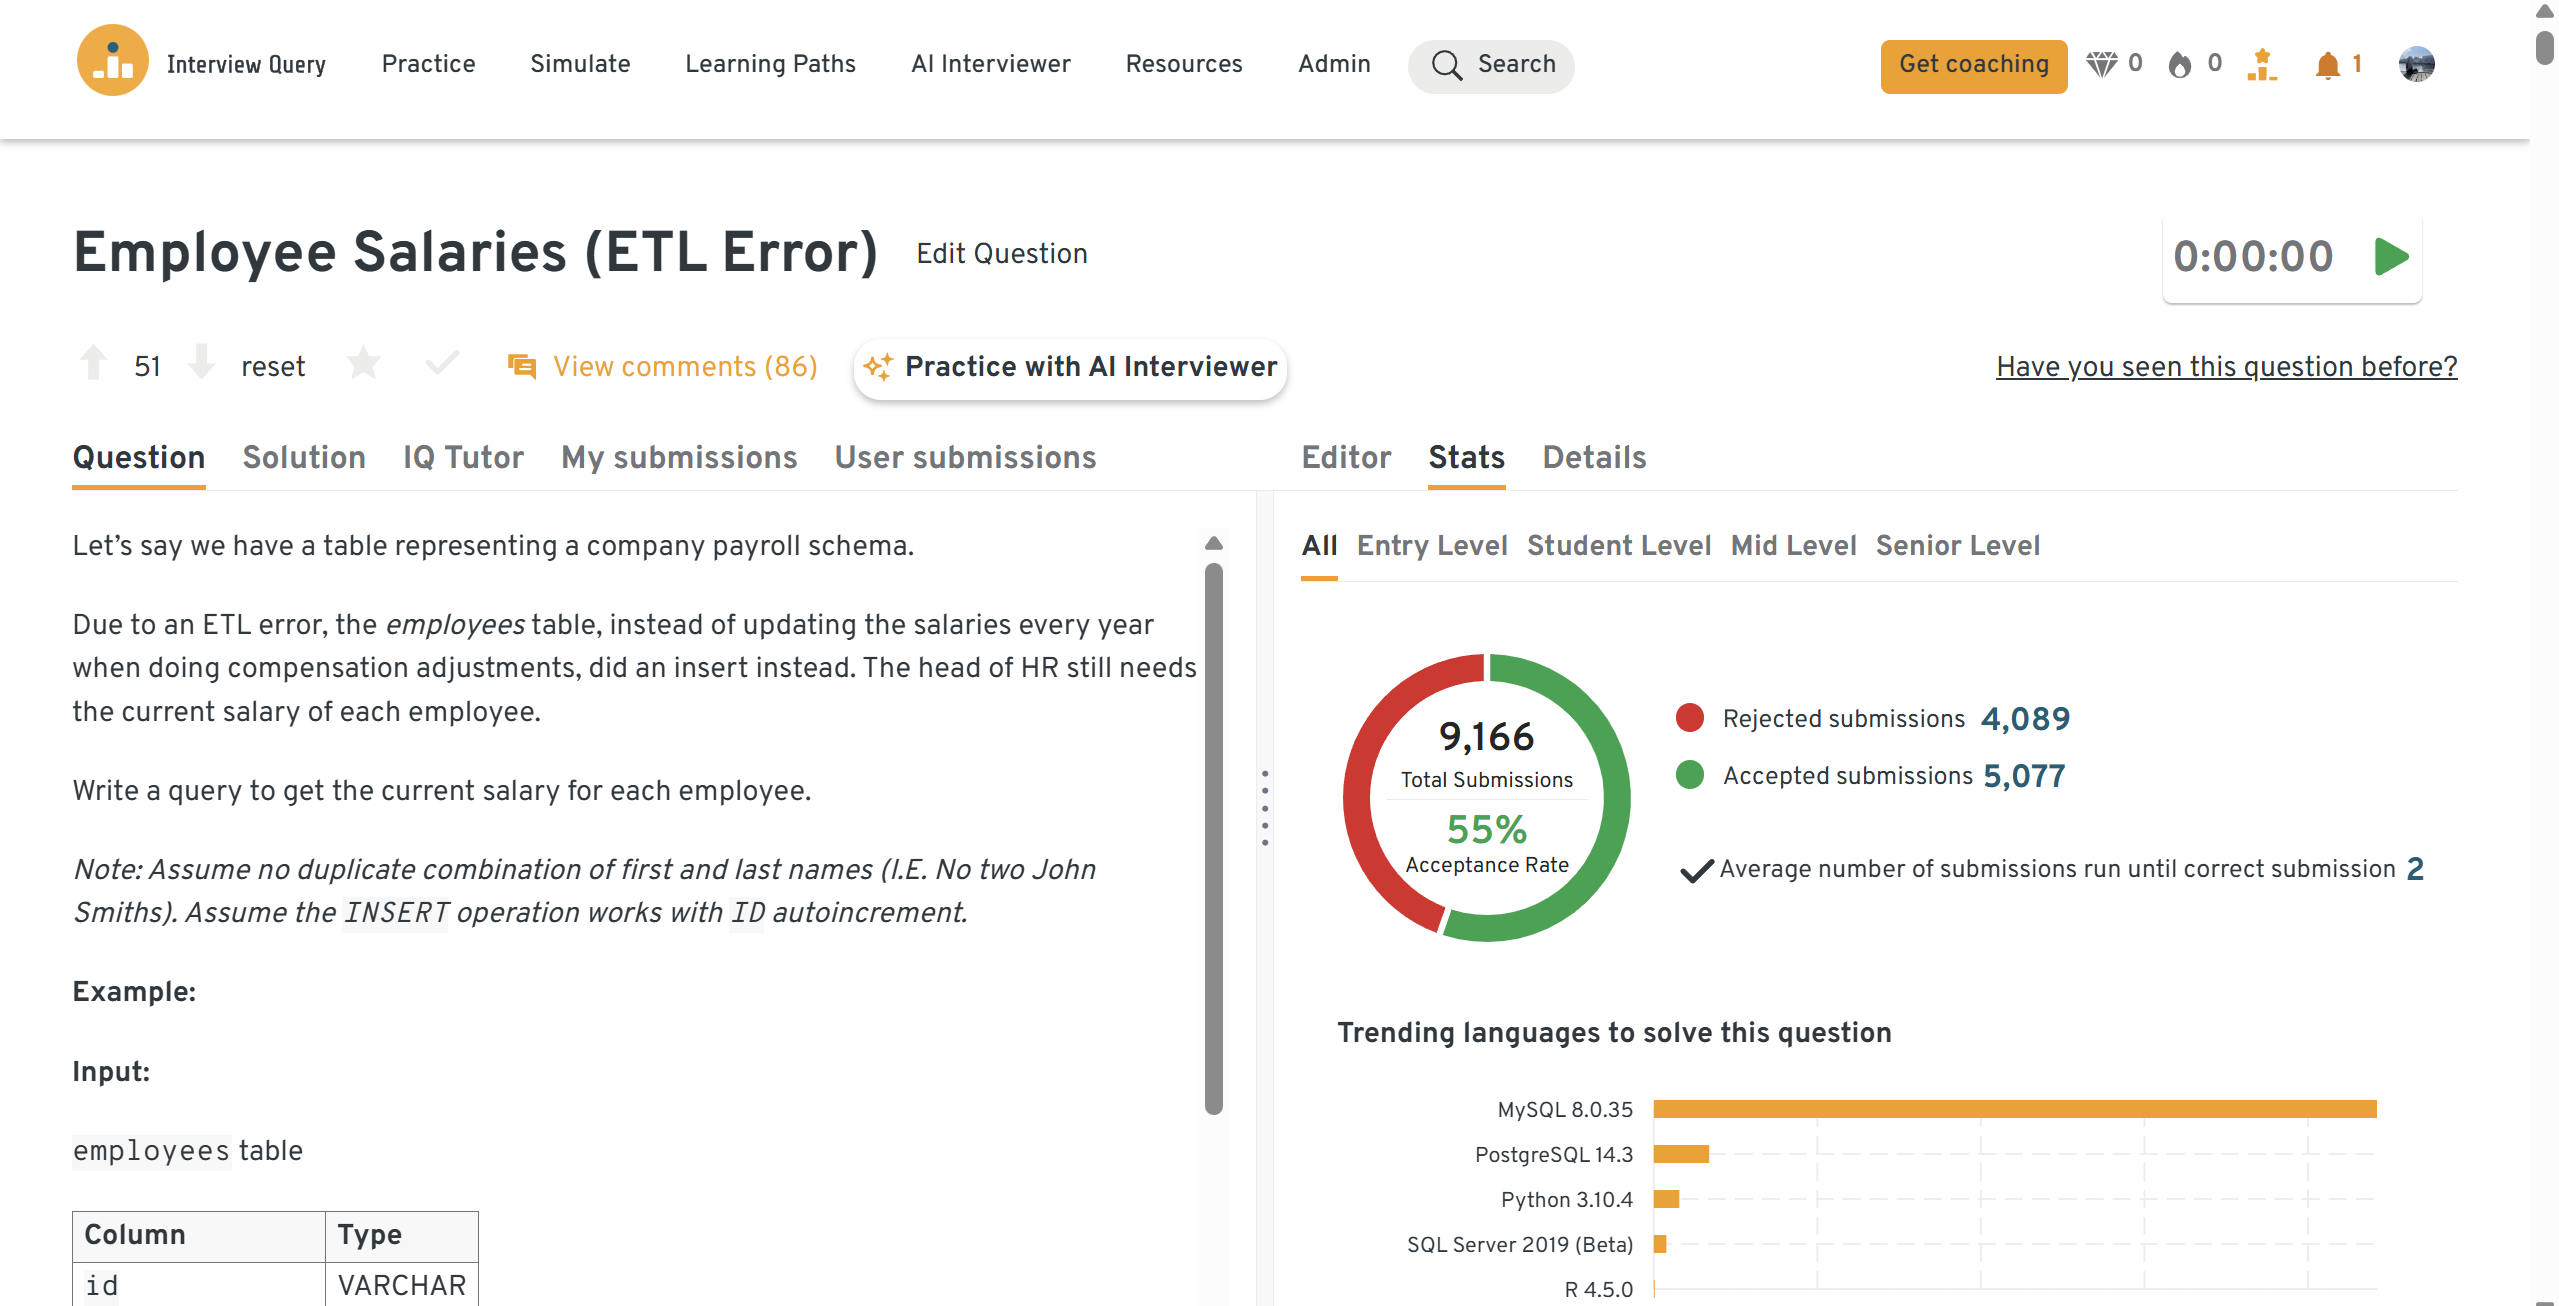
Write a query to get the current salary for each employee after an ETL error.
After an ETL issue that inserted duplicate records, you can recover current salaries by selecting, for each employee, the record with the latest effective date or the highest surrogate key. Use a window function like
ROW_NUMBER()partitioned by employee and ordered byupdated_atoriddescending, then filter to the first row per partition.Tip: Use this question to talk about defensive design: how you would add uniqueness constraints, checks, or audit tables to catch similar ETL issues earlier.
You can practice this exact problem on the Interview Query dashboard, shown below. The platform lets you write and test SQL queries, view accepted solutions, and compare your performance with thousands of other learners. Features like AI coaching, submission stats, and language breakdowns help you identify areas to improve and prepare more effectively for data interviews at scale.
Data modeling and ETL design interview questions
BIEs at Amazon do not only consume data; they help shape the schemas and pipelines that make data usable. Expect questions about schema design, partitioning, SCDs, and how you would handle late-arriving or bad data in production systems.
How would you design a reporting data model for delivery times across cities and fulfillment centers?
Start by defining a fact table at the right grain, such as one row per shipment or per package with timestamps for shipped, out-for-delivery, and delivered events. Add dimensions for city, fulfillment center, carrier, customer segment, and product category. You should discuss how you would partition by date, index common filters (like shipped date or fulfillment center), and support both daily aggregates and drill-down.
Tip: Explicitly state your chosen grain and why it works. Grain confusion is a common source of metric bugs, and Amazon interviewers want to see that you prevent it from the start.
Design a reliable ETL pipeline to ingest and transform Stripe transaction data.
Outline an ingestion layer (e.g., pulling data from Stripe’s API into S3), a transformation layer (using Glue or Spark to standardize schemas, currencies, and time zones), and a loading layer (writing into Redshift fact and dimension tables). Emphasize idempotent loads, deduplication, schema evolution handling, and monitoring for missing or delayed files.
Tip: Walk through how you would detect and recover from partial failures, such as a missing partition or malformed file, without corrupting downstream tables.
Design a data model to track customer churn. What dimensions and facts would you include, and how would you support both daily tracking and monthly cohorting?
You might build a subscription or customer lifecycle fact table keyed by
customer_idand time, with flags for active, churned, and reactivated states. Dimensions can include plan type, acquisition channel, geography, and device. For daily tracking, you would compute active and churn counts per day; for cohorts, you would storesignup_monthorcohort_idand aggregate churn by cohort over time.Tip: Mention how you would implement slowly changing dimensions (for plan changes or region moves) and how you would keep historical metrics consistent even as definitions evolve.
Explain how you would design a data pipeline that detects anomalies in real time.
Describe a streaming architecture where events flow through Kinesis or Kafka into a processing layer (e.g., Kinesis Data Analytics, Flink, or Spark Streaming), which computes rolling aggregates and anomaly scores. Alerts can be sent to CloudWatch or an incident system when metrics deviate from thresholds or statistical baselines.
Tip: Talk about handling out-of-order events, setting sensible alert thresholds, and avoiding alert fatigue by batching or grouping related anomalies.
How would you handle late-arriving events in a daily data pipeline that reports on order fulfillment status?
Define what “late” means in your context (for example, events arriving after the daily batch has run). You can address this by using watermarking, keeping a rolling window of days open for updates, and designing pipelines to upsert into partitioned tables rather than append-only loads. For significantly late events, you might maintain a correction process and mark downstream reports as restated.
Tip: Emphasize transparency: explain how you would flag dashboards as partial or updated when late data arrives, and how you would communicate this behavior to stakeholders.
Metric definition and insights interview questions
Amazon expects BIEs to translate ambiguous business questions into clear, measurable metrics and to use those metrics to drive decisions. You will be asked about defining north star metrics, designing dashboards, and analyzing A/B test results.
How would you define a north star metric for a new Amazon Prime feature?
Begin by clarifying the goal of the feature (e.g., increasing engagement, retention, or basket size) and then propose a primary metric that directly reflects customer value, such as incremental Prime usage days or uplift in repeat orders among exposed users. Support this with guardrail metrics for customer experience, such as refund rate or support contacts.
Tip: Show that you are aware of metric gaming; explain how you would prevent a team from optimizing the north star at the expense of overall customer trust or long-term retention.
How do you analyze the results of an A/B test that shows mixed signals across segments?
Start by validating the experiment setup and overall significance, then slice results by key dimensions like geography, device, or tenure. Identify where uplift is positive or negative and consider potential confounders such as seasonality or uneven traffic allocation. Your recommendation might be to iterate for specific segments, roll back, or run a follow-up test with tightened hypotheses.
Tip: Keep the narrative clear: summarize results in one sentence before diving into details, and always end with a concrete recommendation rather than just observations.
Design a KPI dashboard to track conversion funnels across multiple Amazon storefronts.
Outline the main funnel stages (impressions, clicks, product views, add-to-cart, purchase) and define metrics for each stage, segmented by storefront, device, and traffic source. Your dashboard should highlight drop-off points, trends over time, and comparisons across regions. Discuss data freshness, latency, and how non-technical users will interact with filters and breakdowns.
Tip: Mention that you would include both a high-level executive view and drill-down capabilities, so different stakeholders can use the same source of truth at different levels of detail.
How would you define and track the delivery accuracy metric for Amazon Logistics, considering on-time, early, and delayed deliveries?
Define delivery accuracy as the percentage of packages delivered within the promised window, while separately tracking early and late deliveries. Use event timestamps and promised delivery windows to classify each delivery, then aggregate by region, carrier, and product type. Discuss how you would handle rescheduled deliveries, failed attempts, or partial shipments.
Tip: Connect this metric back to customer outcomes, such as contact rates, negative reviews, or repeat purchase behavior, to show you understand why the KPI matters.
How would you identify the highest and lowest performers based on aggregated metrics?
This question evaluates your understanding of grouped aggregations and ranking logic. Interviewers pay close attention to how you handle ties, null values, and explain the reasoning behind your aggregation choices.
If a key business metric suddenly drops, how would you investigate the cause?
This question assesses your analytical thinking and problem decomposition skills. Interviewers expect a structured, data-driven approach that defines the metric clearly and prioritizes plausible segments or dimensions to investigate.
How would you design and interpret an A/B test for a proposed product change?
This question tests your ability to think through experiment design in a product context. Interviewers focus on hypothesis formulation, metric selection, and how you would interpret results to inform a decision.
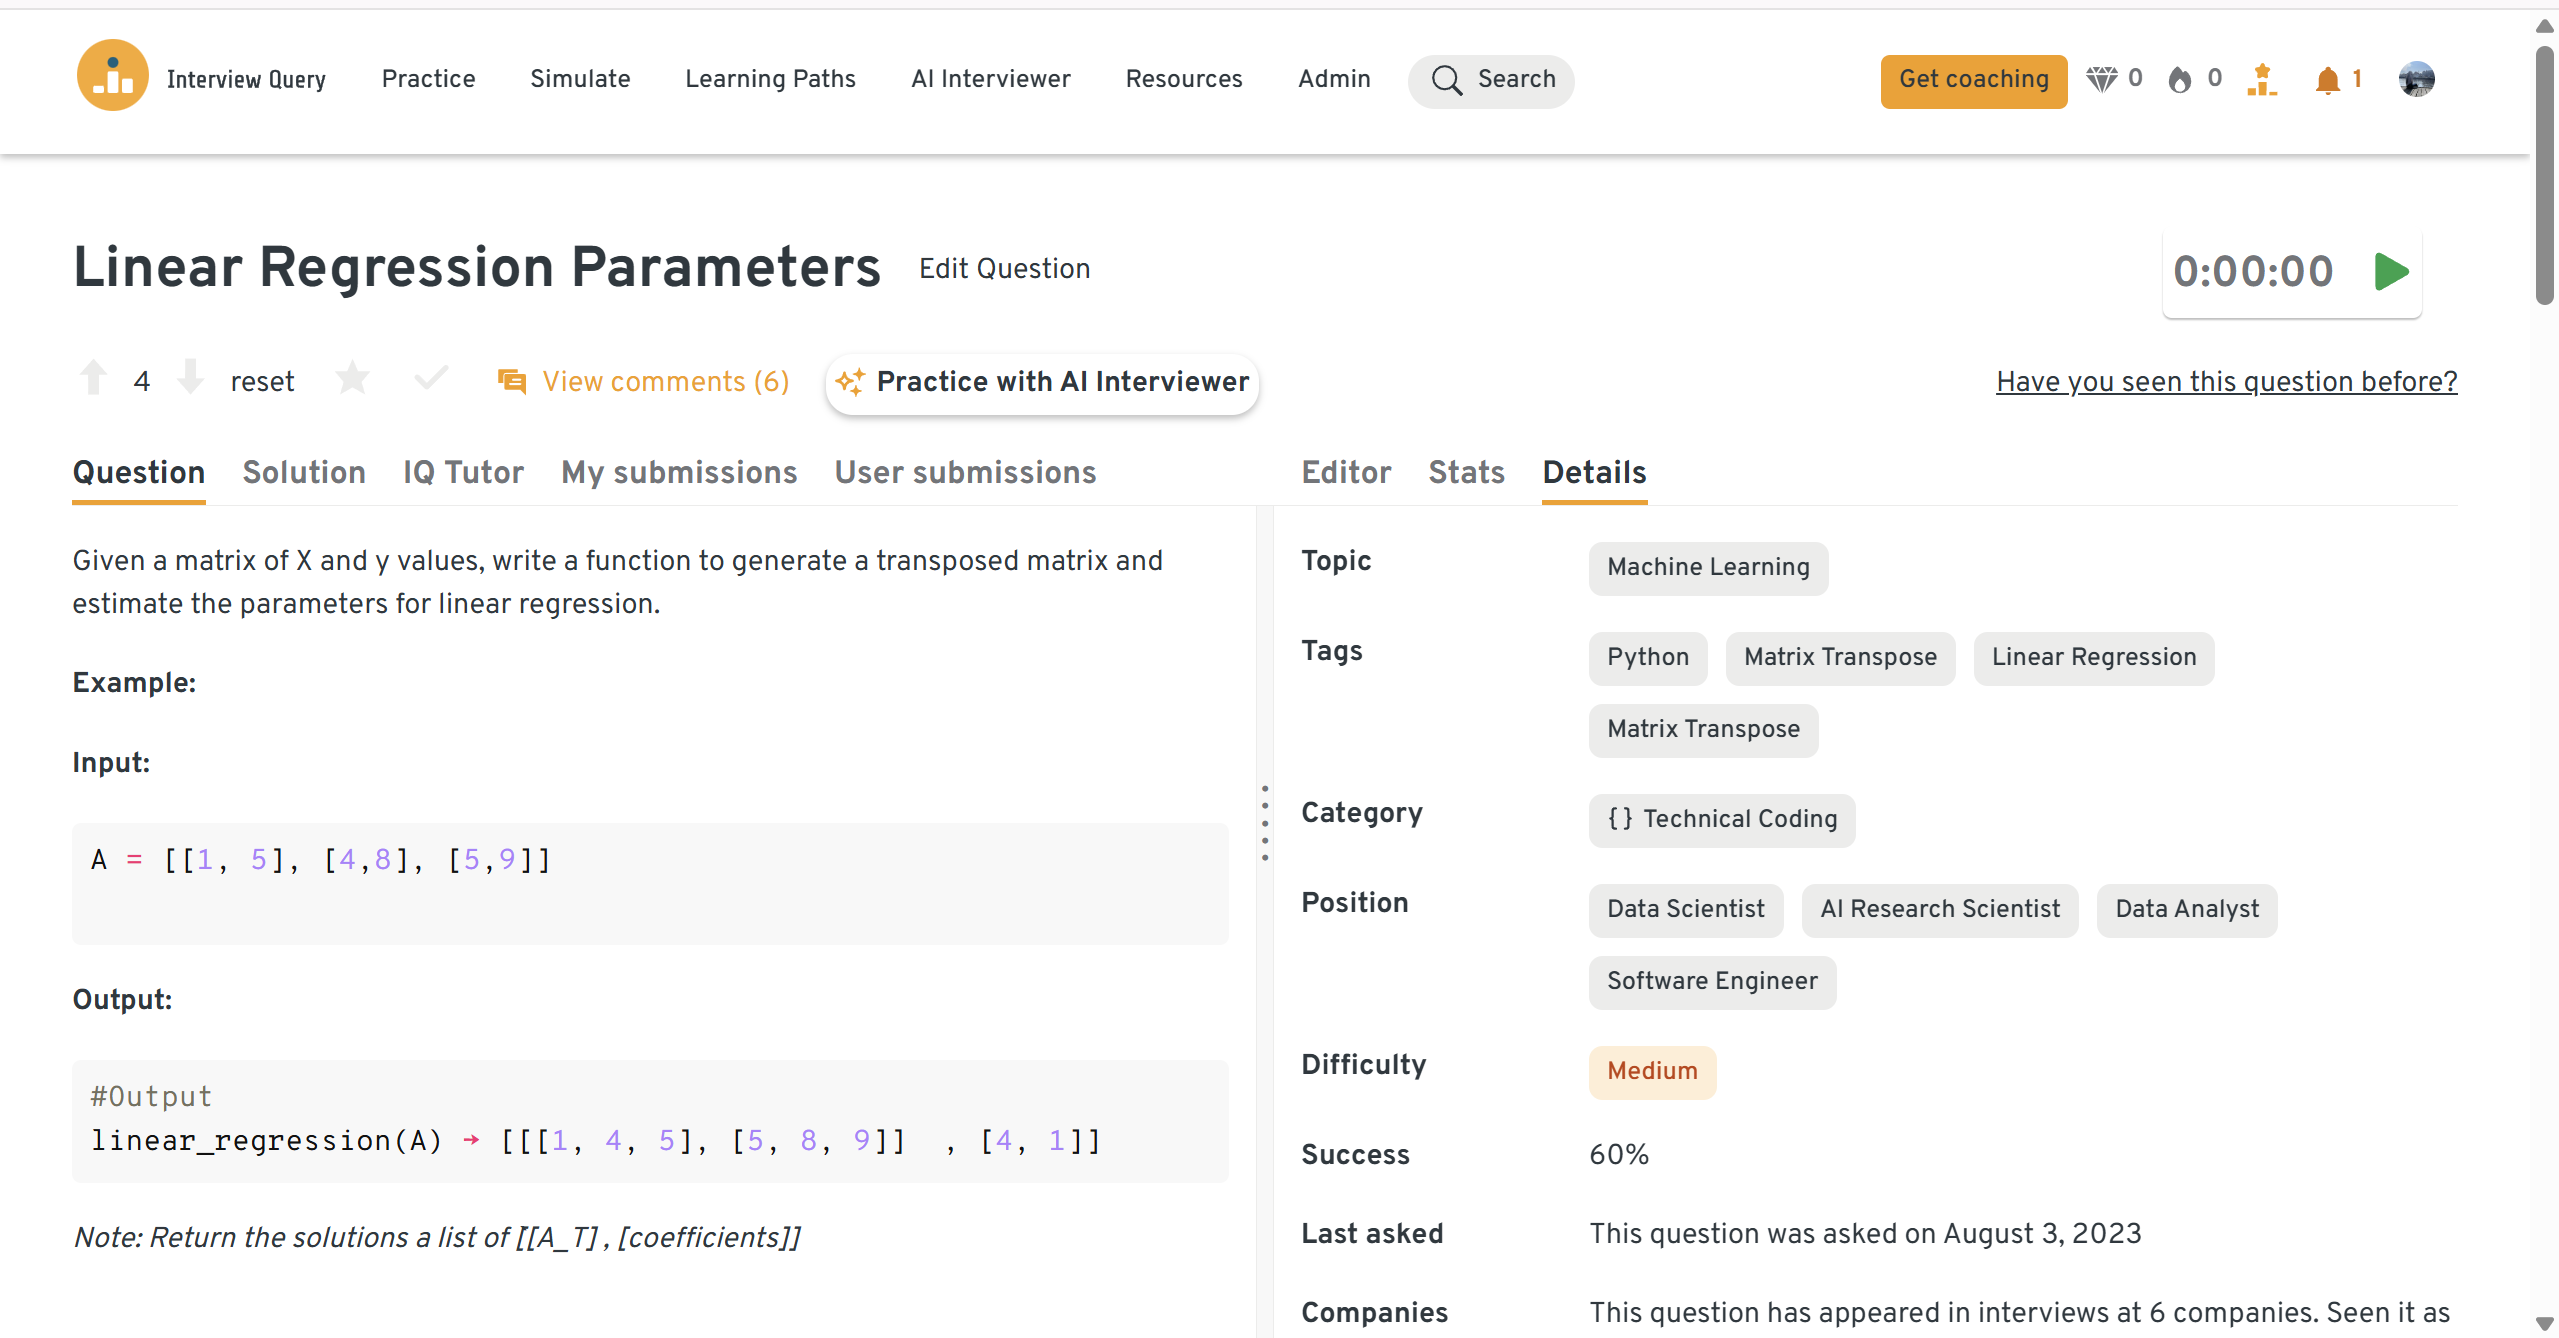
Explain how you would measure the impact of a new recommendation algorithm on user engagement.
Propose an experiment comparing users exposed to the new algorithm versus a control group, using engagement metrics such as click-through rate, session length, items per order, and long-term retention. Address how you would control for confounders, ensure sufficient sample size, and interpret cases where some metrics improve while others decline.
Tip: Show that you understand business trade-offs: for example, an algorithm that increases clicks but hurts long-term satisfaction may not be a win.
You can practice this question on Interview Query, where you can test SQL, see accepted answers, and get AI-powered feedback on your performance.
Behavioral and leadership principle interview questions
Behavioral interviews are where you demonstrate that you think and act like an Amazon leader. Every question maps to one or more Amazon Leadership Principles, and interviewers expect structured, measurable stories that show how you responded to real challenges.
How do you resolve conflicts with others during work?
Interviewers are looking for your ability to Earn Trust, Dive Deep, and Deliver Results even when disagreements arise. A strong answer shows how you listen to others’ perspectives, use data to depersonalize the discussion, and work toward a solution that serves the customer or business.
Sample answer:
In a prior role, a product manager and I disagreed on whether to launch a feature based on early A/B test data. Rather than arguing from intuition, I walked through the experiment setup, confidence intervals, and potential risks of false positives. We agreed to extend the test and add a few guardrail metrics around customer complaints. The extended analysis showed no meaningful uplift, so we pivoted the roadmap to more promising ideas. This approach preserved our relationship and helped us make a more defensible decision.
Tip: When describing conflict, avoid blaming others. Focus on your behavior, what you learned, and how the team outcome improved.
-
This question tests Ownership and Bias for Action. Amazon wants to see how you weigh impact, urgency, and risk while keeping stakeholders informed. Your answer should describe a framework for prioritization, such as impact vs. effort or customer impact vs. internal needs, and tools you use to stay organized.
Sample answer:
When supporting both weekly executive dashboards and ad hoc deep dives, I created a simple matrix that ranked tasks by business impact and time sensitivity. I scheduled recurring time blocks for critical BAU reports, then slotted deep dives and experiments around those anchors. I also sent a short weekly update to stakeholders outlining priorities and timelines. This helped me deliver on all critical commitments while making trade-offs visible and agreed upon.
Tip: Include at least one example where you said “no” or negotiated scope to protect quality and avoid overcommitment.
-
Here, interviewers look for Have Backbone; Disagree and Commit. They want to see that you can challenge decisions respectfully, support your view with data, and commit once a direction is chosen.
Sample answer:
On a pricing project, I recommended a more conservative rollout based on elasticity estimates, but some stakeholders preferred an aggressive increase. I presented scenario analyses showing potential churn in our most price-sensitive segments and proposed a phased experiment by market. After discussion, we agreed to test both strategies in different regions. The conservative rollout retained more customers while still hitting revenue targets, so the broader rollout followed that pattern. Once the decision was made, I fully supported communication and implementation, even for parts that did not follow my initial proposal.
Tip: End with what you learned about influencing without authority, not just how you “won” the argument.
Tell me about a time when you exceeded expectations during a project. What did you do, and how did you accomplish it?
This probes Insist on the Highest Standards and Deliver Results. Your story should show that you did more than the bare minimum, such as automating a manual process, uncovering a deeper insight, or standardizing a metric across teams.
Sample answer:
I was initially asked to build a monthly revenue report for a single business unit. Instead of a one-off dashboard, I designed a reusable data model that standardized revenue definitions across three units and automated the refresh process. This reduced manual reporting time by about 20 hours per month and improved consistency in executive reviews. Leadership later adopted the model as the default source of truth for quarterly planning.
Tip: Always quantify the lift you delivered (time saved, errors reduced, revenue impact) to make your story concrete.
Tell me about a time you discovered a major data discrepancy that impacted a business decision. How did you handle it?
This question examines Ownership, Dive Deep, and Earn Trust. Amazon wants to see that you treat data quality issues as urgent, communicate clearly about risk, and implement long-term fixes.
Sample answer:
While validating a new marketing dashboard, I noticed that conversion numbers were 15% higher than our finance reports. I traced the discrepancy to a missing filter on test traffic and paused the dashboard rollout while I investigated. After confirming the root cause with engineering, I fixed the logic, added automated QA checks, and documented the correct metric definition. I also briefed stakeholders on the issue and its impact. As a result, we avoided using inflated metrics in an upcoming campaign review and strengthened our QA process for future dashboards.
Tip: Highlight both the immediate mitigation and the preventive measures you put in place. Interviewers care about how you avoid repeating the same problem.
How to Prepare for an Amazon Business Intelligence Engineer Role
Preparing for the Amazon BIE interview means building strong SQL fundamentals, sharpening your analytical storytelling, and aligning your examples with Amazon’s culture.
Master SQL with a focus on readability and scale
Prioritize joins, CTEs, window functions, and date functions like
DATE_TRUNC, and practice writing queries that would run on large Redshift tables. Use Interview Query’s BIE-tagged SQL questions and the SQL cheat sheet to drill common patterns and edge cases.Tip: Simulate the OA and phone screens by solving problems in 30–45 minute blocks and explaining your logic out loud.
Build comfort with data modeling and ETL concepts
Review fact/dimension modeling, star vs. snowflake schemas, and basic ETL design on AWS (S3, Glue, Redshift). Focus on how you would ensure data quality, handle late-arriving data, and support both daily aggregates and deep dives.
Tip: Take a couple of your past projects and rewrite how you would explain the data model and pipeline in a diagram and a one-minute verbal summary.
Develop strong metric and experimentation instincts
Practice defining north star metrics, supporting KPIs, and guardrails for common Amazon use cases like Prime, search, and logistics. Review how to interpret A/B tests, segment results, and recommend next steps when results are ambiguous.
Tip: Use questions from Interview Query’s product and metrics sets to practice turning vague product prompts into precise metrics and dashboard designs.
Rehearse your Leadership Principles stories in STAR format
Prepare 6–8 stories covering themes like owning incidents, challenging decisions, working with difficult stakeholders, and improving a process. Align each story to one or two Leadership Principles and include measurable results. You can use resources like the Amazon STAR method guide to structure your answers.
Tip: Record yourself answering two or three behavioral questions in a row and refine your pacing to keep answers within 2–3 minutes.
Simulate the full interview loop with mock practice
Combine SQL practice, case-style design questions, and behavioral prep in one session to mimic the real loop. Use Mock Interviews or AI Interviews to get feedback on both content and delivery.
Tip: After each mock session, write down one technical gap and one communication habit to improve, then focus your next week of prep on those two items.
Tailor your prep to specific BIE domains at Amazon
BIE roles in Operations, Retail, AWS, or newer teams like Alexa and Kindle can look slightly different in focus. Research the team’s domain, skim recent Amazon announcements, and think about metrics and data problems that matter there.
Tip: Prepare one domain-specific case story or metric proposal for the area you are targeting, so you can demonstrate both general BIE strength and contextual understanding.
Average Amazon Business Intelligence Engineer Salary
Amazon Business Intelligence Engineers earn competitive compensation driven by level, location, and team. According to Levels.fyi, total compensation in the U.S. typically ranges from $144K per year at L4 to $228K per year at L6, with a nationwide median around $181K.
| Level | Total / Year | Base / Year | Stock / Year | Bonus / Year | Source |
|---|---|---|---|---|---|
| L4 – BIE I | ~=$144K | ~$108K | ~$21.6K | ~$7.9K | Levels.fyi |
| L5 – BIE II | ~$168K | ~$132K | ~$33.6K | ~$2.7K | Levels.fyi |
| L6 – Senior BIE | ~$228K | ~$144K | ~$72K | ~$2.9K | Levels.fyi |
Amazon’s equity vests 5%/15%/40%/40%, so stock value increases significantly after year two.
Regional salary comparison
Below is a consolidated table showing regional compensation for Amazon BIEs based on the screenshots.
| Region | Salary Range (Annual Total Comp) | Notes | Source |
|---|---|---|---|
| United States (overall) | $144K – $228K | Based on L4–L6 national averages; median ~$181K. | Levels.fyi |
| Greater Seattle Area | $120K – $216K | Core Amazon hub; highest volume of BIE openings. | Levels.fyi – Seattle |
| New York City Area | $162K – $173K | Narrower band; concentrated in Ads, Prime Video, Corporate BI. | Levels.fyi – NYC |
| Greater Austin Area | ~$144K (L5) | Limited data; most roles reported at L5 level. | Levels.fyi – Austin |
Average Base Salary
Average Total Compensation
The key takeaway: compensation climbs quickly with seniority. Moving from L4 to L6 nearly doubles total compensation, largely driven by increased equity. For candidates, this means the real financial upside comes from leveling correctly and growing within the company. If you’re aiming for long-term career growth, Amazon’s BIE track offers both strong starting pay and meaningful acceleration as you take on more ownership.
FAQs
How competitive is the Amazon BIE interview?
The BIE interview is competitive because it attracts candidates from data analytics, BI, and data engineering backgrounds. Amazon screens heavily on SQL, metrics intuition, and Leadership Principles, so strong candidates have both hands-on technical depth and clear examples of driving decisions with data. Treat it like a top-tier tech interview rather than a generic analyst screen.
Is SQL mandatory for all Amazon BI Engineer interviews?
Based on recent candidate experiences, SQL is consistently evaluated across teams and is treated as a core requirement. While interview structure may vary by organization or team, candidates should expect SQL questions at a medium to hard difficulty level in nearly every BI or data-focused interview.
Build the Insights That Power Amazon’s Decisions
Becoming a Business Intelligence Engineer at Amazon means owning the metrics, dashboards, and analyses that shape how one of the world’s biggest companies runs. Every query you write, every KPI you define, and every experiment you interpret has a direct line to decisions about pricing, logistics, Prime benefits, and product launches. It is a role for people who love both the craft of SQL and the challenge of influencing high-stakes decisions with data.
If you are serious about landing the offer, turn your prep into a system. Work through BIE-tagged questions on the Interview Query dashboard, follow the data analytics or data engineering learning paths to close skill gaps, and schedule a mock interview to stress-test your stories. With focused practice on SQL, metrics, and Leadership Principles, you can walk into the Amazon BIE interview ready to show that you can own the data behind critical business decisions.
Amazon Interview Questions
| Question | Topic | Difficulty |
|---|---|---|
Brainteasers | Medium | |
When an interviewer asks a question along the lines of:
How would you respond? | ||
Brainteasers | Easy | |
Analytics | Medium | |
SQL | Easy | |
Machine Learning | Medium | |
Statistics | Medium | |
SQL | Hard | |
Machine Learning | Medium | |
Python | Easy | |
Deep Learning | Hard | |
SQL | Medium | |
Statistics | Easy | |
Machine Learning | Hard |
Discussion & Interview Experiences