Flatiron Health Data Analyst Interview Guide (2025) – Process, Questions & Tips


Introduction
Flatiron Health stands at the forefront of transforming cancer care through technology, real-world data, and artificial intelligence. In 2025, Flatiron’s impact is evident: its real-world oncology data network now encompasses over five million cancer patients, making it one of the largest and most diverse resources of its kind.
The company’s innovative analytics and AI-driven methodologies have led to 14 research abstracts accepted at the 2025 American Society of Clinical Oncology (ASCO) Annual Meeting—highlighting breakthroughs such as the largest real-world study to date on circulating tumor DNA (ctDNA) testing in early-stage breast cancer, involving over 195,000 patients.
As a Data Analyst at Flatiron Health, you will play a pivotal role in this mission. Your responsibilities will center on extracting, cleaning, and analyzing large-scale healthcare datasets using SQL and Python, with a strong emphasis on statistical analysis and data visualization to drive actionable insights for patients, providers, and researchers4.
In this article, you’ll find a comprehensive guide to the Flatiron Health Data Analyst hiring process, including technical, coding, and behavioral interview questions, as well as key tips to help you succeed in your application and interview journey.
What Is the Interview Process Like for a Data Analyst at Flatiron Health?
Flatiron Health’s interview process is multi-stage and designed to assess both technical expertise and cultural fit. Candidates should expect a thorough evaluation of their skills in data manipulation, statistical analysis, and communication, as well as alignment with Flatiron’s mission to improve cancer care.
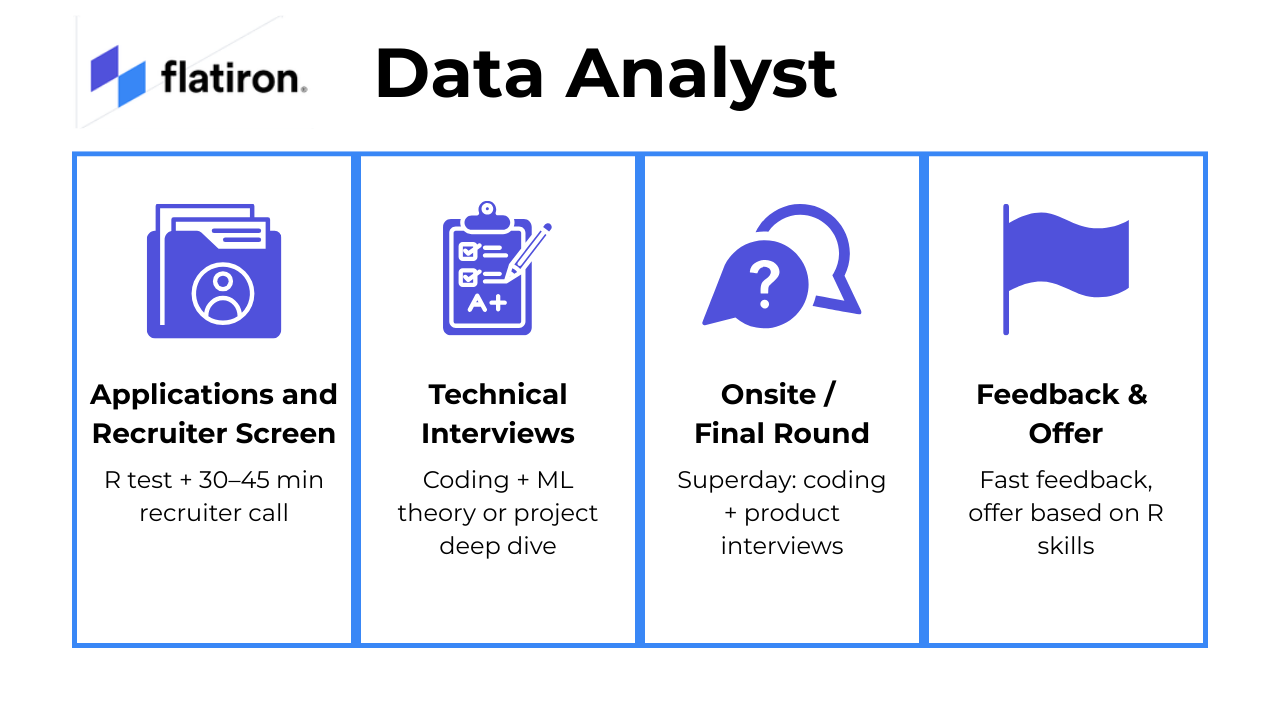
Applications and Recruiter Screen
After you apply online, selected candidates will have a 30 to 45-minute recruiter call. This conversation covers your background, motivation for applying, and your understanding of Flatiron’s mission. It’s also your opportunity to ask questions about the role and the company culture to ensure a good mutual fit. Additionally, many candidates face an Online Assessment early in the process. This assessment is often a timed technical test focusing primarily on R programming and basic data manipulation tasks.
Technical Interviews
The technical interview phase usually begins with a timed online assessment that tests your skills in R programming, especially data manipulation using dplyr, as well as your knowledge of SQL and statistics. Candidates who pass this stage typically move on to interviews with Data Insight Engineers. These sessions include live coding exercises in R, SQL, and BigQuery, along with product-related case questions to evaluate your practical problem-solving skills. Depending on the candidate’s progression, multiple rounds may be involved that combine coding, technical questions, and competency-based interviews.
Onsite/Final Round
The final round, often called the “superday,” involves a series of interviews that include behavioral questions, live coding in R, and product case discussions. You will meet with Data Insight Engineers, Hiring Managers, and Product Managers who assess both your technical capabilities and how well you collaborate and communicate in a team environment.
Feedback & Offer
Candidates typically receive timely and clear feedback following the final round. Offers are generally extended based on your technical fit, with particular emphasis on your proficiency in R and SQL, reflecting the key skills necessary for success in the role.
Challenge
Check your skills...
How prepared are you for working as a Data Analyst at Flatiron Health?
What Questions Are Asked in a Flatiron Health Interview?
The data analyst interview at Flatiron Health is designed to evaluate both your technical expertise and cultural fit, with a strong focus on skills relevant to healthcare data analysis. Here are a few recurring questions to get you started:
Coding/Technical Questions
These types of questions are asked in a Flatiron Health data analyst interview because they mirror real-world analytical challenges like working with time-series health data (like patient vitals or activity logs) and structuring insights from relational datasets (such as clinical records or treatment logs) using SQL:
To solve this, use a common table expression (CTE) to select the top 3 ads by popularity. Then, perform different types of joins (INNER, LEFT, RIGHT, CROSS) between the ads table and the top_ads CTE, counting the resulting rows for each join type.
2. Calculate the 3-day rolling average of steps for each user
To calculate the 3-day rolling average of steps for each user, use self-joins on the daily_steps table to access the current day and the two preceding days’ data. Ensure that the rolling average is only calculated for days with complete data for all three days, and round the result to the nearest whole number.
To find these dates, perform a self-join on the released_patients table, comparing each date’s released patient count to that of the previous day. By filtering for cases where the current day’s count exceeds the prior day’s count, you can extract the relevant release dates and patient counts for the output.
4. Find how many users logged in a certain number of times on a given day
First, count the number of logins each user had on January 1st, 2022. Then, group the results by the number of logins to determine how many users logged in the same number of times, providing a count of users for each login frequency.
5. Write a query to get the distribution of total push notifications before a user converts
To achieve this, join the users and notification_deliveries tables on user_id, ensuring that only users with a non-null conversion_date are included. Use a LEFT JOIN to account for users who converted without receiving any notifications, and filter notifications to those sent before the conversion_date. Finally, count the notifications per user and group by this count to get the distribution.
To solve this, use a HAVING clause to filter queries where all ratings are less than 3 by comparing the count of such ratings to the total count of results per query. Then, calculate the percentage by dividing the count of these queries by the total distinct queries, rounding the result to two decimal places.
7. Write a SQL query to find the average number of right swipes for different ranking algorithms
To solve this, join the swipes and variants tables on user_id and filter for the feed_change experiment. Use a RANK function to rank swipes by created_at for each user, then calculate the average right swipes for users with at least 10, 50, and 100 swipes by grouping by variant and filtering by swipe thresholds.
System/Product Design Questions
These questions are designed to assess how well you can translate ambiguous product scenarios into structured queries—a key skill for data analysts at Flatiron:
8. How would you create a schema to represent client click data on the web?
To create a schema for client click data, start by labeling each action with a specific name, such as folder_click or login_click. Include fields like user_id, created_at, session_id, user_agent, value_type, value_id, device, url, and utm to track detailed analytics. This setup allows for effective querying and analysis of user interactions on the web app.
9. How would you build an ETL pipeline to get Stripe payment data into the database?
To build an ETL pipeline for Stripe payment data, start by extracting data from Stripe’s API, then transform it to fit the schema of your internal data warehouse. Finally, load the transformed data into the warehouse, ensuring it is accessible for analysts to create revenue dashboards and perform analytics.
10. How would you build a data pipeline for hourly user analytics?
Design a data pipeline that aggregates user data from a data lake, using SQL queries to count distinct users over hourly, daily, and weekly periods. Implement a system to update this data hourly, minimizing query frequency to optimize performance, and consider using tools like AirFlow for orchestration.
11. How would you build a database for a consumer file storage company like Dropbox?
To design a database for a file storage company like Dropbox, you need to consider the ability to store various file types and maintain a history of file changes. This involves creating a schema that supports metadata for each file, including file type, size, and version history. Additionally, implementing a system for tracking changes and updates to files is crucial for maintaining data integrity and user access to previous versions.
Designing a solution involves using a scalable data warehouse like Amazon Redshift to store the large volume of daily events with a two-year retention period. Implementing a data pipeline using tools like Spark Streaming or Amazon Kinesis Data Firehouse can facilitate the transfer of data from Kafka to the warehouse. The solution should balance cost efficiency with the required latency for analytics, ensuring data is accessible for reporting and machine learning purposes.
Behavioral or “Culture Fit” Questions
These behavioral questions help Flatiron evaluate whether you’ll thrive in their mission-driven, cross-functional environment. They assess your alignment with the company’s values:
To answer this question, align your personal career goals with Flatiron Health’s mission. Discuss how their focus on transforming healthcare through technology and data analytics matches your professional aspirations and values. Highlight any specific projects or initiatives at Flatiron Health that particularly interest you and how you can contribute to them.
14. Tell us about a time you handled conflict within a team. How did you resolve it?
To answer this question, describe a specific situation where you faced a conflict within a team. Explain the steps you took to address the issue, focusing on communication, understanding different perspectives, and finding a mutually agreeable solution. Highlight the outcome and any lessons learned from the experience.
15. How do you prioritize tasks and manage your time when working on multiple projects?
To prioritize tasks, focus on high-priority work first using to-do lists or project management tools like Trello or Asana. Break projects into smaller tasks and use time management techniques such as time-blocking or the Pomodoro method to allocate focused work periods followed by short breaks.
16. Describe a time you made a mistake in your analysis. How did you handle it and what did you learn?
Reflect on a specific instance where an error occurred in your data analysis process. Explain how you identified the mistake, the steps you took to correct it, and the lessons you learned from the experience. Highlight your problem-solving skills and ability to learn from errors to improve future work.
17. What motivates you to work in healthcare data analytics?
To answer this question, focus on the impact of data analytics on improving patient care and healthcare delivery. Highlight your passion for using data to drive meaningful change in the healthcare sector and your interest in working with innovative technologies to enhance decision-making processes.
How to Prepare for a Role at Flatiron Health
Preparing thoroughly can help you feel confident and perform your best during the Flatiron Data Analyst interview.
Start by understanding Flatiron Health’s core focus—curating oncology data from EHR systems to enable real-world evidence and accelerate cancer research. Review how they extract insights from messy, unstructured clinical notes, and think critically about how your past work with healthcare datasets.
Simulate the technical interview by practicing SQL and Python problems centered around realistic healthcare scenarios like joining patient and visit tables, filtering by diagnosis or treatment date, and summarizing outcomes across cohorts.
Reflect on real-world projects where you cleaned or analyzed clinical data, handled missing values or conflicting entries, or mapped diagnosis and procedure codes. Be prepared to explain how you turned those datasets into actionable insights and communicated your findings to both technical peers and clinical stakeholders.
In behavioral interviews, use the STAR method (Situation, Task, Action, Result) to frame your contributions. Tailor your examples to show impact in healthcare environments. Emphasize cross-functional collaboration, especially with clinicians, data engineers, or product teams.
Finally, study Flatiron’s recent research collaborations and participate in mock interviews to refine your competitive edge. For further refinement, feel free to make extensive use of our AI Interviewer to support your preparations.
FAQs
What technical skills are most important for a Data Analyst at Flatiron Health?
Proficiency in SQL and Python (especially with Pandas), experience with data cleaning, statistical analysis, and data visualization tools like Looker or Streamlit.
Is healthcare experience required?
While not always required, understanding healthcare data and workflows is a significant advantage. A passion for Flatiron’s mission is essential.
How long does the interview process take?
The process can be lengthy, with several rounds and possible delays in feedback. Stay patient and communicate your availability with the recruiter.
What’s the culture like at Flatiron Health?
Mission-driven, collaborative, and innovative, with a strong emphasis on communication, adaptability, and continuous learning.
Conclusion
Interviewing for a Data Analyst role at Flatiron Health is a rigorous process that tests both your technical skills and your alignment with the company’s mission to improve cancer care.
For a structured prep plan, explore our Data Analytics Learning Path, review common data analyst interview questions, and get inspired by Muhammad’s success story. These resources provide real-world case studies, technical challenges, and examples of what success looks like at Flatiron.
Flatiron Health Interview Questions
| Question | Topic | Difficulty | ||||||||||||||||||||||
|---|---|---|---|---|---|---|---|---|---|---|---|---|---|---|---|---|---|---|---|---|---|---|---|---|
SQL | Easy | |||||||||||||||||||||||
Write a SQL query to select the 2nd highest salary in the engineering department. Note: If more than one person shares the highest salary, the query should select the next highest salary. Example: Input:
Output:
| ||||||||||||||||||||||||
SQL | Medium | |||||||||||||||||||||||
A/B Testing | Medium | |||||||||||||||||||||||
SQL | Easy | |
Machine Learning | Medium | |
Statistics | Medium | |
SQL | Hard | |
Machine Learning | Medium | |
Python | Easy | |
Deep Learning | Hard | |
SQL | Medium | |
Statistics | Easy | |
Machine Learning | Hard |
Discussion & Interview Experiences