
Data Interview Statistics 2026: What 22,000+ Interview Reports Say Data Interviews Test

Summary
We read the text of 22,000+ public interview reports from data scientist, data analyst, data engineer, ML engineer and business analyst candidates at 3,000+ US employers, for interviews held from January 2023 to June 2025, and counted which skills and formats each report mentions. SQL leads for data engineers (39.4% of reports) and data analysts (24.8%), machine learning leads for data scientists (25.8%) and ML engineers (48.8%), and A/B testing appears in only 2.7% of data scientist reports. The fastest change was AI: the share of ML engineer reports mentioning AI or LLMs rose from 4.9% in 2023 to 15.2% in the first half of 2025.
This article is part of our Top 110 Data Science Interview Questions (Updated for 2025) series. Follow the full Data Science Interview learning path.
Key statistics
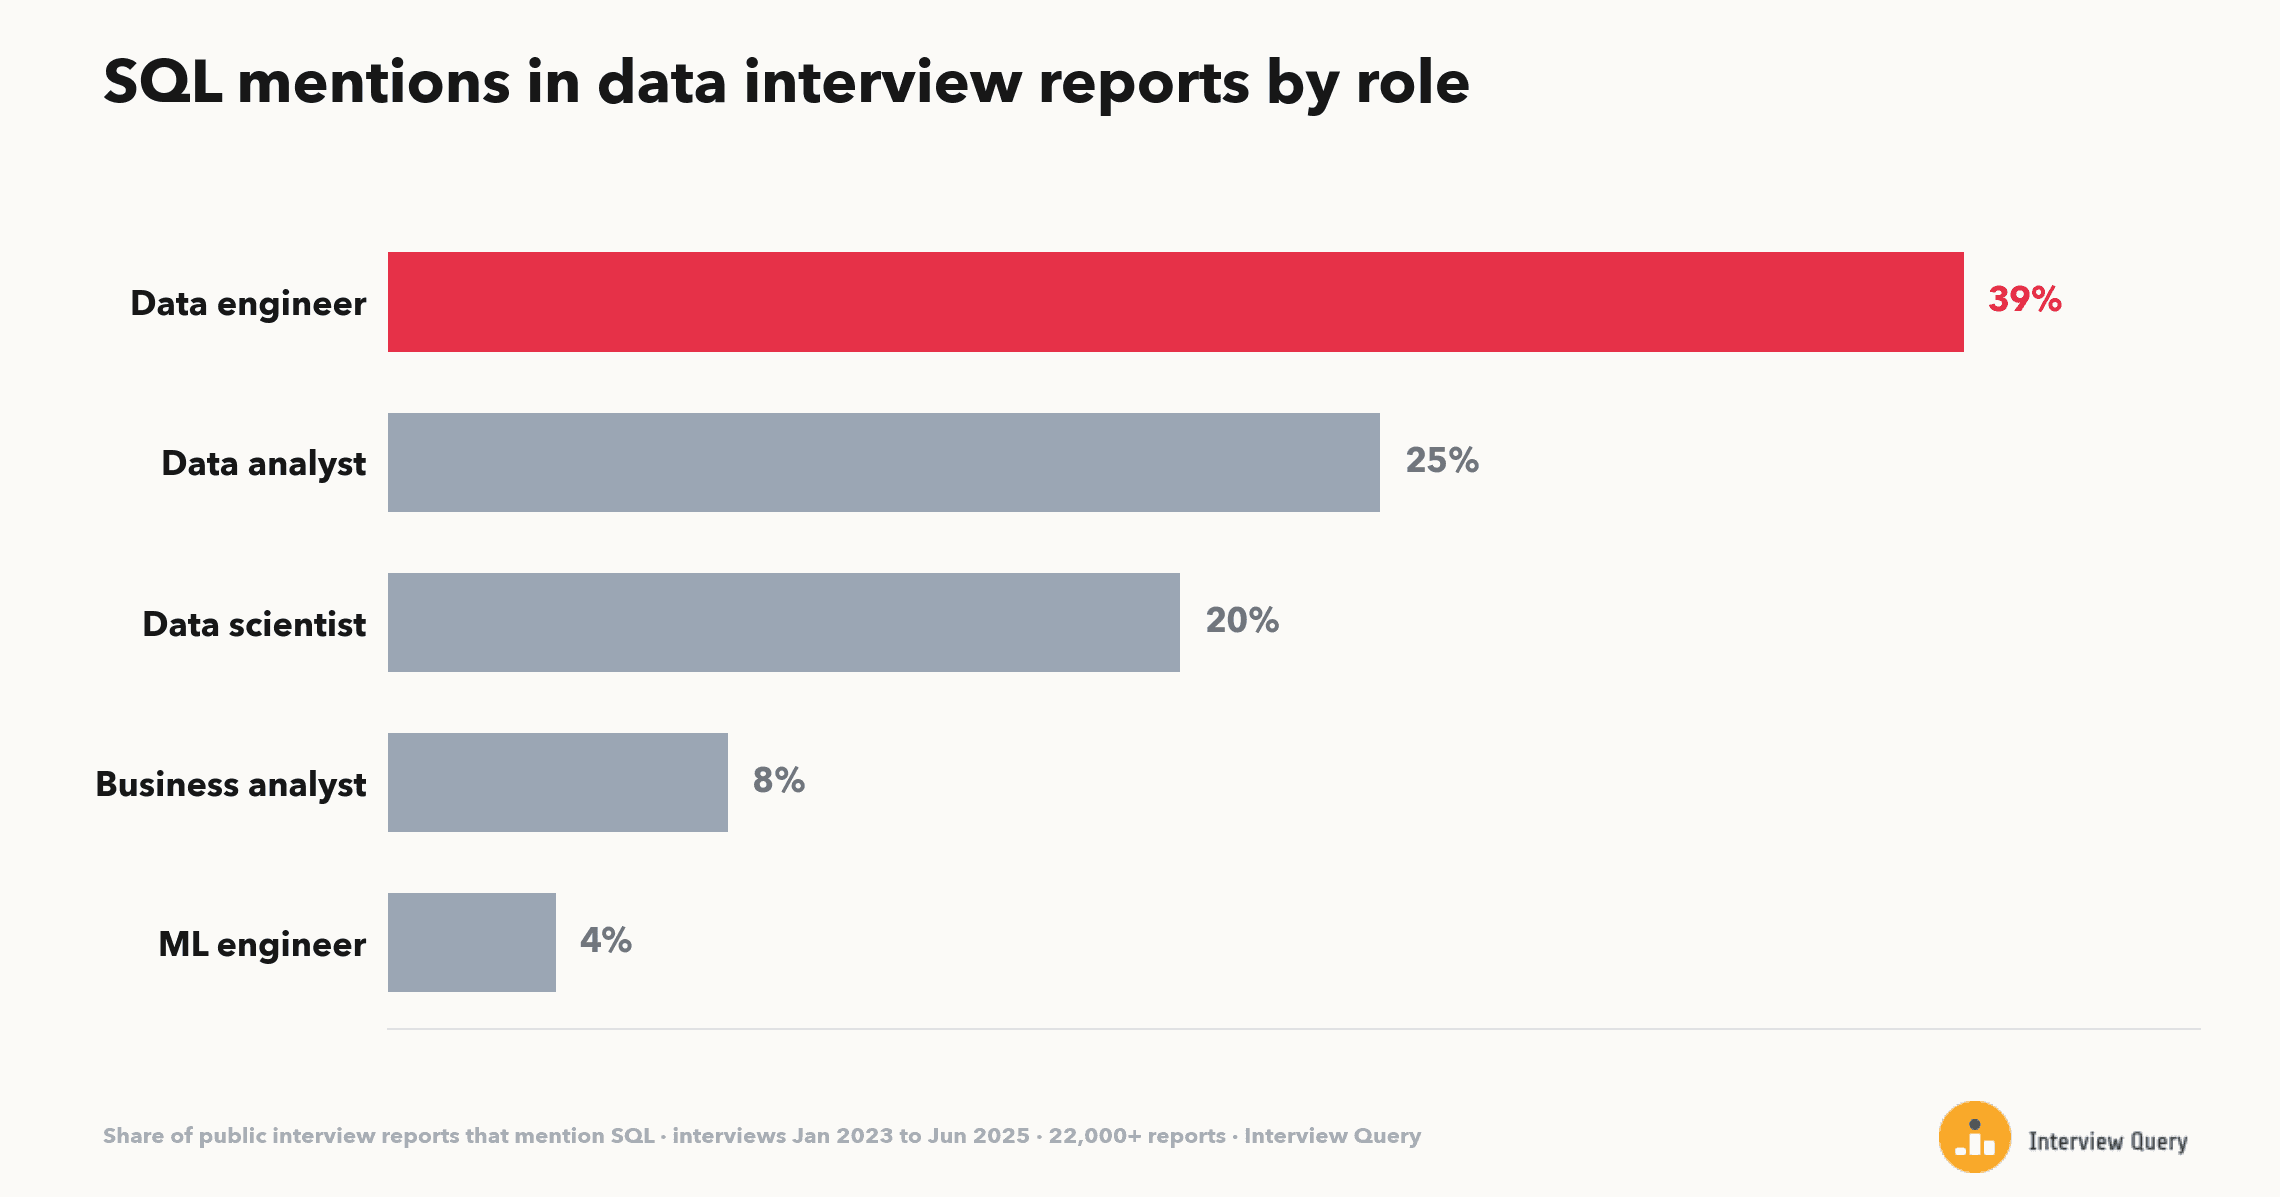
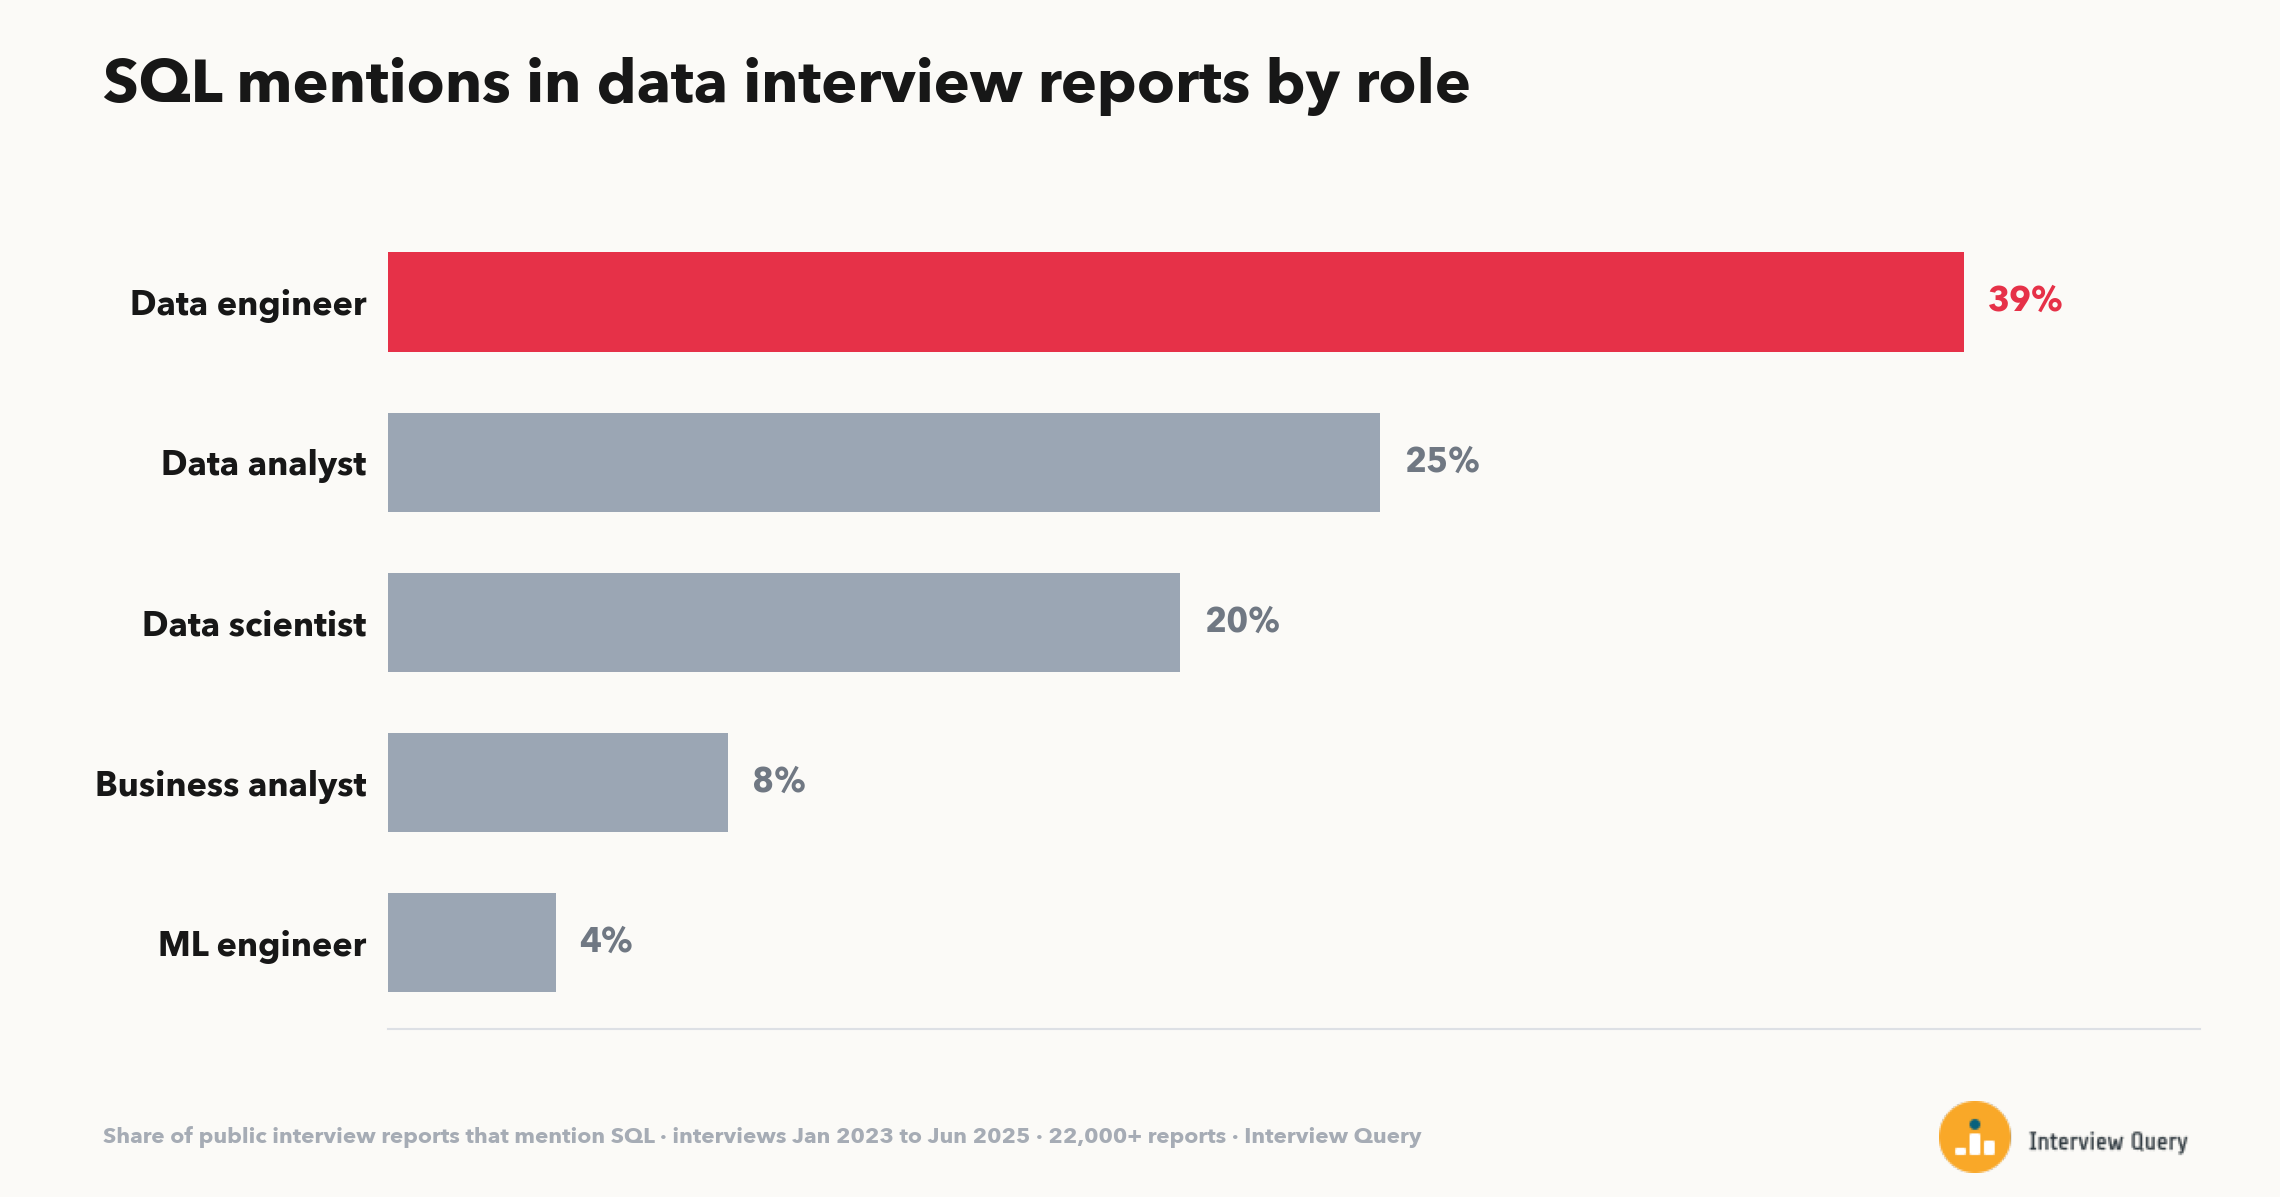
- 39.4% of data engineer interview reports mention SQL, the highest of any data role (2,000+ reports, Jan 2023 to Jun 2025).
- Among data analyst interview reports that name at least one skill area, 50.2% mention SQL (3,000+ reports).
- 25.8% of data scientist interview reports mention machine learning, compared with 19.8% that mention SQL (4,000+ reports).
- Only 2.7% of data scientist interview reports mention A/B testing or experiment design (4,000+ reports).
- The share of ML engineer interview reports mentioning AI or LLMs tripled, from 4.9% in 2023 (554 reports) to 15.2% in January to June 2025 (527 reports).
- 20.8% of ML engineer interview reports mention LeetCode-style coding, the most of any data role (2,000+ reports).
- 17.1% of all data interview reports mention behavioral questions, more than any technical skill except SQL (22,000+ reports).
- Behavioral mentions rose from 16.2% of data interview reports in 2023 to 20.2% in the first half of 2025 (8,000+ and 3,000+ reports).
- Take-home assignments appeared in 6.5% of data scientist reports in 2023 and 3.7% in the first half of 2025 (1,000+ and 848 reports).
- 47.4% of data interview reports name none of the nine skill or format areas we measured; they describe the process, not the content (22,000+ reports).
Finding 1: Each data role has a different first skill
SQL is the most mentioned skill for data engineers and data analysts. Machine learning is the most mentioned skill for data scientists and ML engineers. Business analyst reports mention behavioral and case questions far more than any technical skill.
Share of interview reports that mention each area, January 2023 to June 2025:
| Area | Data scientist | Data analyst | Data engineer | ML engineer | Business analyst | All data roles |
|---|---|---|---|---|---|---|
| SQL | 19.8% | 24.8% | 39.4% | 4.2% | 8.5% | 19.7% |
| Python | 17.2% | 10.0% | 25.1% | 12.0% | 2.1% | 11.8% |
| Machine learning | 25.8% | 2.8% | 2.0% | 48.8% | 0.8% | 11.5% |
| Statistics and probability | 11.0% | 3.1% | 0.7% | 3.7% | 1.5% | 4.2% |
| A/B testing | 2.7% | 1.3% | 0.1% | 0.5% | 0.1% | 1.1% |
| Case or product question | 14.2% | 11.0% | 3.3% | 5.0% | 15.8% | 11.3% |
| LeetCode-style coding | 6.4% | 2.1% | 9.1% | 20.8% | 0.5% | 5.3% |
| Take-home | 5.9% | 3.5% | 3.0% | 4.9% | 0.9% | 3.4% |
| Behavioral | 17.0% | 18.0% | 14.9% | 15.1% | 18.2% | 17.1% |
| AI or LLMs | 3.7% | 0.7% | 1.1% | 11.2% | 0.5% | 2.3% |
| Reports | 4,000+ | 6,000+ | 2,000+ | 2,000+ | 5,000+ | 22,000+ |
Data engineer reports are the most technical by this measure: 16.1% also mention data modeling or pipelines, and 7.5% mention system design. If you are preparing for a data engineer loop, practice SQL interview questions for data engineers first.
Finding 2: Among reports that name a skill, SQL reaches half of analyst interviews
Many reviews are short and describe only the process ("three rounds, then an offer"). If we look only at reports that name at least one of the nine skill or format areas, the shares roughly double. This is a post hoc cut, added after we saw that 47.4% of reports name none (see Methodology).
| Area | Data scientist | Data analyst | Data engineer | ML engineer |
|---|---|---|---|---|
| SQL | 31.1% | 50.2% | 67.8% | 6.0% |
| Python | 27.0% | 20.2% | 43.2% | 17.1% |
| Machine learning | 40.5% | 5.7% | 3.5% | 69.6% |
| Statistics and probability | 17.3% | 6.2% | 1.2% | 5.3% |
| LeetCode-style coding | 10.0% | 4.3% | 15.7% | 29.6% |
| Reports naming a skill | 3,000+ | 3,000+ | 1,000+ | 1,000+ |
For data scientists, statistics comes up in 17.3% of these reports. Our statistics and A/B testing interview questions cover the concepts candidates name most often: hypothesis tests, p-values and confidence intervals.
Finding 3: AI and LeetCode-style coding grew in ML engineer interviews
Within ML engineer reports, three measures changed by more than our pre-set bar (2 points, p < 0.01, 200+ reports per period):
| ML engineer reports | 2023 | Jan to Jun 2025 | Change |
|---|---|---|---|
| AI or LLMs | 4.9% | 15.2% | +10.3 pts |
| LeetCode-style coding | 17.5% | 26.6% | +9.1 pts |
| Machine learning (classic terms) | 54.7% | 44.2% | -10.5 pts |
| Reports | 554 | 527 |
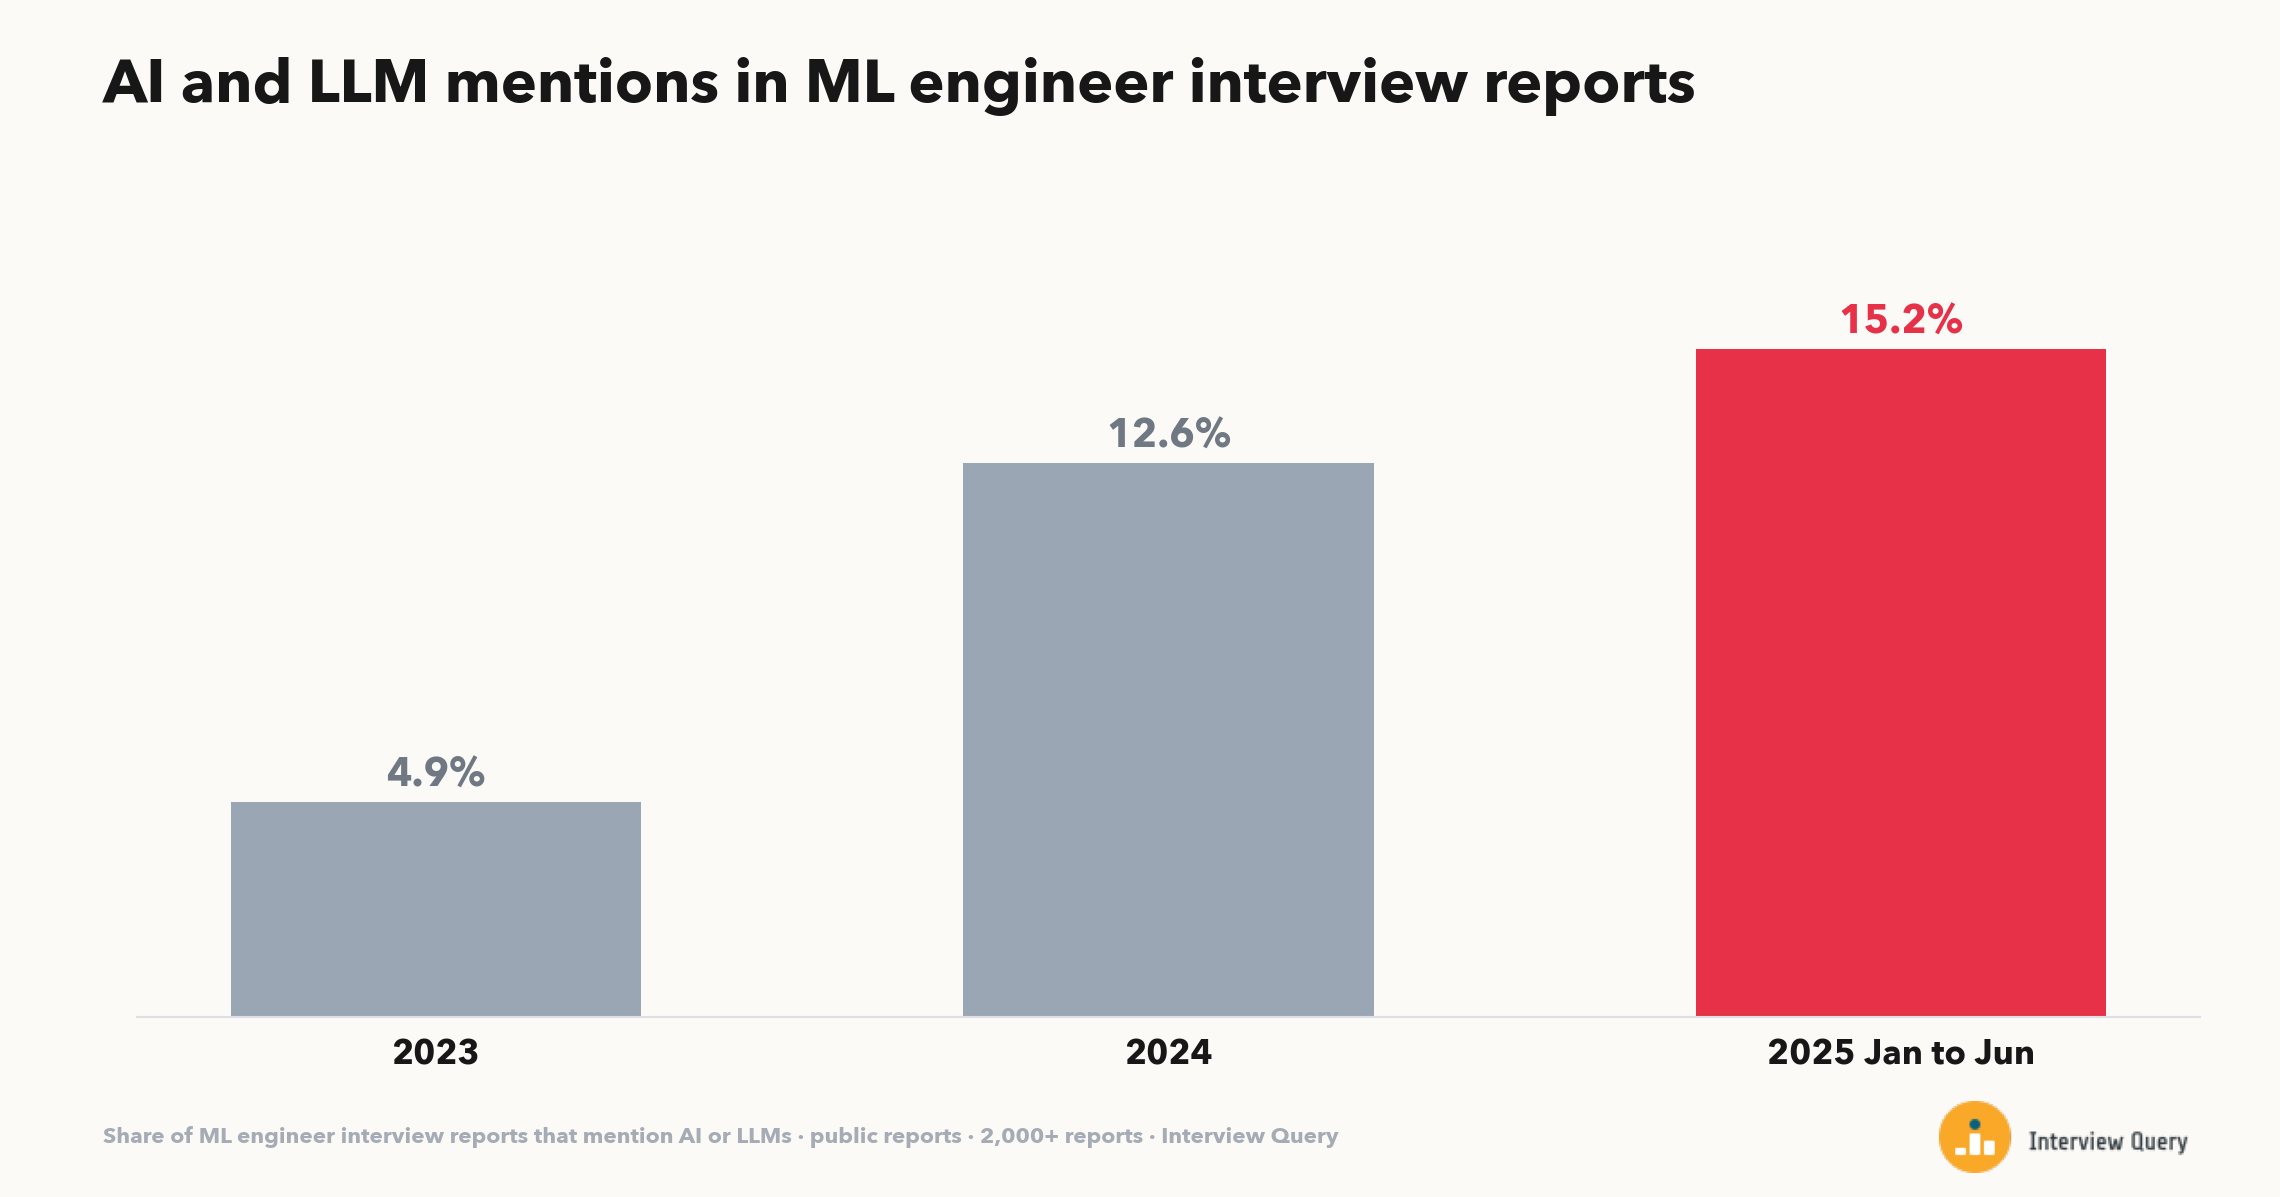
Classic machine learning vocabulary (regression, random forests, overfitting) fell as AI and LLM vocabulary rose, while LeetCode-style coding rounds grew. For ML engineer prep, that means ML system design questions plus coding practice, not theory alone. Our separate study of AI in 2026 technical interviews tracks AI mentions across all roles into 2026.
Finding 4: Data scientist interviews mention SQL and product cases more often
Data scientist reports changed in five measures between 2023 and the first half of 2025:
| Data scientist reports | 2023 | Jan to Jun 2025 | Change |
|---|---|---|---|
| SQL | 18.0% | 24.6% | +6.7 pts |
| Case or product question | 12.0% | 17.2% | +5.2 pts |
| AI or LLMs | 2.0% | 5.0% | +2.9 pts |
| A/B testing | 1.9% | 4.0% | +2.1 pts |
| Take-home | 6.5% | 3.7% | -2.9 pts |
| Reports | 1,000+ | 848 |
Data engineer reports moved the same way on core tools: SQL from 35.9% to 43.6% and Python from 23.7% to 30.9% (1,000+ and 567 reports). Behavioral mentions rose for data analysts (17.6% to 22.1%), business analysts (15.9% to 21.0%) and ML engineers (12.5% to 20.5%). For data scientists, the shift toward SQL and product cases is where data science SQL interview questions and product case practice in our question bank pay off.
What went against our expectations
We wrote our expectations down before running the numbers. Four did not hold:
- SQL was lower than expected for analysts. We expected about half of data analyst reports to mention SQL. Across all reports it was 24.8%; it reaches 50.2% only among reports that name a skill.
- A/B testing is rare even for data scientists. We expected it to be a core data scientist topic. It appears in 2.7% of data scientist reports, and 4.2% of those that name a skill. Candidates may describe these rounds as "product case" or "statistics" instead.
- Data scientist reports mention machine learning more than SQL (25.8% vs 19.8%), the reverse of the common advice that data science interviews are mostly SQL.
- Behavioral questions are the most consistent topic across roles, between 14.9% and 18.2% for every role, and rising.
Our expectation that take-homes were declining held for data scientists only. For all data roles combined, the change (3.5% to 3.0%) did not meet our bar.
Methodology
Question. Among public, first-person interview reports for data roles at US employers, what share mention each skill area or interview format, how does that differ by role, and how did it change from 2023 to the first half of 2025?
Data. Public interview reviews collected by Interview Query, interview dates January 1, 2023 to June 30, 2025. Collection and analysis run November 11, 2026. Interviews after June 2025 are excluded because those reports do not carry the candidate's job title, and we did not want to assign roles with a model that reads the same text we measure.
Included. Reports whose job title, as typed by the candidate, identifies one of five roles, with at least 100 characters of text. Excluded: manager, director, head and VP titles; generic titles such as "Analyst" or "Scientist"; 285 duplicate texts at the same company. Final sample: 22,000+ reports at 3,000+ companies.
Measures. A report counts for an area if its text matches a fixed keyword pattern. We read 60 randomly drawn matching reports per measure and counted how many truly described that topic in the interview. Precision: SQL 96.7%, Python 98.3%, LeetCode-style coding 91.7%, statistics 96.7%, A/B testing 98.3%, machine learning 96.7%, case or product 91.7%, take-home 95.0%, behavioral 85.0%, AI or LLMs 86.7%. Two patterns had obvious bugs that we fixed and re-tested before computing any result (the word "algorithm" matched ML algorithms; "STAR" matched "star schema").
Rules set before results. Minimum 200 reports per cell. A change counts only if it is at least 2 points with p < 0.01. Trends for all roles combined were checked on a fixed panel of 737 companies present in every period (15,000+ reports). Capping each company at 50 reports per role moved one number by more than 3 points: business analyst case questions fall from 15.8% to 12.4%.
2026 check. In 407 data scientist and 235 data analyst reports submitted directly to Interview Query in 2026, the same patterns rank SQL first and case questions second for analysts (73.2% and 49.8%), and case questions and SQL first for data scientists (51.8% and 50.9%), at higher levels because those reports are longer and edited.
Limitations
- Mentions are not tests. A report can mention SQL without a SQL round, and many reports skip content entirely. Treat every share as a floor.
- Self-reported and self-selected. People choose whether to post, and they remember some rounds better than others.
- Source bias. One review site, US employers, mostly English text. Large tech employers are over-represented, though the 10 largest companies supply only 10.7% of reports.
- Survivorship. Removed or never-published reviews are missing.
- Panel changes. The set of companies collected changes over time. The fixed-company panel guards the combined trends; the per-role trends use all companies.
- Role mix. ML engineers grew from 6.8% to 13.9% of the sample. At a constant 2023 role mix, the combined AI rise is 1.1% to 3.2%, and the combined LeetCode-style rise (+1.3 points) does not meet our bar, so we do not claim it.
- Keyword matching misses paraphrases and catches some negations ("no behavioral questions").
- Time window. Results end in June 2025.
Update history
- 2026-11-11: First version. Interviews January 2023 to June 2025. Next update planned for Q1 2027.
How to cite
Interview Query. "Data Interview Statistics 2026: What 22,000+ Interview Reports Say Data Interviews Test." November 11, 2026. https://www.interviewquery.com/p/data-interview-statistics-2026
Keep reading
- Top 110 Data Science Interview Questions (Updated for 2025)
- Top 100+ Data Analyst Interview Questions (Updated for 2025)
- Data Engineer Interview Questions and Answers (2025)