
Your Odds of Getting the Offer Have Never Been Lower

The Lowest Offer Rates in Twelve Years
Tech interviews have felt harder for years. We finally have the data on why.
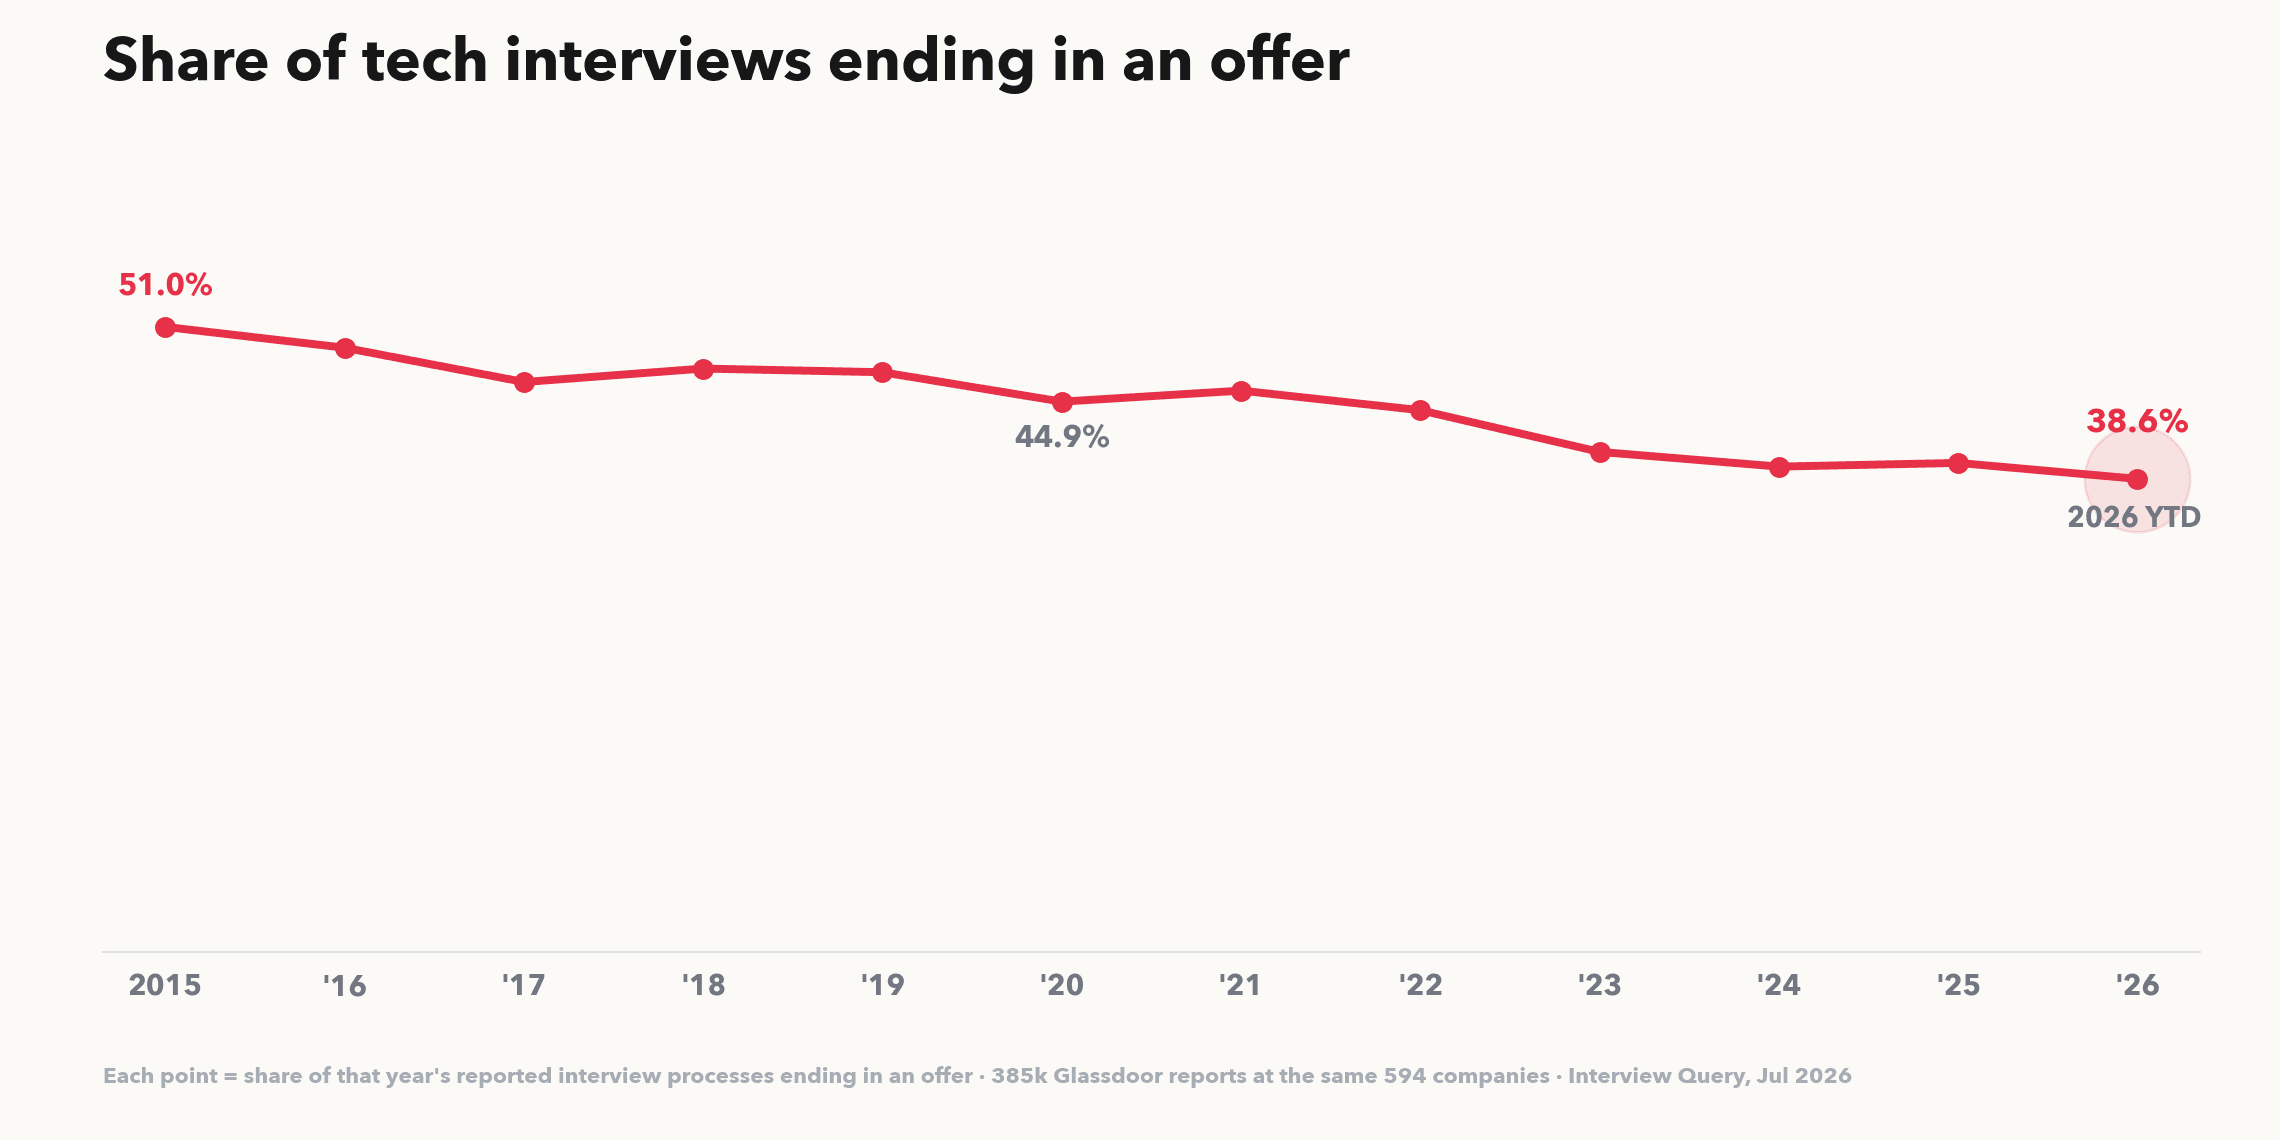
We analyzed over a million interview experiences across Interview Query and Glassdoor, and the picture is blunt: offer rates are at their lowest point in the last twelve-plus years. In 2015, roughly half of reported interview processes ended in an offer. In 2026, it is 38.6%. The rate has fallen almost every single year, and it has never once recovered.
A quick note on how we measured this. An offer rate here is the share of reported interview processes that ended in an offer, whether the candidate accepted it or declined it. To keep the trend honest we computed it on a fixed panel of 594 companies that appear in our data every year, 385k reports in total, so the decline you see is the same companies getting stingier.
Interviews keep getting harder
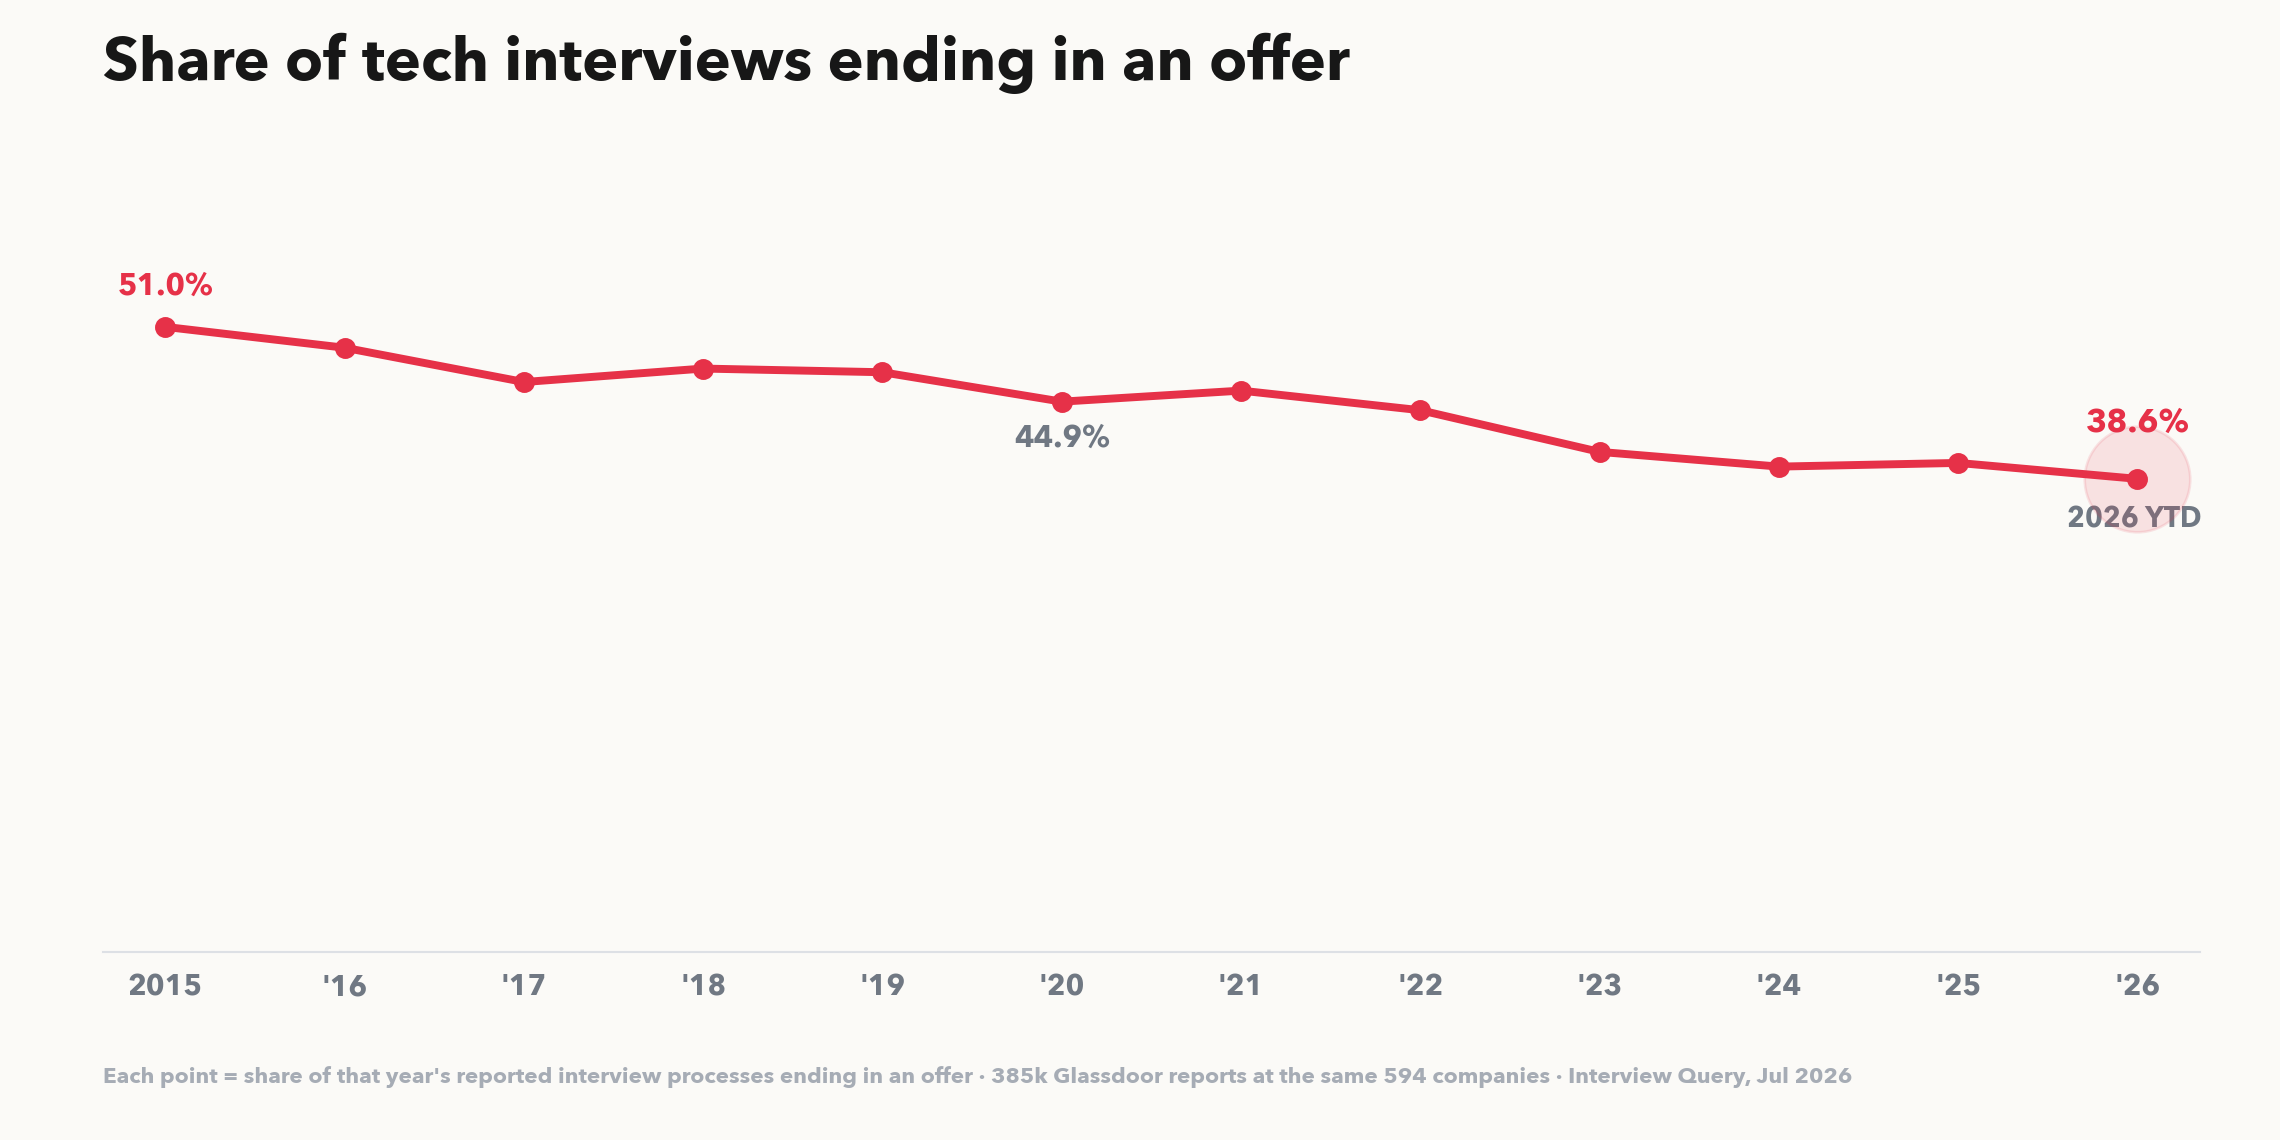
The decade splits into three eras. A slow grind down from 51% through the late 2010s. A COVID step-down happened in 2020. Lockdowns cut interview volume in half almost immediately and then interview conversion rates dropped before coming back.
For bigger companies the drop is even steeper. Among companies with at least 50 reports in a given year, the median company’s offer rate went from 57.1% in 2018 to 44.0% in 2024 to 37.1% in 2026. The typical large tech employer converts twenty points fewer of its interviews into offers than it did eight years ago.
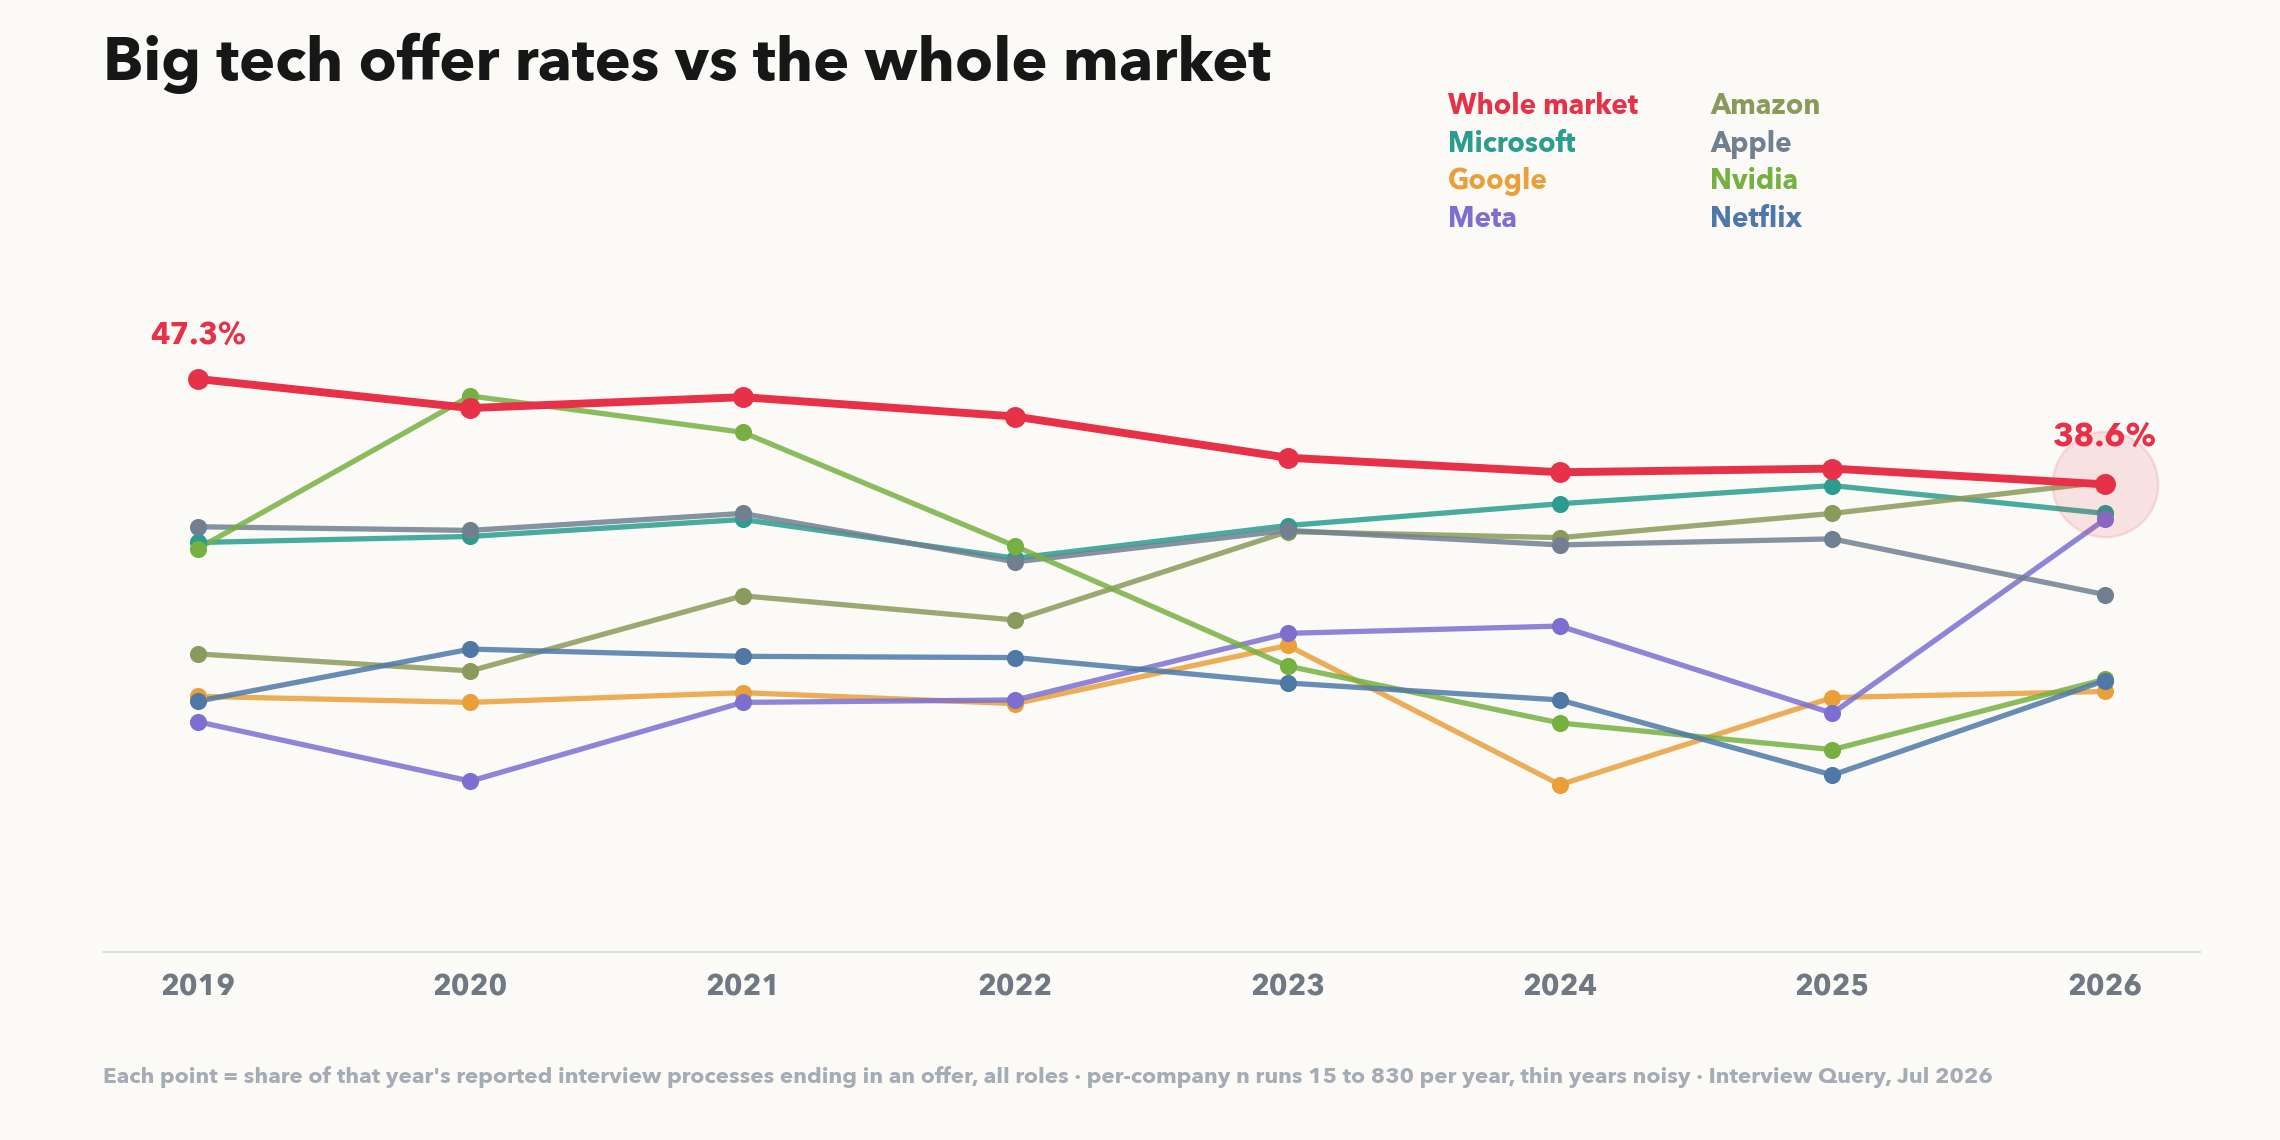
Big tech however, has been remarkably consistent. Google has converted roughly 21% of reported interviews into offers every year since 2019. Microsoft has sat in the mid 30s the whole time.
The squeeze did not come from Google getting pickier but rather from the broad middle of the market slowly drawing down. The one big-tech exception is Nvidia, which tightened from 46% in 2020 to 17% in 2025 as it became the most important company in the world, and likely had a huge increase in applicants and talent selection.
Non-Tech Roles Got Hit the Hardest
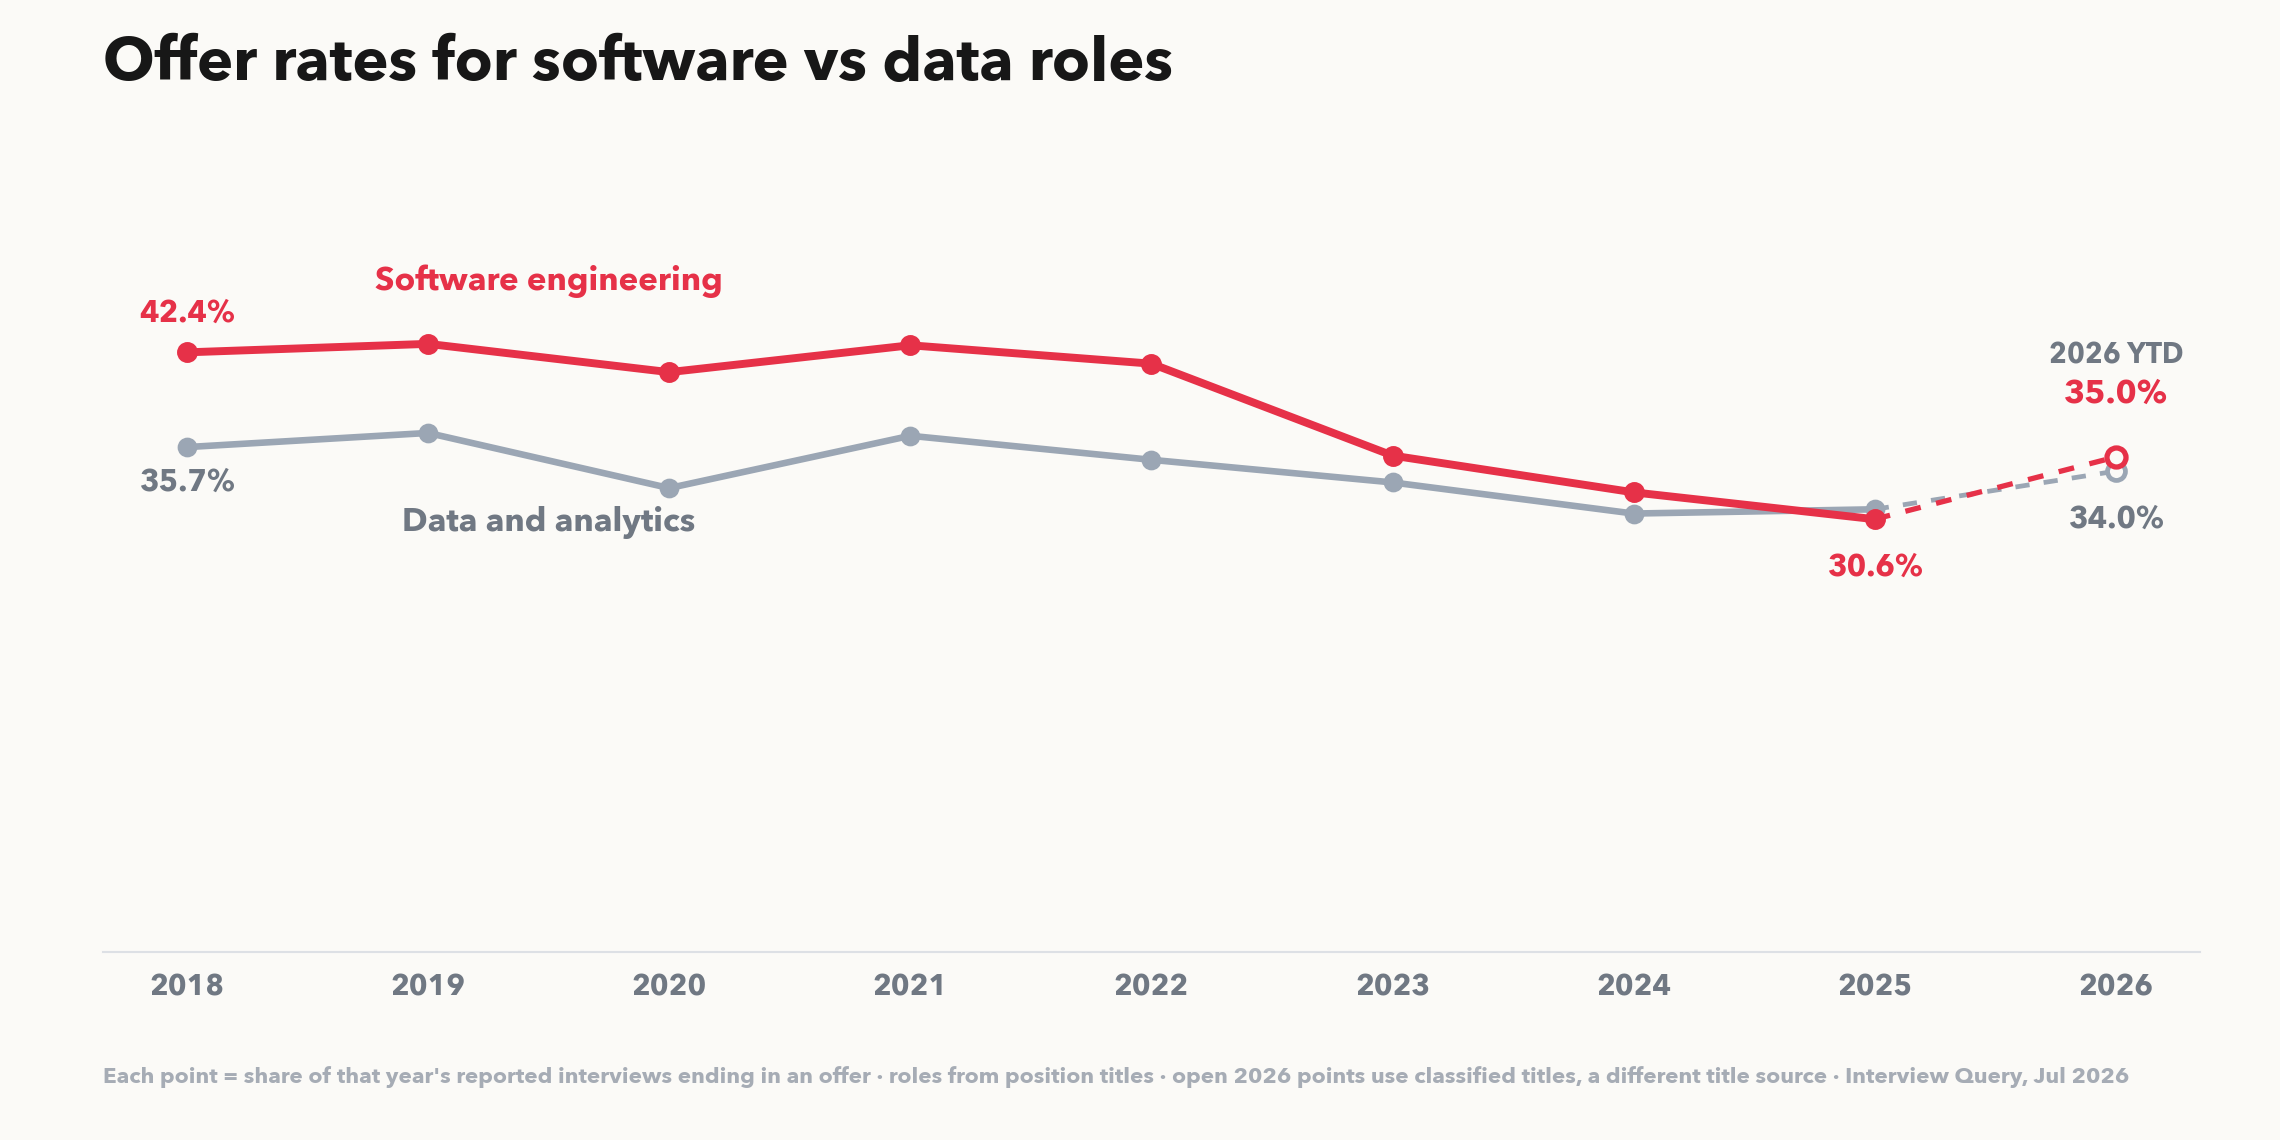
Software engineering held a steady 42% offer rate for five years, then gave up eleven points in the three years after 2023. Data roles slid more gently, and the two have now converged at roughly the same rate. The old software premium, where an SWE interview was meaningfully more likely to end in an offer than a data one, is gone. Both show a small uptick in 2026 however.
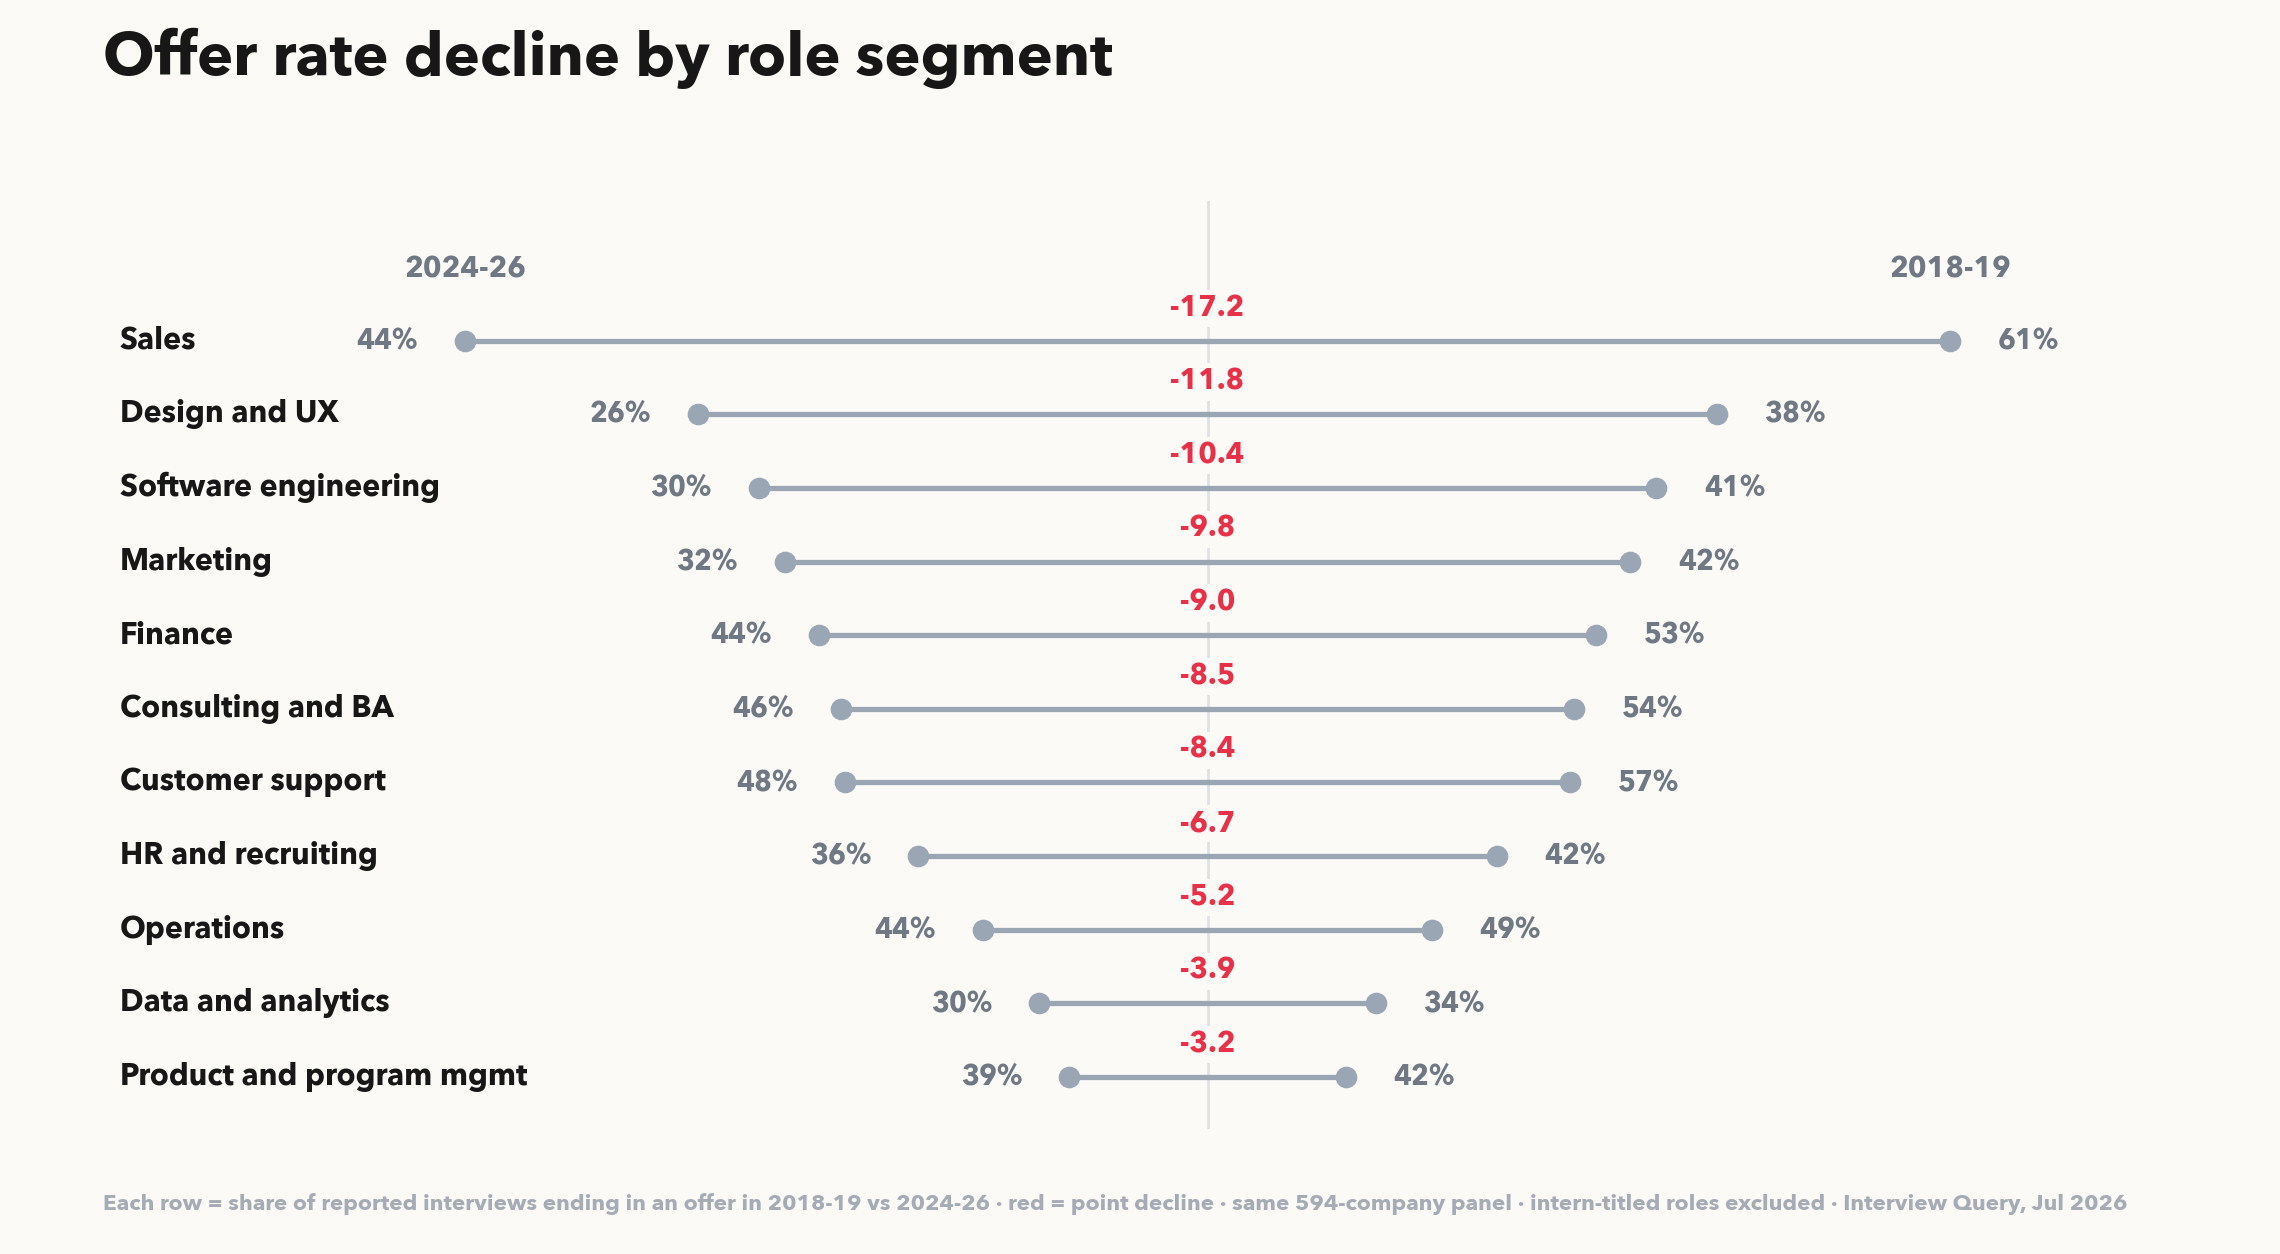
The biggest declines however are not in engineering. Sales fell 17 points from a 61% starting point. Design fell 12 and is now the lowest-converting segment in tech at 26%. Marketing, finance, consulting, and support all gave up 8 to 10 points. The most resilient segments are data and product management, which mostly just held their already-low rates.
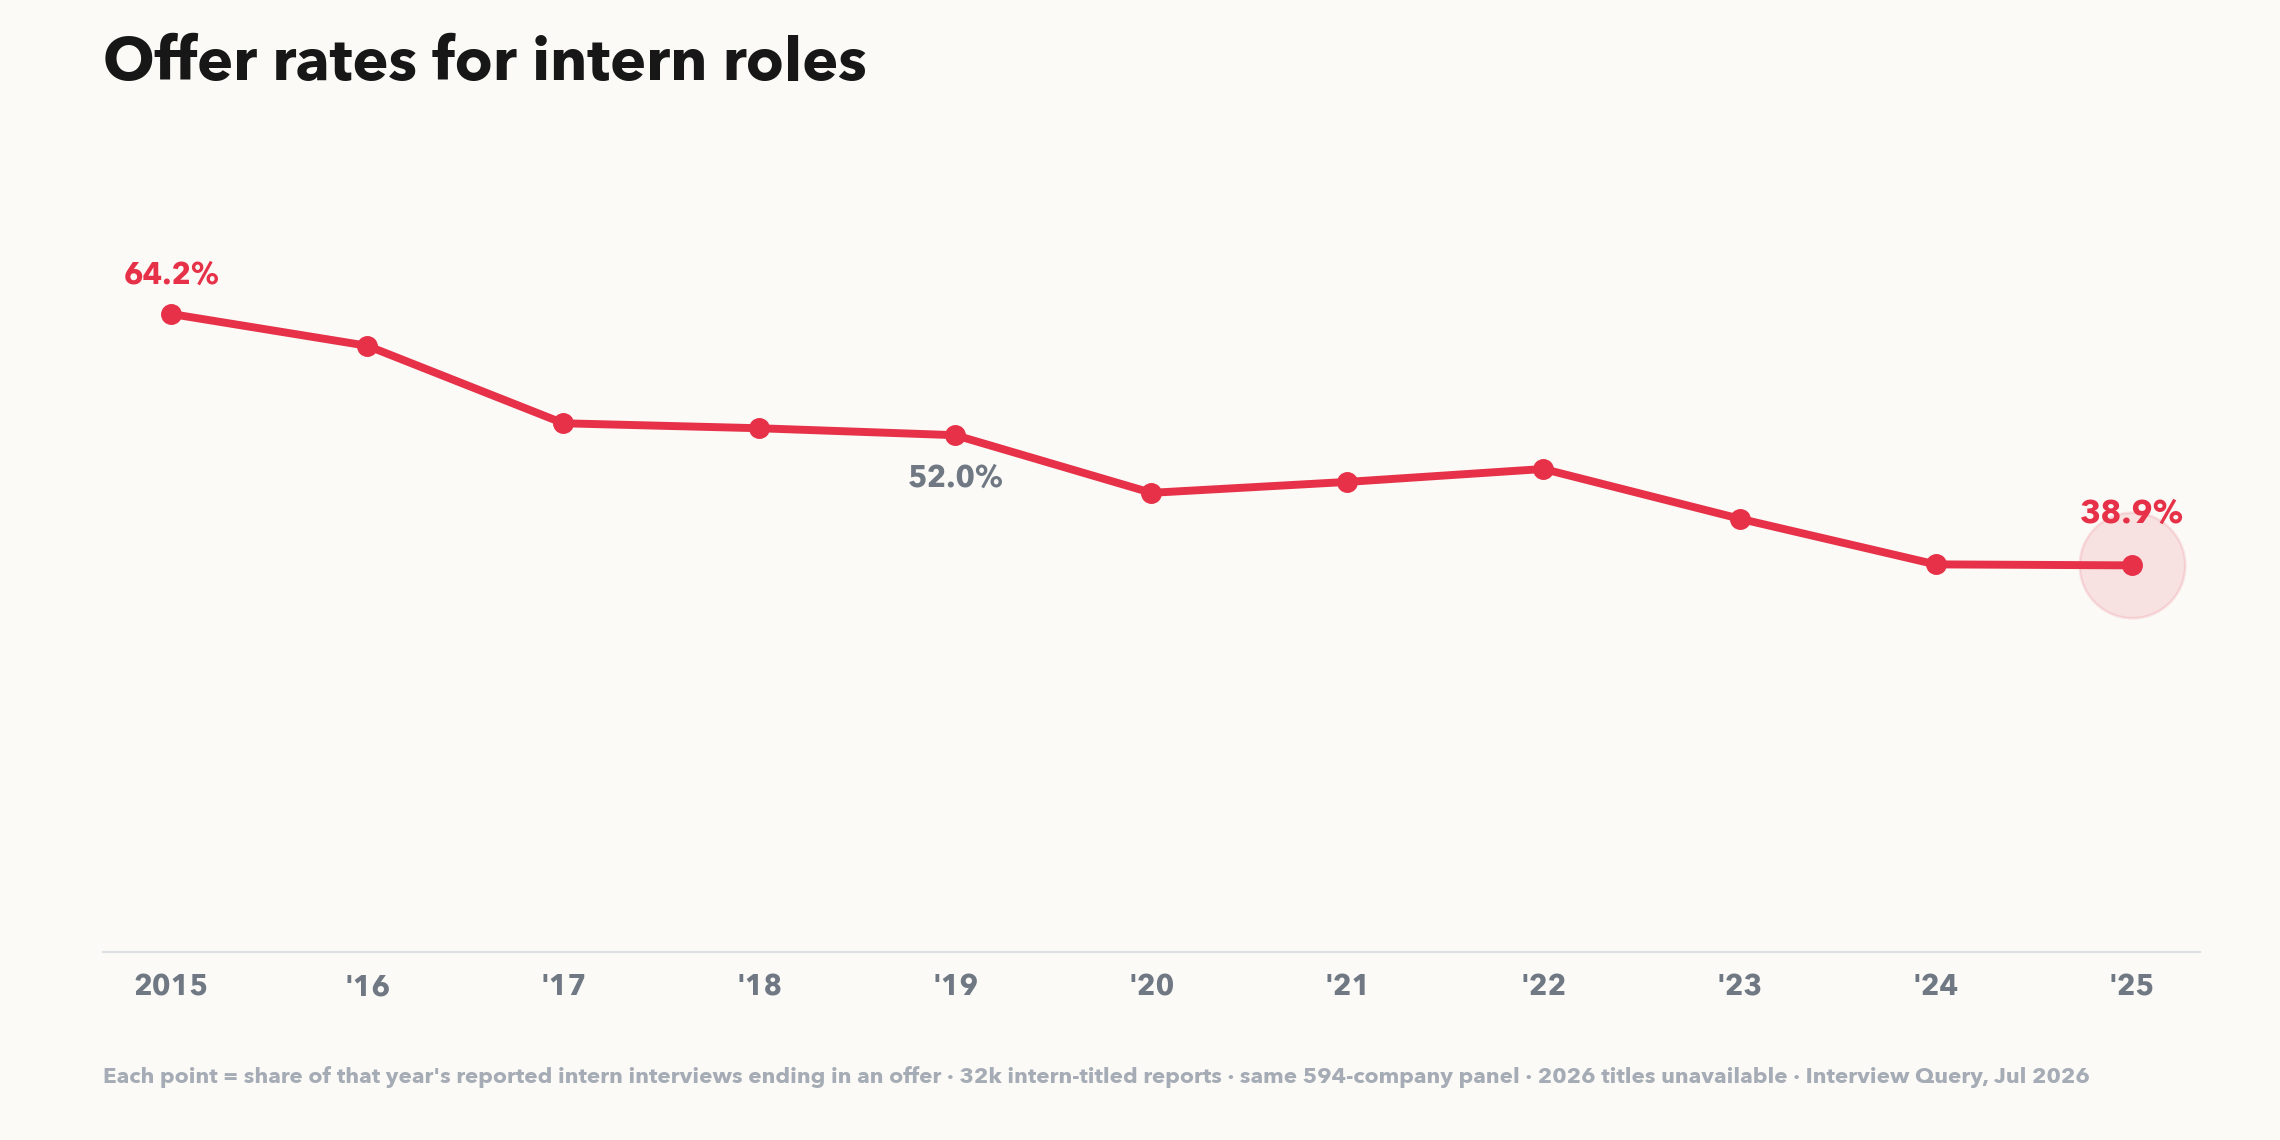
Lastly intern roles have gone down some of the most. In 2015, an intern interview ended in an offer 64% of the time. By 2024 it was 39%, a 25-point collapse that tracks the broader entry-level squeeze everyone is feeling.
But here is the counterintuitive part. Right now, offer rates are roughly flat across seniority levels:
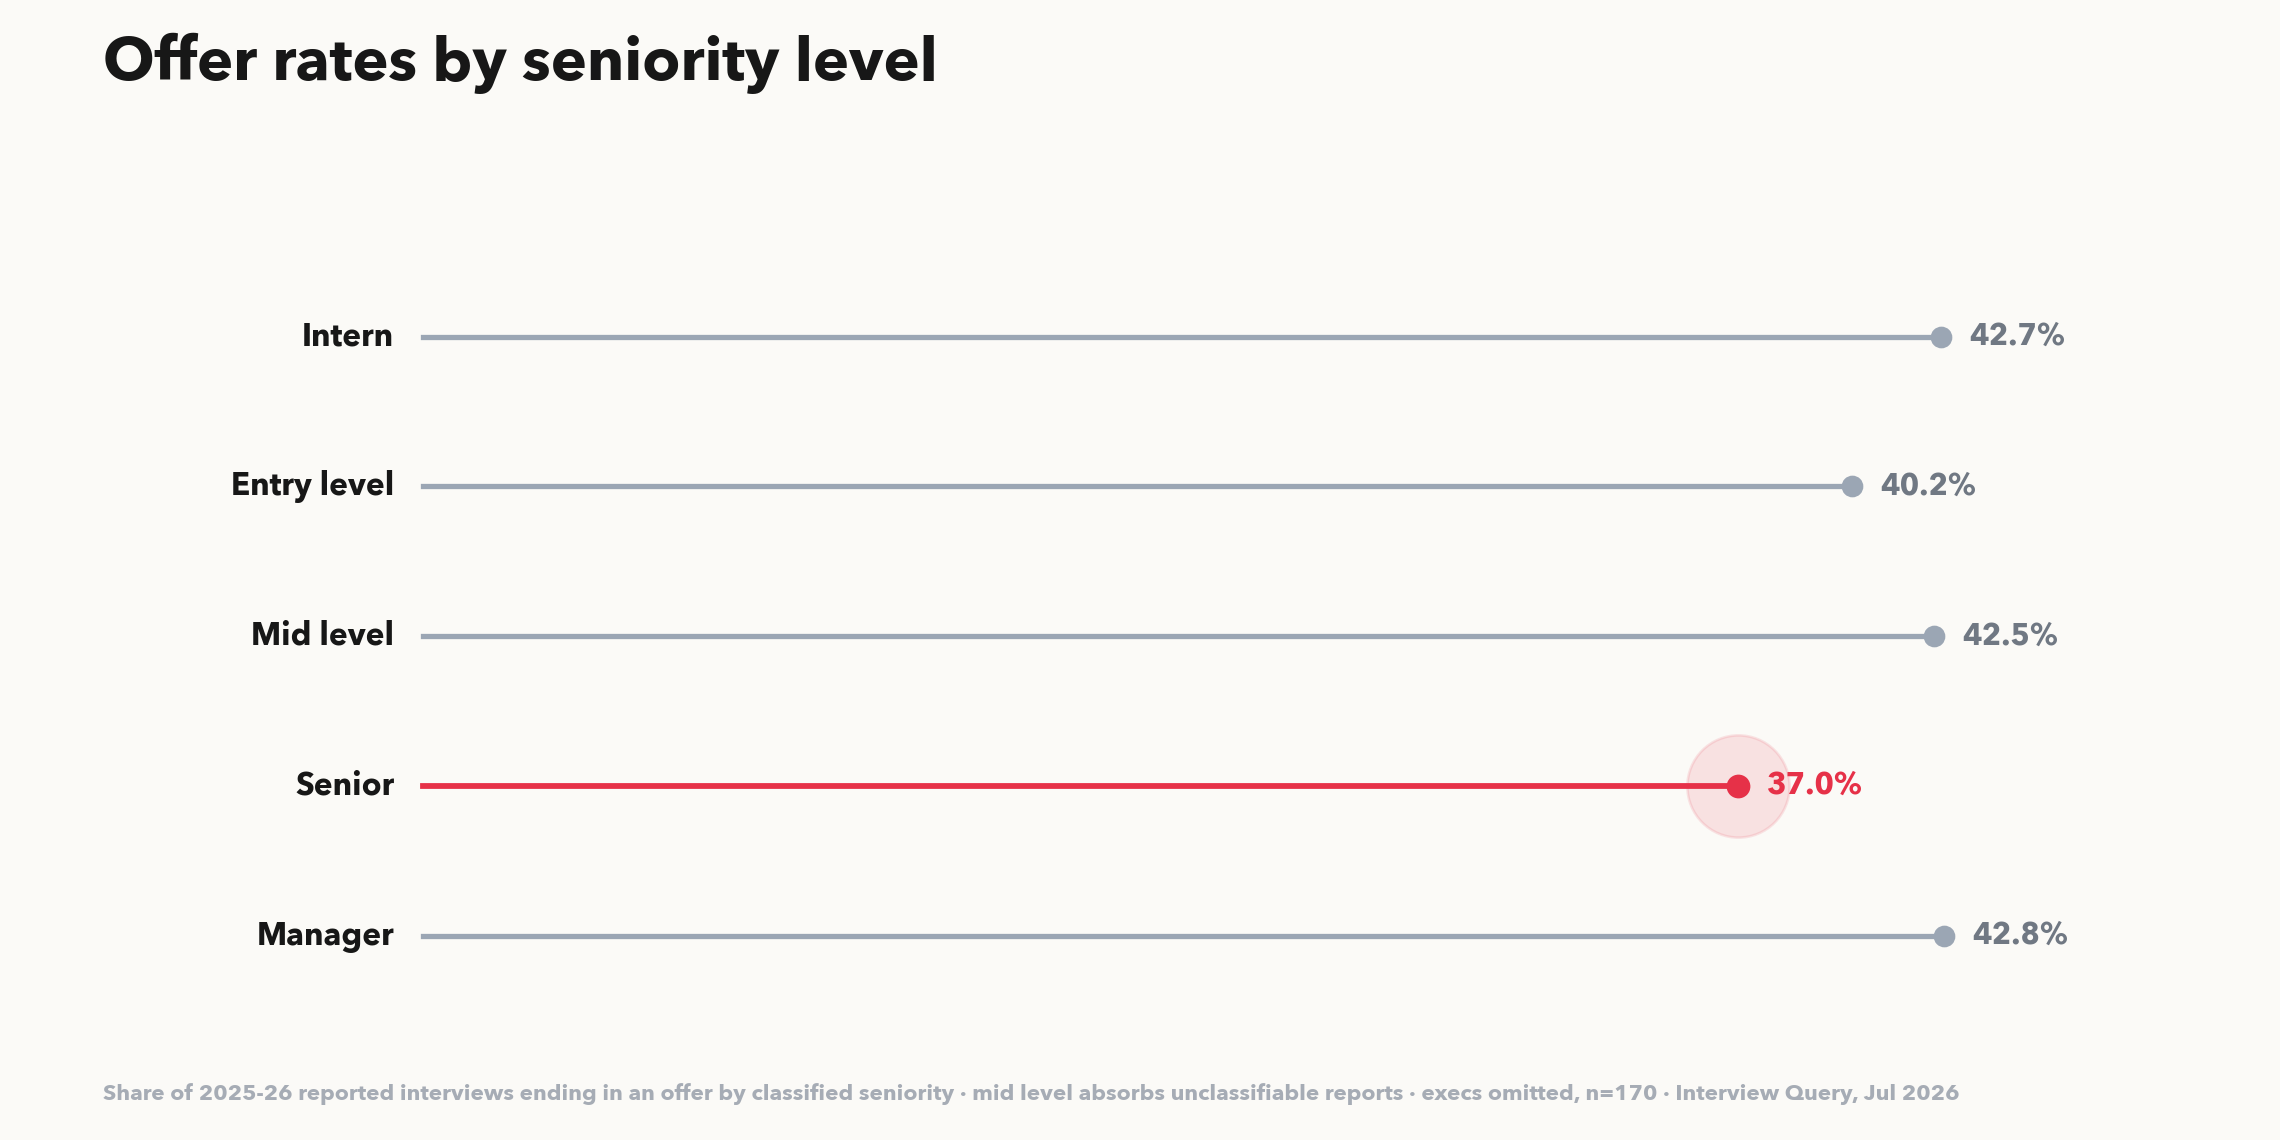
Interns, entry-level candidates, mid-level and managers all convert at 40 to 43%. Seniors are actually lowest at 37%. Once you are in the room, your odds are about the same as anyone’s. The entry-level crisis is not happening inside the interview. It is happening upstream, in getting the interview at all.
Candidates are saying no less often
The share of reported offers that candidates declined climbed every single year for a decade: 13.6% in 2015 up to a peak of 27.2% in 2024. Then it turned. 26.2% in 2025, 23.1% in 2026. That is the first sustained drop in the dataset, four points off the peak in two years.
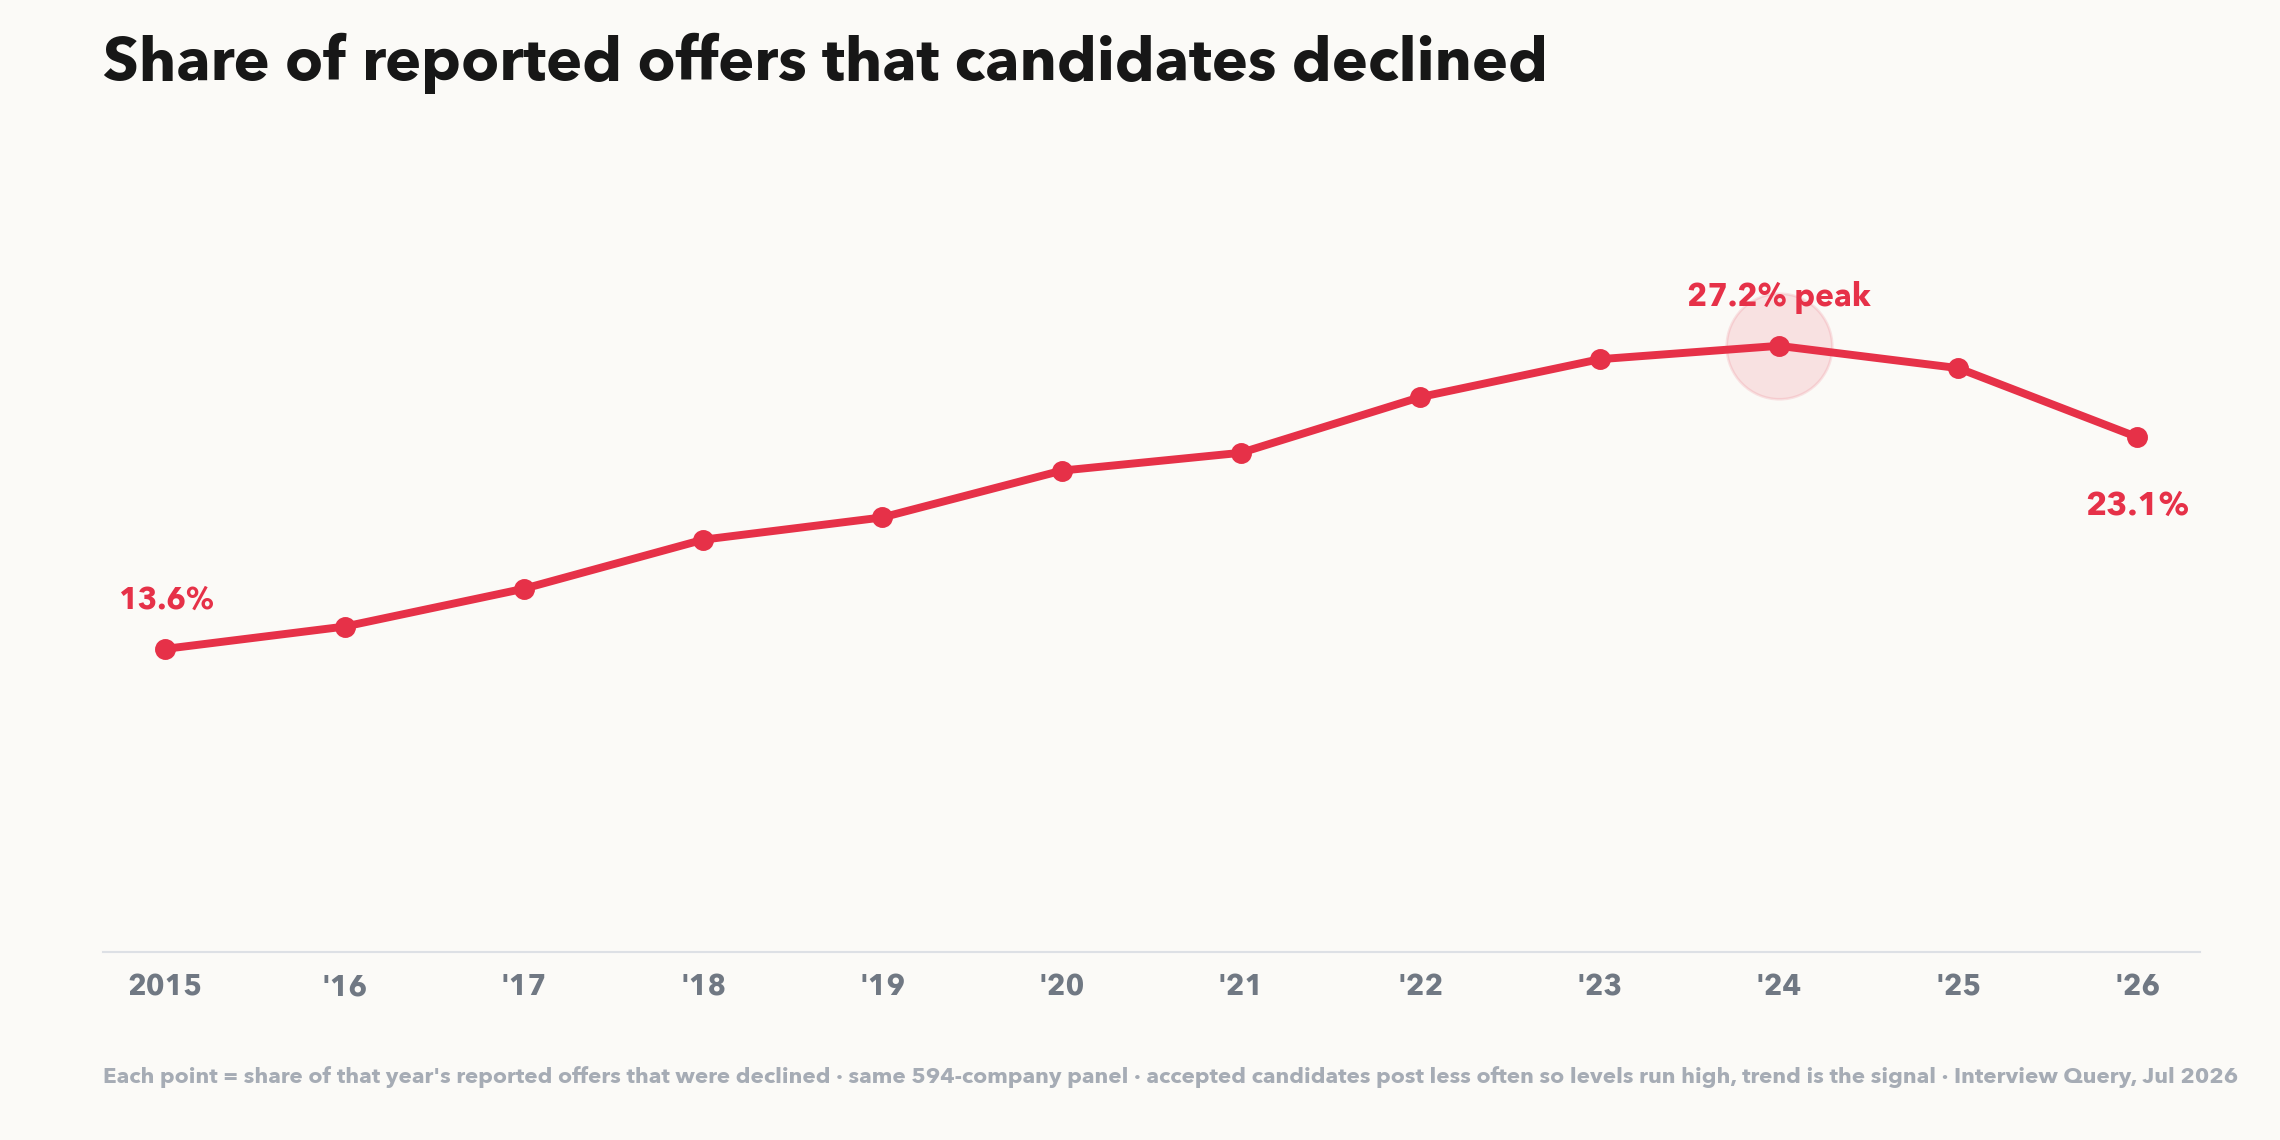
Read together with the offer-rate chart, the picture is grim on both ends. Companies are extending fewer offers, and candidates can no longer afford to turn down the ones they get. Fewer parallel processes, fewer competing offers, less ability to say no.
Why is the rate still ten points above 2015? We checked whether it was a mix effect, more junior candidates back then, and the data says no. Interns actually make up a larger share of offers from reported experiences now than back in 2015.
The rise instead happened inside every single role group. We hypothesize that the 2015 candidate applied to a handful of companies, while today’s candidate runs many parallel processes, one-click applications, remote roles, and comp packages worth shopping. Even a weak 2026 market has more multi-offer candidates than 2015 ever did. What’s missing is the potential larger share of candidates that fail to get even one offer.
AI companies vs the industry
How hard are AI-native companies interviews compared to traditional big tech?
On average, it is basically a tie. AI-native companies (OpenAI, Anthropic, xAI, Mistral, Perplexity, Waymo and the smaller labs) convert 22% of reported tech-role interviews into offers. Big tech converts 24%. The naive version of this comparison makes AI companies look twice as hard, but that is a role-mix trick: big tech’s numbers include retail and operations roles that convert high.
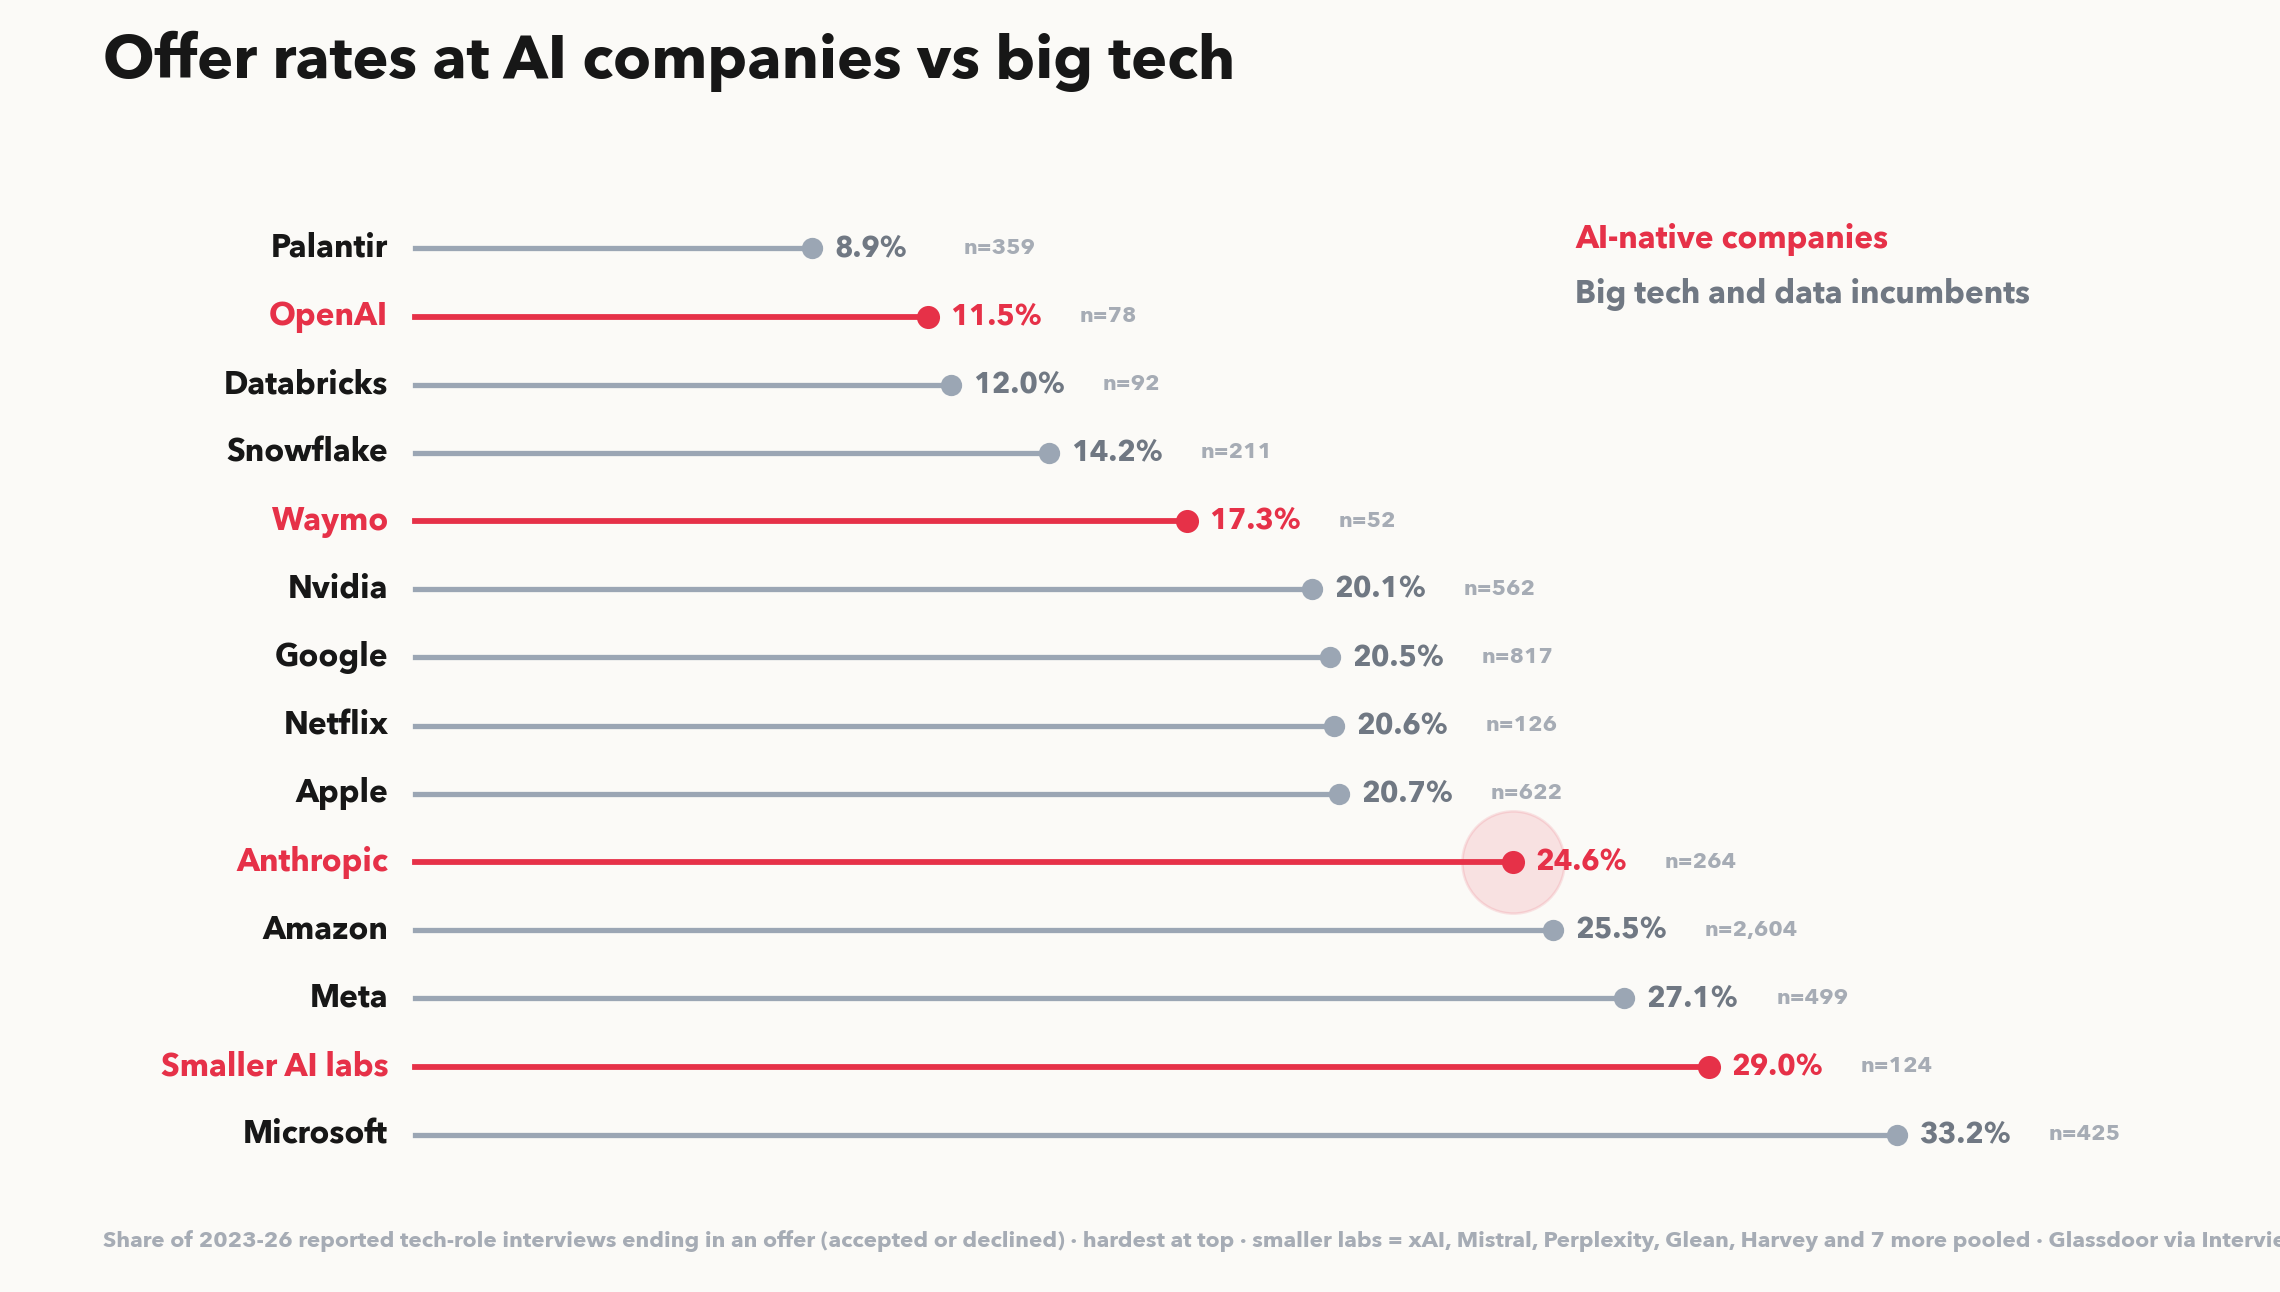
Only 9% of candidates interviewing at Palantir end up with an offer, against 33% at Microsoft. And OpenAI and Anthropic sit on opposite ends of the spectrum: 11.5% of reported OpenAI interviews end in an offer versus 24.6% at Anthropic. We would resist reading raw difficulty into that alone. A low offer rate can also mean a company screens resumes loosely and lets more people into the room, while a high one can mean the screen upstream is brutal and the interview merely confirms it.
Where Anthropic is truly on its own is what happens after the offer:
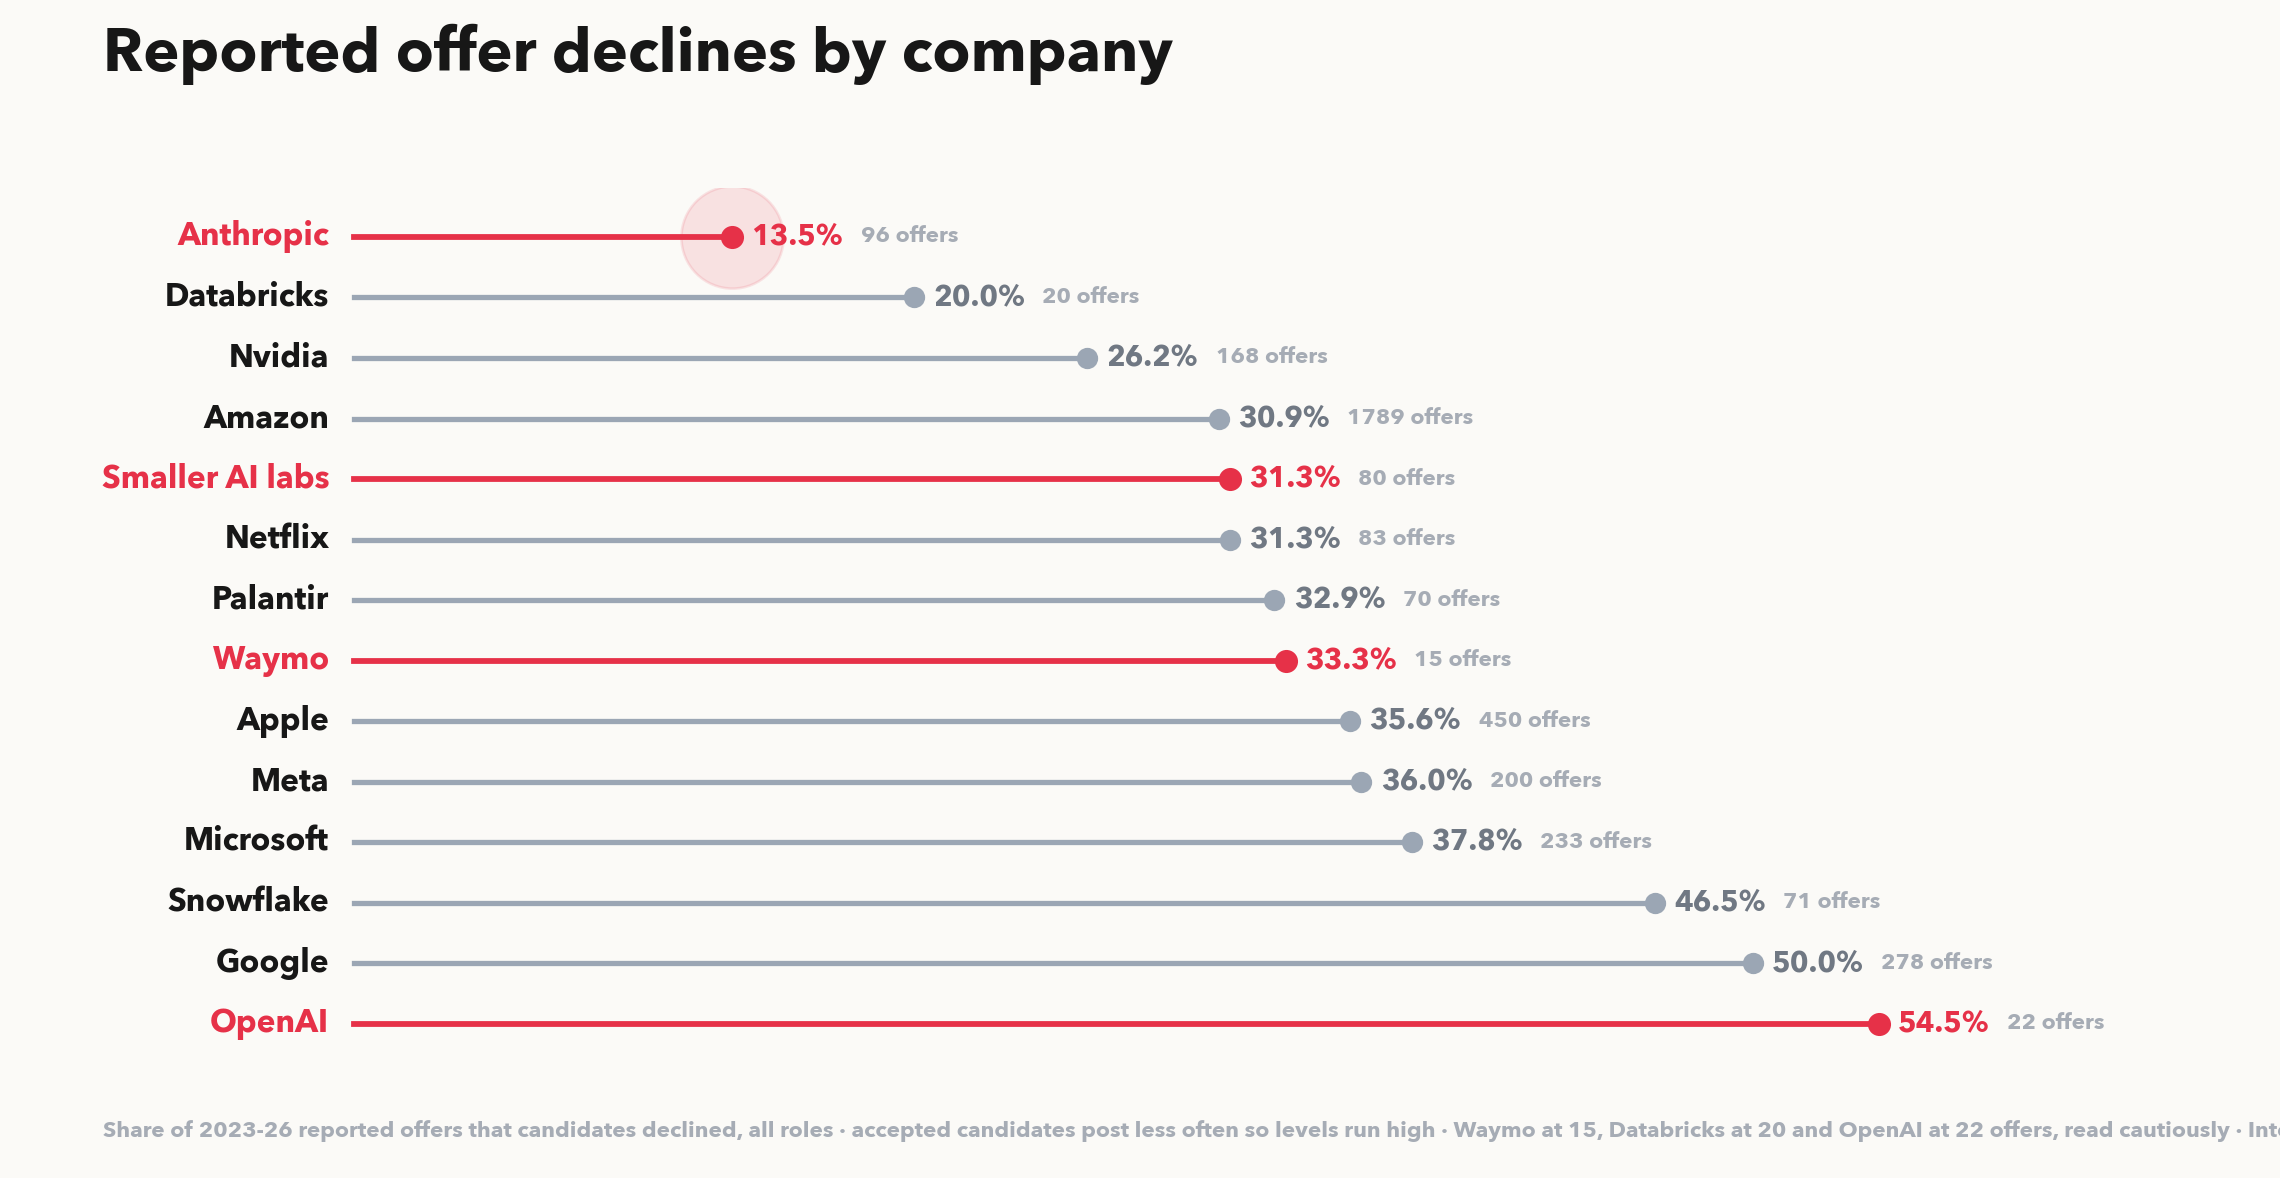
Anthropic leads the industry with 86.5% of reported offers accepted, and for engineering and research roles specifically, 95%. Nobody else is close. OpenAI sits at the other pole: barely 45% of candidates who report receiving an OpenAI offer actually join.
One theory: anyone who can pass OpenAI’s interview can probably pass Anthropic’s too. When candidates hold both offers, it seems as though most technical candidates prefer Anthropic.
The split gets sharper when you separate technical from business roles:
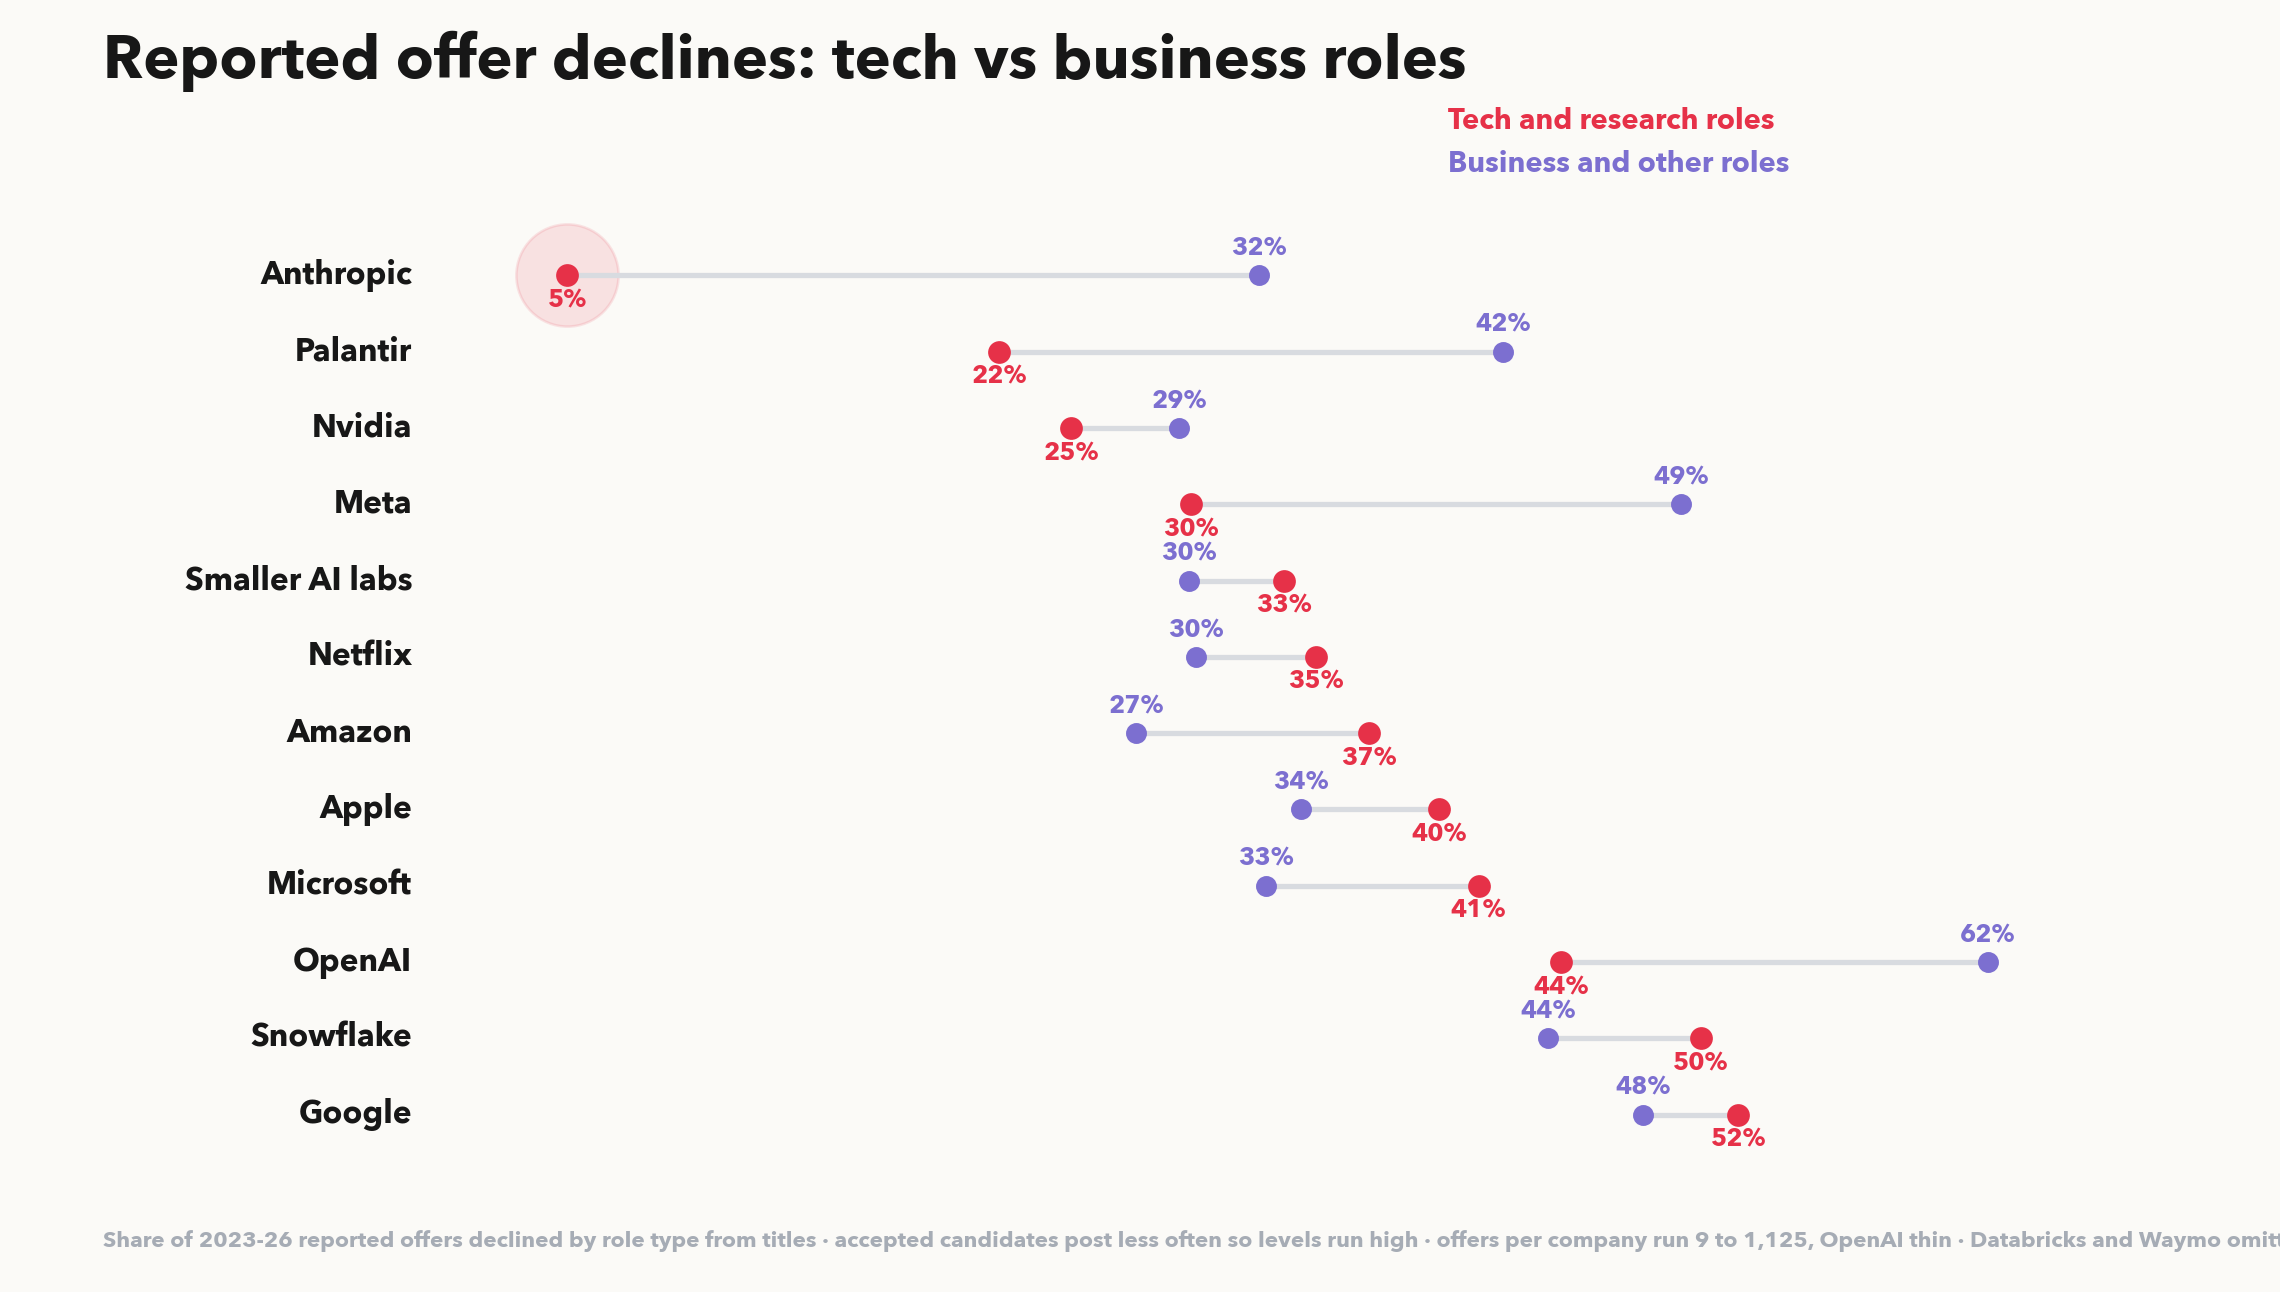
At Anthropic, engineers almost never say no (5% declines) while business and design candidates decline at normal-company rates (32%). Big tech runs the opposite direction: Amazon, Apple and Microsoft engineers decline more than their business counterparts, because engineers are the ones shopping multiple offers. Google gets turned down about half the time by everyone.
One honest flag on this whole section. We ran these numbers past a friend at one of these companies, and he told us the decline rate for his employer is significantly lower than what we show. He is almost certainly right.
People who accept an offer and start a new job mostly do not go write up their interview process online; people who declined or got rejected do. So every decline rate on these charts runs high. The levels are inflated, but the comparisons between companies are the signal, and an outlier like Anthropic’s near-zero engineer declines survives the bias, because a floor cannot be faked by who chooses to post.
What this means if you are interviewing
The interview itself is not where the market broke. Conversion fell everywhere, but the bigger shifts are upstream, in how few interviews are handed out, and downstream, in how little leverage candidates have once an offer lands. If you get an offer in this market, the data says you will probably take it. Everyone else is.
Methodology
Interview reports from Glassdoor and Interview Query, 1.2M in total, 2015 through July 2026. Headline trend computed on a fixed panel of 594 companies (385k reports) to eliminate sample-composition effects; we verified there is no posting-lag bias by comparing identical interview cohorts scraped months apart. All rates are among reported interviews: rejected and declining candidates post more than accepters, so offer rates run low and decline rates run high relative to reality. Trends and comparisons are robust to this; absolute levels should be read as directional. Roles are classified from position titles. 2026 figures are year-to-date through July.