

Meta Data Scientist Interview Guide: Process, Questions & Preparation Tips (2025)


Introduction
If you’ve ever wondered what it’s really like to interview for a data scientist role at Meta, you’re not alone. Every year, thousands of candidates, from analytics pros to research scientists, apply to join one of the most data-driven ecosystems in tech.
At Meta (home to Facebook, Instagram, WhatsApp, and Threads), data scientists shape how billions of people experience products. From optimizing News Feed engagement to improving ad performance, every decision comes back to data.
This guide walks you through everything you need to know to prepare for a Meta data scientist interview, from the structure of each interview round to the types of questions asked across product, analytics, and machine learning tracks. You’ll learn how Meta evaluates candidates for technical depth, problem-solving, and business impact, along with sample questions, frameworks, and preparation tips used by successful hires. Whether you’re applying for a core data science, product analytics, or experimentation role, this guide will help you understand what to expect and how to stand out in every stage of the process.
What Makes the Meta Data Scientist Role Unique
Meta’s data scientists sit at the intersection of product, engineering, and strategy. You’re expected to think like an analyst, code like an engineer, and reason like a product manager. That blend of analytical execution and product sense is what defines success at Meta.
Unlike many companies where DS teams are siloed, Meta embeds its data scientists directly within product teams. That means you might spend one week defining success metrics for a new feature, and the next week designing an A/B test to measure its impact. You’ll collaborate closely with PMs, engineers, and designers to ask: “What’s the real signal here?”
Tip: Meta loves when candidates think about why metrics matter, not just how to calculate them. During your interview, be ready to explain what drives user behavior behind the data.
Understanding Meta’s Culture
Meta’s culture is fast, experimental, and transparent. The motto “Move fast” isn’t just a slogan—it’s how the company ships features, tests ideas, and learns from failure.
Teams are encouraged to experiment, take ownership, and back opinions with data. Even as a new hire, you’re expected to bring ideas to the table and defend them with evidence. The hierarchy is flat, and feedback—both giving and receiving is part of everyday work life.
Candidates who succeed here are those who:
- Are comfortable with ambiguity and iteration
- Can tell a story with data that connects numbers to user outcomes
- Are collaborative, balancing technical rigor with empathy for end users
In short, Meta looks for data scientists who not only crunch data but also influence decisions. If you’re the kind of person who thrives on measurable impact and wants to see your analysis shape products used by billions, Meta might be your place.
Interview Process Breakdown: Stages and Expectations
The Meta data scientist interview process is structured, challenging, and refreshingly transparent. While it’s designed to test your technical depth, what Meta really wants to see is how you think and break down complex problems, prioritize, and communicate insights clearly.
Let’s walk through what to expect at each stage and how to approach it confidently.
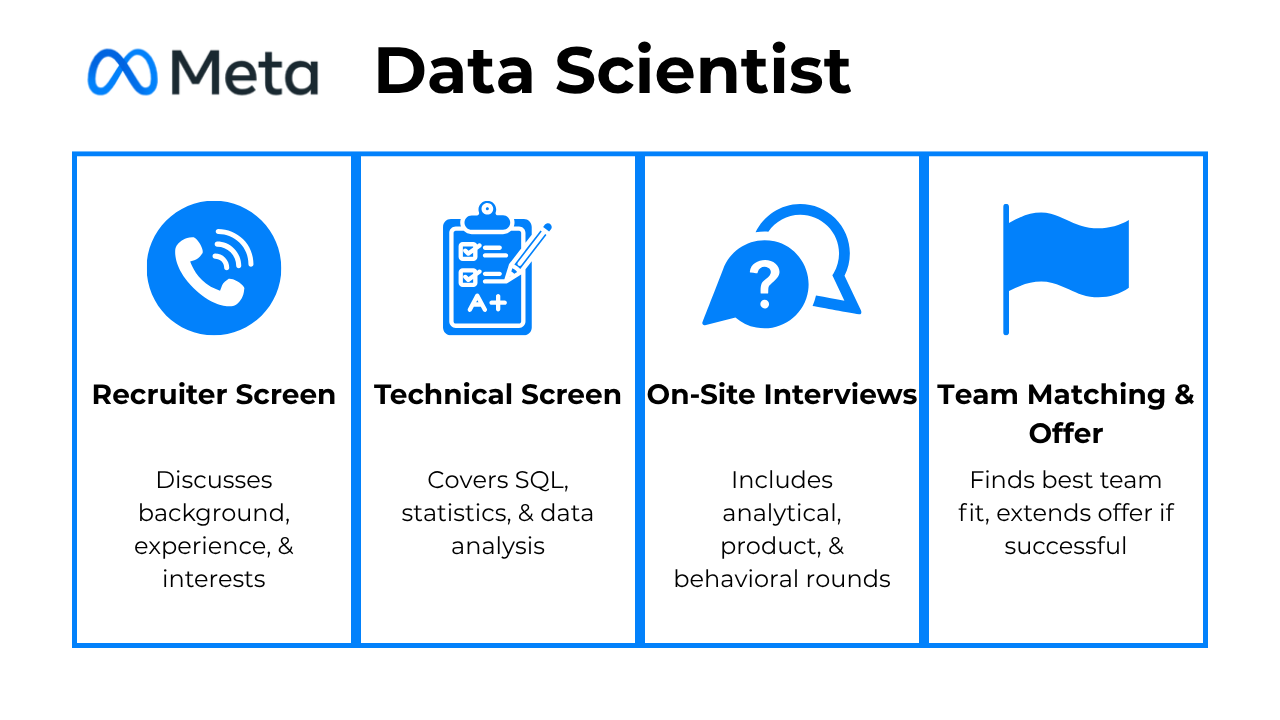
Recruiter Screen: Setting the Stage
Your first interaction is typically a call with a recruiter from Meta’s data science team. This conversation is not deeply technical. It focuses on role fit, expectations, and alignment with Meta’s product-driven data culture.
You will likely discuss your background in data science or analytics, experience with SQL, experimentation, and metrics, interest in specific Meta products or teams such as Instagram Growth or Ads Analytics, and your timeline and compensation expectations.
The recruiter’s goal is to confirm that your profile aligns with Meta’s data science roles and that you understand the product landscape. They will also outline the interview process and share preparation guidance for the next stages.
Tip: Treat this as a two-way conversation. Showing curiosity about Meta’s products and data challenges, such as how you would measure engagement on Reels or evaluate Ads performance, helps demonstrate product awareness.
Technical Screen: Core Skills in Action
The technical screen evaluates your foundational skills before you move into the full interview loop. Candidates typically complete one to two interviews at this stage, each lasting around 45 minutes.
Some candidates report that this stage begins with a product case before moving into SQL. The product case is often framed around a fictional app scenario and is used to assess structured thinking around metrics, experimentation design, and risk analysis. Interviewers expect candidates to clearly define success metrics, identify guardrails, and reason through potential tradeoffs or unintended consequences.
After the product discussion, the interview transitions into SQL and analytical problem solving. This portion may involve live problem solving in a shared document or editor and commonly covers SQL query writing and debugging, metric calculations, and data interpretation tied back to experimental results.
Due to time constraints, candidates may not always complete a full SQL query. In these cases, interviewers may ask you to verbally walk through your intended query logic, including how you would structure joins, filters, and aggregations. Clear explanation and logical sequencing are emphasized more than syntax completion.
Recent candidates noted that fluency with SQL window functions remains especially important at this stage. Interviewers expect comfort with ranking, running aggregates, and partitioning logic, along with the ability to explain each step clearly under time pressure.
Tip: Think out loud throughout the interview. Clearly explaining your reasoning, assumptions, and intended approach is just as important as arriving at a correct final answer.
Onsite or Final Interviews: Product and Analytics Deep Dive
Candidates who pass the technical screen move on to the onsite or virtual final loop. This stage typically includes four to five interviews that go deeper into analytics, product thinking, and collaboration.
Some candidates report a dedicated SQL round during the full loop that includes three to four questions. These problems require strong command of window functions, time-based aggregations, and readable query structure. Interviewers focus on both correctness and how clearly you communicate your logic as you work.
The analytical execution round places less emphasis on memorizing formulas and more on statistical intuition. Candidates are asked to reason about distributions, sampling behavior, and why a metric might change, often verbally. Strong answers connect these concepts back to product decisions rather than relying on heavy calculations.
Additional rounds focus on product sense, experimentation design, and behavioral scenarios. Questions are typically grounded in real Meta products, such as evaluating engagement changes or diagnosing unexpected metric shifts.
Tip: Treat each question as a product story. Show how your analysis would influence a decision, explain tradeoffs, and tie statistical reasoning back to user and business impact.
Team Matching and Offer Stage
After successfully completing the core interviews, candidates move into team matching. You will meet with potential hiring managers from different teams to assess mutual fit based on interests, strengths, and working style. Once a strong match is identified, Meta extends a formal offer outlining compensation and benefits.
Tip: Be clear about what types of problems and products excite you. Specific examples help teams understand where you will thrive.
After the Offer: Background Check and Onboarding
Once you accept the offer, Meta conducts a background check and begins onboarding. New hires typically participate in a data science bootcamp designed to introduce internal tools, datasets, and experimentation frameworks. You will also connect with mentors and peers across teams.
Tip: Use onboarding to learn how different teams interpret metrics and run experiments in practice. Early exposure to Meta’s data culture helps accelerate long-term impact.
Challenge
Check your skills...
How prepared are you for working as a Data Scientist at Meta?
Types of Interview Questions Asked at Meta
When you prepare for a Meta data scientist interview, it’s not enough to just “know SQL” or “understand A/B testing.” Meta’s interviews are crafted to uncover how you think analytically, reason about products, and communicate decisions.
Let’s break down the major question types you’ll face, and how to ace each one.
Analytical Execution Interview Questions
Analytical execution questions evaluate how well you transform data into insights. They’re designed to test your ability to frame hypotheses, perform structured analysis, and extract actionable conclusions using SQL, statistics, and reasoning. Recent Meta candidates report that these questions are often delivered in timed formats, with multiple short SQL and Python exercises focused on data manipulation rather than complex algorithms.
Expect business-oriented scenarios where you analyze engagement patterns, feature performance, or user behavior, emphasizing logic, clarity, and measurable impact.
Tip: Think out loud and explain your logic step by step. Meta interviewers care more about how you reason through a problem than the final number you produce.
Engagement dropped after a Facebook UI update. How would you investigate?
Start by defining which engagement metrics dropped, such as likes, comments, or time spent. Compare pre- and post-update cohorts using time-series or retention analysis. Segment by platform (iOS vs Android) or geography to isolate the issue. Use funnel or correlation analysis to identify where users disengage, and suggest experiments or surveys to validate hypotheses.
Tip: Always connect data changes to user experience, showing that you understand how product updates can alter real behavior.
A campaign increased total sessions but reduced session length. How do you interpret this?
Validate the data first, ensuring consistent definitions for “session” and “length.” Analyze whether new or low-intent users joined after the campaign, which might explain shorter sessions. Use cohort or percentile analysis to check if heavy users stayed consistent while casual users increased.
Tip: Meta appreciates when you balance metrics with behavioral insight, explaining not just what changed but why it matters.
How would you evaluate the success of a new friend recommendation algorithm?
Define clear success metrics like accepted friend requests, follow-up interactions, and long-term retention. Run an A/B test comparing users exposed to the new algorithm versus control. Ensure you measure downstream engagement, not just click rates, to capture lasting user value.
Tip: Highlight how you’d design metrics that align with meaningful outcomes rather than vanity metrics like clicks or impressions.
Your DAUs dropped 10% overnight, but ETL logs are clean. What’s your next step?
Start by checking data freshness and schema consistency. Cross-validate numbers between different sources (e.g., internal dashboards vs raw logs), like dashboards or logs. If the data pipeline is fine, segment by region, platform, or feature usage to detect localized trends or bugs.
Tip: Show that your debugging approach is methodical and hypothesis-driven, not based on assumptions or guesswork.
Two dashboards report conflicting engagement numbers. How do you resolve it?
Review metric definitions and confirm how each dashboard calculates engagement. Trace data lineage through SQL transformations or aggregation logic. Coordinate with data engineers or analysts to align on definitions before reconciling discrepancies.
Tip: Meta expects you to collaborate, so mention discussing with engineers or analysts to align definitions before fixing the discrepancy.
Product Sense Interview Questions
Product sense questions reveal how you think like a decision-maker. Meta wants to see if you can connect data to user experience, define success metrics, and reason through trade-offs. You’ll be challenged to interpret behavior patterns, propose new metrics, and explain how your findings would influence a product or feature.
Tip: Always tie your answer back to the user journey. Meta loves candidates who blend empathy with data-driven logic.
How would you measure what percentage of Facebook stories are fake news given 24 hours?
Start by defining “fake news”, for example, unverified content, spam, or misinformation. Collect data using content classification models, user reports, or fact-checking APIs. Use engagement metrics, share patterns, and account authenticity as signals. Combine these to estimate the percentage within the time frame.
Tip: Clarify definitions early and acknowledge that measurement depends on evolving definitions and imperfect detection methods.
Given customer spending data, how would you determine the next partner card?
To determine the next partner card, analyze customer transaction data by grouping spending by merchants and identifying high-spending merchants without existing partnerships. Consider metrics like average transaction price and frequency to optimize for recurring spending. Additionally, examine year-over-year growth trends to forecast future high-spending merchants and conduct external research to identify merchants popular outside the current dataset for customer acquisition.
Tip: Focus on connecting analytical insights to business outcomes, your reasoning should reflect how this decision impacts user behavior and revenue.
If you were analyzing Instagram Reels, what would be your core success metrics?
You’d start with user-centric metrics like watch time, completion rate, shares, and replays. Then connect them to business outcomes like creator retention or ad impressions. Talk about lagging vs. leading metrics. Meta values clarity in defining what success means and tying it back to user satisfaction.
Tip: Explain how each metric maps to product health and why it captures true user satisfaction instead of vanity growth.
If likes disappeared from Facebook tomorrow, how would you measure impact?
Frame hypotheses about behavior (posting frequency, sentiment, time spent). Compare active users and post frequency before and after removal. Consider indirect metrics like comment tone or content diversity.
Tip: Show that you think beyond metrics and consider psychological and social dynamics that shape engagement and community health.
What data would you analyze to understand if a feature improves user happiness?
Combine quantitative metrics (retention, engagement time, session frequency) with qualitative data (surveys, sentiment analysis, NPS). Correlate behavior changes with shifts in user sentiment to confirm the feature’s impact.
Tip: Demonstrate a balanced approach by blending metrics and human feedback, proving that you can translate data into real user understanding.
Design a spam detection system for WhatsApp
This question evaluates your ability to think end to end about a real-world product problem. Candidates are expected to discuss problem framing, feature signals, model choice, offline and online evaluation metrics, and how experimentation would be run to validate impact while minimizing false positives that affect user experience.
Investigate an increase in average comments per article from 5 to 7
This question tests your ability to reason about metric changes beyond surface-level interpretation. Interviewers look for structured thinking around distribution shifts, user behavior changes, segmentation, potential confounders, and how you would validate whether the change reflects real engagement growth or a measurement artifact.
How would you measure notification effectiveness for a social travel app?
Interviewers expect a clear articulation of primary engagement metrics, supporting guardrail metrics, and risks such as notification fatigue or increased unsubscribe rates. Strong answers balance short-term engagement lifts with longer-term user experience considerations.
A/B Testing and Experimentation Interview Questions
Meta runs thousands of experiments daily. Experimentation questions test how you design, interpret, and validate experiments in a real-world context. You’ll need to identify potential biases, interpret test results, and explain when data can or cannot be trusted. These questions assess whether you can balance statistical rigor with business practicality.
Tip: Meta values experimenters who are both scientific and pragmatic, so validate assumptions, interpret results critically, and never treat statistical significance as the full story.
How would you assess the validity of the result in an AB test?
To assess the validity of the result, first ensure that the user groups were properly separated and randomly bucketed to avoid biases. Next, confirm that the variants were equal in all other aspects except the tested feature. Additionally, evaluate the measurement process, including sample size, duration of the test, and whether the p-value was monitored continuously, as this can lead to false positives or negatives. Finally, determine the minimum effect size and compute the required sample size and duration before starting the experiment to ensure statistical reliability.
Tip: Always validate test setup before interpreting results so your conclusions are grounded in sound experimental design.
-
To set up this test, you would create a multivariate test with four variants: red button at the top, red button at the bottom, blue button at the top, and blue button at the bottom. Randomly assign users to each variant and calculate the sample size needed to reach statistical significance. Alternatively, chaining A/B tests could be considered, but this approach would not account for interaction effects between the variables.
Tip: Mention how you’d balance experimentation speed and precision, showing that you can adapt testing strategies to business needs.
-
An unbalanced sample doesn’t automatically bias the results, but it increases variance and lowers the smaller group’s statistical power. You’d calculate confidence intervals to verify stability and adjust for unequal group sizes by weighting metrics or resampling. Meta expects you to demonstrate statistical awareness, explaining that bias comes from faulty assignment, not size disparity, and that reliable inference depends on balanced randomization and adequate sample power.
Tip: Emphasize that strong randomization, not equal size, prevents bias, showing that you understand the mechanics behind reliable experimentation.
What if an A/B test shows a statistically significant 1% lift but minimal business impact?
Discuss effect size and scalability. A 1% lift might translate to millions of active users at Meta’s scale. Alternatively, if the feature is costly, the ROI may not justify rollout. Meta looks for contextual reasoning, interpreting data within business constraints.
Tip: Frame your answer around opportunity cost and scalability to show that you think beyond numbers and consider business value.
Design an A/B test for user notifications
This question evaluates your ability to structure an experiment end to end. Candidates are asked to explain randomization strategy, justify stratification using historical user behavior, and reason about evenly distributing power users across control and treatment groups to avoid bias.
Your A/B test increased engagement but lowered satisfaction survey results. What’s next?
Investigate segment-level effects to see which users benefited and which didn’t. Examine temporal trends like short-term spikes may reflect novelty effects, while satisfaction drops could signal long-term fatigue. You might run a follow-up holdout test or monitor key sentiment metrics over several weeks. Meta values critical thinking, recognizing that immediate gains may harm long-term trust.
Tip: Highlight how you’d integrate both quantitative and qualitative insights, showing that you balance data interpretation with user empathy.
Watch Next: A/B Testing Interview with a Google Data Scientist
This video features Sandeep, an ex-Google data scientist answering an A/B testing interview question about how financial rewards affect survey response rates. The discussion walks through diagnosing unexpected experiment outcomes, identifying design flaws like sample ratio mismatch or poor randomization, and improving test validity. It’s an excellent watch for refining your experimental reasoning and hypothesis-testing skills, especially if you’re preparing for product-sense or data experimentation rounds at Meta.
SQL and Python Data Manipulation Interview Questions
SQL questions assess your ability to extract and manipulate data efficiently. You’ll write queries that join, aggregate, and filter large datasets, often involving user sessions, engagement events, or retention metrics. The focus is on accuracy, readability, and logical structure over pure speed.
Recent technical screenings for Meta Data Scientist and Data Engineer roles have included a structured format of five SQL questions and five Python questions, each with strict 25-minute limits. These exercises emphasize clean data manipulation, logical correctness, and speed over advanced algorithm design.
Tip: Always think in terms of scalability and maintainability. Meta’s interviewers value clean, efficient solutions that mirror real-world data workflows.
Write a query to get the average commute time for each commuter in New York
To solve this, use two subqueries: one to calculate the average commute time for each commuter in New York grouped by
commuter_id, and another to calculate the average commute time across all commuters in New York. Use theTIMESTAMPDIFFfunction to calculate the time difference in minutes betweenstart_dtandend_dt. Finally, perform aLEFT JOINto combine the results of both subqueries.Tip: Explain why you group and filter data in this order to show your understanding of performance optimization in large datasets.
Create a metric that can validate and rank the queries by their search result precision
To compute the precision metric, start by calculating the average rating for each query using
AVG(rating)grouped by the query column. To incorporate position into the metric, use the inverse of the position as a weighted factor (1/position) multiplied by the rating. This ensures higher weights for top positions.Tip: Relate your metric back to user value. Meta wants to see that you measure precision in ways that enhance user experience.
Compute click-through rates (CTR) across queries
Aggregate impressions and clicks per normalized query using subqueries or CTEs, then compute
clicks / impressionsas CTR. To keep it performant, pre-aggregate by(query_norm, event_time)and ensure proper indexing on those columns. Finally, useEXPLAINto confirm the optimizer avoids full scans. This demonstrates your ability to balance accuracy and performance.Tip: Mention how you’d monitor data freshness and index columns, as Meta values awareness of data quality and runtime optimization.
Given a list of integers, identify all the duplicate values in the list.
This question checks whether you can detect and return duplicate elements from a collection. To solve this, you can use a set to track seen numbers and another set to store duplicates. Iterating once through the list ensures O(n) time complexity. In real-world data engineering, duplicate detection is critical when cleaning raw datasets, ensuring unique identifiers in ETL pipelines, or reconciling records across multiple sources.
Tip: Connect this to real data cleaning scenarios. Meta looks for engineers who can think beyond code to pipeline reliability and deduplication integrity.
-
To solve this, construct a list where each key appears a number of times equal to its weight. Use Python’s
random.choice()to select a key randomly from this list. This ensures the probability of selecting a key is proportional to its weight.Tip: Explain when you’d use this logic in production, such as ranking algorithms or recommendation sampling since Meta values candidates who link solutions to real-world data use cases.
Write a SQL query to compute the average borrowing duration and identify books with more than 10 copies.
To solve this, calculate the borrowing duration using checkout and return timestamps, then aggregate the average duration per book. Join this result with the inventory table and filter for books with more than 10 copies. Meta interviewers focus on clear joins, correct time calculations, and readable grouping logic rather than clever SQL tricks.
Given a list of subjects with scores, select three subjects to maximize the total score.
This question tests basic data manipulation and prioritization. A strong solution uses Python’s built-in sorting or selection methods to efficiently identify the top three values, emphasizing clarity and correctness over custom algorithms.
Given a logbook of book checkout and return events, detect invalid entries such as returns without a prior checkout.
This problem evaluates your ability to validate event sequences and track state. Interviewers look for clean logic that correctly flags inconsistent events while handling edge cases like duplicate actions or missing records.
Given nested dictionaries of office locations and employee allocations, reassign employees when a location closes.
This question tests how you traverse and modify nested data structures. A good answer updates the data safely, preserves consistency, and produces a predictable output, often using clear iteration patterns or helper functions.
Statistics and Probability Interview Questions
Statistics questions evaluate your understanding of inference and uncertainty. You’ll apply hypothesis testing, confidence intervals, and probability concepts to analyze experiments or performance metrics. Meta interviewers look for clear, contextual statistical reasoning rather than memorized formulas.
Tip: Meta loves when candidates use real-world intuition. Don’t just define terms, explain what the outcome means for the product or user experience.
Write a function to rotate an array by 90 degrees in the clockwise direction.
To rotate a matrix 90 degrees clockwise, first transpose the matrix and then reverse the order of its columns. Transposing swaps rows and columns, while reversing columns achieves the desired rotation. This approach is efficient and leverages simple matrix transformations.
Tip: Mention that understanding matrix operations is relevant for optimization or modeling tasks, showing that you can connect logic to machine learning foundations.
Find how much overlapping jobs are costing the company.
To solve this, simulate the scenario by generating random start times for two jobs within the 300-minute window (7 pm to midnight) and check for overlaps. Repeat the simulation
Ntimes to estimate the probability of overlap, then multiply this probability by the annual cost factor (365 days * $1000 per overlap) to get the estimated annual cost.Tip: Highlight that simulation and estimation techniques show creative problem-solving, something Meta values for real-world uncertainty handling.
Explain Type I and Type II errors with context.
A Type I error means shipping a bad change (false positive), while a Type II error means missing a good one (false negative). For instance, if you mistakenly believe a new feed ranking increases engagement when it doesn’t, you’re committing a Type I error. Meta wants you to explain statistical trade-offs in human terms of how false conclusions affect real users and product outcomes.
Tip: Tie your explanation to product experimentation decisions, showing that you understand the business impact of statistical choices.
Variance in a metric is high. What do you do?
Begin by identifying sources of variance—seasonality, user heterogeneity, or measurement noise. Then segment users (e.g., new vs. returning), remove outliers, or apply data transformations like log-scaling. You can also use bootstrapping to estimate confidence intervals more robustly. Meta appreciates candidates who approach noisy data methodically and articulate uncertainty with confidence.
Tip: Meta appreciates when you quantify your reasoning, so explain how reducing variance leads to more confident and actionable insights.
When is a statistically significant effect not practically significant?
When the sample size is huge, even tiny, meaningless differences can appear significant. For instance, at Meta’s scale, a 0.1% engagement lift could be statistically real but irrelevant to user happiness or business value. Explain how you’d compare effect size against operational cost or strategic value. Meta looks for judgment to know when to act on data and when to hold back.
Tip: Emphasize that Meta values data scientists who balance statistical precision with business relevance and decision-making clarity.
Behavioral and Collaboration Interview Questions
Behavioral questions explore how you work with others, communicate insights, and handle challenges. Meta values collaboration and influence, so expect to discuss past situations where you resolved conflicts, aligned teams, or made data-driven recommendations that impacted product direction.
Tip: Use the STAR format (Situation, Task, Action, Result) — it keeps your stories sharp and measurable.
Describe an analytics experiment that you designed. How were you able to measure success?
In a Meta context, this question is often about demonstrating your ability to design robust, scalable experiments that drive product decisions. You might describe designing an A/B test to evaluate the impact of a new ranking algorithm on user engagement within the News Feed.
Success would be measured through metrics like time spent, click-through rates, or meaningful social interactions. You should explain how you set up the control and treatment groups, ensured randomization, and accounted for bias or variance.
Tip: Mention tools like Hive, PyTorch, or Meta’s internal experimentation platforms, and show how you used p-values or confidence intervals to validate findings and inform product rollout decisions.
-
At Meta, stakeholders range from product managers to engineers and designers, and they often have different levels of technical fluency. You could describe a time when you presented a complex causal inference model, but the team found it too abstract.
To overcome this, you simplified the narrative using data visualizations and drew parallels to user behavior they were more familiar with. You might mention how you scheduled follow-ups or embedded yourself in sprint reviews to build context.
Tip: Emphasize how this experience improved your stakeholder management and ultimately helped align teams on the insights and next steps.
Why Do You Want to Work With Us
For a data scientist role at Meta, you should go beyond generic enthusiasm. Highlight how Meta’s commitment to open science, large-scale experimentation, and infrastructure for data scientists aligns with your interests.
For example, you could mention your excitement about working on products that impact billions of users or the opportunity to contribute to innovations in content discovery, trust and safety, or generative AI. Be specific about how Meta’s scale and emphasis on measurement excellence match your goals. This is also a good place to reflect on Meta’s core values like “Focus on Long-Term Impact” or “Move Fast.”
Tip: Show that you’ve researched Meta’s recent initiatives and can clearly link them to your personal values or past experiences since genuine alignment stands out.
Describe a data project you worked on. What were some of the challenges you faced?
This is a chance to show your ability to drive a project end-to-end. For a Meta role, you could describe working on a project where you built a machine learning model to predict user churn or optimized a recommendation pipeline.
Explain the technical scope, like data ingestion with Presto, model training using PyTorch, and how you collaborated with product teams to define success. Then describe real-world challenges, like maybe you faced incomplete logging or had to backfill data to simulate historical results. Talk about how you navigated ambiguity, validated your approach with stakeholders, and iterated to ship a solution that drove measurable impact.
Tip: Highlight your problem-solving process and how you worked across teams to deliver measurable business impact since Meta values ownership and cross-functional execution.
Average Meta Data Scientist Salary & Negotiation Strategies
Meta’s compensation philosophy is simple: reward data-driven impact at the top of the market.
Data scientists at Meta are among the best-paid across FAANG, with packages that combine strong base salaries, annual bonuses, and equity grants that grow substantially over time.
Your total compensation depends on your IC level (individual contributor level), experience, and location. Most data scientist candidates interview at IC4–IC6, with IC7 reserved for senior or principal scientists who lead cross-functional analytics or machine learning initiatives.
Tip: Always confirm your IC level early in the process. It determines your compensation band, project scope, and career trajectory inside Meta.
Estimated Meta Data Scientist Salary Bands (2025)
| Level | Typical Role Title | Total Compensation Range (USD) | Breakdown |
|---|---|---|---|
| IC3 | Associate / Entry-Level Data Scientist | $170K – $220K | Base $130K–$160K + Bonus + RSUs |
| IC4 | Data Scientist | $220K – $310K | Base $160K–$200K + Bonus + Equity |
| IC5 | Senior Data Scientist | $310K – $420K | Base $200K–$240K + High RSUs |
| IC6 | Staff / Principal Data Scientist | $420K – $600K+ | Base $240K+ + Substantial Equity |
| IC7 | Director / Lead Data Scientist | $600K – $800K+ | Base $260K+ + Executive Equity + Performance Bonus |
Note: Salary estimates are based on aggregated data from Levels.fyi, Blind, and Glassdoor as of 2025. Actual offers vary by location — Menlo Park and New York are typically higher than Austin or remote roles.
Tip: Compensation bands can fluctuate yearly with market conditions. Always cross-check salary data from multiple sources before finalizing your negotiation.
Average Base Salary
Average Total Compensation
How Meta Structures Data Scientist Compensation
Meta’s total compensation package has four main parts:
- Base Salary: The fixed component—competitive across FAANG peers.
- Annual Bonus: Typically 10–15% of base, performance-based.
- Equity (RSUs): The biggest differentiator. Meta issues RSUs that vest quarterly over four years. Strong performers often receive top-up grants during annual reviews.
- Signing Bonus: Common for new hires, usually split over the first year to offset vesting delays.
Tip: Don’t underestimate the value of RSUs. Since Meta stock prices fluctuate, always ask for the number of shares and not just the dollar value, this helps you better estimate long-term earnings.
Negotiation Tips That Work
Negotiating your Meta offer is about knowing your worth and framing it with clarity and data. Meta recruiters expect candidates to negotiate, especially at senior levels.
- Confirm your level early: Your IC level (IC3–IC6) directly affects compensation and scope. If your background fits higher-level criteria, request a leveling review before your final offer.
- Use verified salary data: Reference credible benchmarks from Levels.fyi or TeamBlind. Use phrasing like, “Based on industry data, an IC5 offer typically falls in the $320K–$370K range.”
- Negotiate equity, not just base: RSUs are often more flexible and have greater upside, especially if Meta’s stock performs well. Ask if the equity portion can be adjusted to meet your target total compensation.
- Leverage competing offers professionally: Mention that you’re exploring other top-tier offers but emphasize that Meta is your first choice. Recruiters often respond with higher equity or signing bonuses.
- Align negotiation to impact: Talk about outcomes, not years of experience. For example, say “I led an analytics experiment that improved retention by 10%” instead of “I’ve been in analytics for 5 years.”
- Discuss location early: Meta adjusts pay by geography, so if you’re applying remotely, clarify the location band to avoid surprises later.
Once you have the offer, ask for a detailed compensation breakdown by year, including vesting schedules, bonus potential, and equity refresh policies.
Tip: Keep your tone collaborative and professional. Meta recruiters respond best to candidates who negotiate with data, confidence, and mutual respect.
Meta Data Scientist Portfolio & Project Showcase Expectations
When Meta interviewers say they want to “see your impact,” they mean it literally. Your portfolio is the strongest proof of how you think, solve problems, and communicate insights in a data-driven organization. Meta’s data scientists don’t just analyze numbers; they shape how billions of people experience products through experimentation, metrics, and strategy.
Interviewers look for projects that combine technical rigor (how you built it) and strategic value (why it mattered). A compelling portfolio can make a major difference during team matching and offer discussions because it demonstrates ownership and influence beyond pure analysis.
Tip: Pick projects that balance analytical depth and product impact, such as an A/B test analysis, a recommendation model, and an experiment-driven dashboard that informed product decisions.
What Meta Looks for in a Data Scientist Portfolio
Meta values projects that show measurable impact and strong product sense. Your portfolio should highlight how you’ve used data to answer strategic questions, influence product direction, or optimize experiences at scale. Interviewers want to see that you can blend technical excellence with real-world context.
Projects that stand out often include:
- Experiments that led to a change in product strategy
- Predictive models that improved business KPIs
- Deep-dive analyses that uncovered new user insights
- Dashboards or frameworks that improved decision velocity
Tip: Meta loves data scientists who quantify their value. Replace “analyzed user churn” with “increased retention forecast accuracy by 18%, shaping next-quarter strategy.”
How to Structure Each Portfolio Project
When describing projects, keep your storytelling structured and outcome-driven. Use a simple four-part framework that interviewers can follow easily:
- Context: What problem were you solving and why did it matter to the business or product?
- Approach: What methods, tools, or datasets did you use (SQL, Python, experimentation frameworks, etc.)?
- Insight: What key finding or pattern did your analysis reveal?
- Impact: What tangible result came from it — did it improve engagement, revenue, or product adoption?
Example: “Analyzed engagement drop on Instagram Reels → discovered retention dips after 10 seconds → recommended autoplay adjustment → boosted completion rates by 6% post-launch.”
Tip: Always end with an insight or recommendation that connects your technical work back to user or business value, that’s what Meta interviewers remember most.
Highlighting Projects During Interviews
In Meta’s interviews, you may be asked to walk through one or two projects. Focus on:
- Decision-making: How did you define success or select metrics?
- Collaboration: How you worked with PMs, designers, or engineers.
- Trade-offs: What constraints you faced and how you handled them.
Tip: Keep your explanation narrative-driven and show how your analysis guided action.
Tips for Building a Meta-Ready Portfolio
To make your portfolio stand out:
- Host it publicly: Use GitHub, Kaggle, or a personal website with clear documentation and code readability.
- Include visuals: Use charts, dashboards, or notebooks that clearly show insights and results.
- Show diversity: Include one business-impact project, one statistical modeling or ML project, and one experimentation or metric definition project.
- Focus on reproducibility: Use open datasets or clearly explain proprietary data context.
- Link to results: If a project improved a metric or decision, make that front and center.
Tip: Add a short “impact summary” at the top of your portfolio , even a bullet list like “Reduced churn by 12% | Designed A/B testing framework | Improved content ranking precision by 9%” gives interviewers instant context.
Remote & Virtual Meta Interviews: Tips and Logistics
Most Meta data scientist interviews are now virtual, which means your setup and communication skills matter as much as your technical preparation. A clean environment and clear communication can help you make a strong first impression, even over Zoom.
Preparing Your Technical Setup
Think of your setup as your digital workspace. It’s the first thing your interviewer notices, and it silently communicates professionalism and preparation.
Before your interview:
- Test your environment: Make sure your internet connection is stable, your camera angle is clean, and your lighting is clear (natural light or a soft lamp works best).
- Use a laptop instead of a phone: You’ll likely be asked to share your screen or walk through SQL and Python code.
- Check the tools: Meta usually uses Zoom or CoderPad. Log in once beforehand to test permissions.
- Have a backup plan: A mobile hotspot or secondary device can save you if Wi-Fi misbehaves.
Tip: Do a 5-minute mock call with a friend. This quick test helps you spot small issues like echo, glare, or muted microphones, before they distract you during the interview.
Virtual Interview Etiquette
Virtual interviews can feel a bit like talking into the void , but remember, Meta’s interviewers are people, not robots. They want to see collaboration, curiosity, and clarity.
- Greet them warmly and make eye contact through the camera.
- Speak clearly and think out loud so they can follow your reasoning in real time.
- Use small gestures or highlight parts of your screen to emphasize key points.
- Keep notes close for quick reference, but never read word-for-word.
Meta’s interviewers appreciate thoughtful communication, it’s a key part of the culture, especially since teams often work across time zones.
Tip: Treat the session like a conversation with a teammate, not a test. Meta values people who can communicate insights naturally, even under pressure.
Handling Technical Assessments Remotely
The technical rounds are where nerves can peak, especially when you’re typing SQL or explaining statistical logic live. The secret is your structured narration.
Before you start coding, explain your approach:
“I’ll begin by joining the user and event tables on user_id, then filter by active users within the last 30 days.”
This not only buys you time to think, but also helps the interviewer understand your problem-solving style.
If you hit a roadblock, stay calm. Say what you’re testing, what you expect, and move forward logically. Interviewers care less about perfection and more about how you reason through uncertainty.
Tip: Practice live problem-solving on platforms like CoderPad or HackerRank with a timer. Meta interviewers admire composure and logical flow, even when your query isn’t perfect on the first try.
Managing Time and Environment
In virtual interviews, time and space are your silent variables — manage them like a data experiment.
- Join the call 10 minutes early to avoid last-minute logins.
- Close Slack, email, and browser tabs to minimize distractions.
- Keep a glass of water nearby to give you a pause to collect your thoughts between questions.
- If something technical goes wrong (like a screen freeze or lag), handle it calmly. Simply say, “It seems my connection dropped; I’ll reconnect quickly,” and rejoin the call.
Tip: Control what you can like preparation, calmness, and communication. Meta interviewers don’t expect perfection, but they do notice when you stay composed under small hiccups.
Common Rejection Reasons & How to Improve
Even strong candidates get rejected at Meta, not because they lack skill, but because they don’t fully align with what Meta values most like clarity, structure, and measurable product impact. However, each rejection teaches you exactly where to improve for the next round.
Here’s what typically goes wrong and how to fix it.
1. Weak Problem Structuring
Many candidates jump straight into coding or analysis without clarifying what they’re solving. Meta’s interviewers evaluate not just correctness, but how you frame ambiguous problems into measurable, logical steps.
How to Improve:
- Restate the problem in your own words to confirm understanding.
- Outline your approach before diving into SQL or statistics.
- Explain your assumptions and possible data limitations upfront.
Tip: Think like a product data scientist. Start every answer with a framework, for example, “Here’s how I’d break this down…”, before touching the keyboard.
2. Shallow Product Sense
At Meta, metrics aren’t just numbers, they represent user behavior and product health. Candidates often fall short by analyzing metrics without connecting them to the underlying experience or business goals.
How to Improve:
- Always ask, “What does this metric tell me about the user journey?”
- Relate your analysis to product outcomes such as retention, engagement, or monetization.
- Practice defining success metrics for different Meta features (e.g., Reels, Groups, Ads).
Tip: Show that you understand user empathy. Meta favors candidates who balance quantitative thinking with product intuition.
3. Overemphasis on Technical Details
Some candidates get lost in formulas or query syntax and forget the “so what”, how their findings influence decisions. Meta expects data storytelling: interpreting patterns and framing actionable recommendations.
How to Improve:
- Conclude every analysis with an insight or implication.
- Use clear transitions like “This suggests that…” or “Based on this trend, we should…”
- Practice summarizing results in one or two concise, decision-oriented sentences.
Tip: Imagine you’re explaining your findings to a PM or designer. Meta values clarity and impact more than overly technical jargon.
4. Communication Gaps
At Meta, collaboration is everything. You’ll work closely with engineers, PMs, and researchers, so unclear explanations or disorganized thoughts can create friction, even if your technical answers are solid.
How to Improve:
- Speak clearly and pause between ideas.
- Use visuals, screen shares, or simple notes to explain concepts like pipelines or experiments.
- Record and review yourself explaining a project, it helps refine tone and pacing.
Tip: Approach every interview like a product meeting. Meta looks for data scientists who can influence through clarity and empathy, not just correctness.
5. Not Demonstrating Impact
Meta’s culture is impact-driven, and candidates who describe projects without quantifiable results seem less persuasive. You need to connect your work to measurable business or product change.
How to Improve:
- Always include numbers: “Improved CTR by 5%,” “Reduced load time by 20%.”
- Tie outcomes to business value: revenue, user retention, engagement.
- Highlight how your insights shaped decisions or launched experiments.
Tip: Frame your stories around transformation, not just tasks. Meta loves candidates who can show how their analysis turned data into real-world results.
In short: Meta hires those who can think strategically, communicate clearly, and create measurable impact. Every feedback point is a clue on how to refine your storytelling, structure, and confidence for the next opportunity.
Resume & LinkedIn Optimization for Meta Applications
When applying to Meta, your resume and LinkedIn profile often make the first impression, not just with recruiters, but with hiring managers who decide who moves forward. Meta looks for candidates who tell clear, measurable, and impact-driven stories about their work. You’re not just listing tasks; you’re showing how your data insights shaped products, improved metrics, or influenced business strategy.
How to Tailor your Resume for Meta’s Hiring Style
Meta’s recruiters scan for data-driven narratives and want to see candidates who quantify outcomes and demonstrate influence. Avoid vague bullet points like “worked on analytics projects.” Instead, tie every statement to a measurable result or product decision.
Example:
- Wrong: “Built machine learning models for marketing data.”
- Right: “Developed customer segmentation model that improved ad CTR by 12%.”
Focus on:
- Impact: Quantify improvements in engagement, accuracy, or efficiency.
- Collaboration: Mention partnerships with PMs, engineers, or designers.
- Scalability: Specify data volume, frameworks, or infrastructure used.
Tip: Mirror the tone and phrasing from Meta job descriptions. Use terms like metrics, experimentation, engagement, growth, and retention. These are high-value signals for recruiters searching profiles.
Resume Formatting Tips
Your resume should be clean, concise, and metrics-focused. Recruiters often skim hundreds of resumes daily, so make yours easy to scan and full of evidence-backed achievements.
Formatting best practices:
- Keep it to 1 page if you have under 7 years of experience (2 pages max for senior roles).
- Start each bullet point with strong action verbs like analyzed, designed, led, optimized, scaled.
- Highlight tools Meta uses frequently: SQL, Python, PySpark, Presto, Tableau, Airflow, experimentation frameworks.
- Showcase 2–3 projects that demonstrate tangible business or product impact (e.g., improved retention, automated reporting, or increased engagement).
Structure your bullets as “Action → Result → Impact.” For example: “Analyzed retention patterns → identified drop-off points → improved weekly active users by 8%”. That storytelling flow resonates with Meta’s analytical culture.
Tip: Mirror Meta’s job language. Use terms like metrics, experimentation, growth, retention, and product impact to match recruiter searches.
Optimizing Your LinkedIn Profile
Your LinkedIn should complement your resume like same achievements, but in a more storytelling and discoverable format. Think of it as your public brand: concise, keyword-rich, and authentic.
Checklist for a Meta-Ready Profile:
Headline: Summarize your role and impact.
Example: Data Scientist | Turning insights into product growth and measurable impact
About Section: Write 3–4 sentences describing your mission, data expertise, and domains of interest (e.g., product analytics, experimentation, or machine learning).
Experience: Use short, quantified bullet points. Recruiters love metrics like “boosted CTR by 10%” or “reduced churn by 5%.”
Featured Section: Add links to your GitHub, dashboards, or blog posts demonstrating data storytelling skills.
Tip: Use relevant keywords naturally throughout your profile. Meta’s recruiters use search filters like SQL, A/B testing, experimentation design, metrics, growth analytics, and data visualization.
Common Resume and LinkedIn Mistakes to Avoid When Applying to Meta
Even qualified candidates lose recruiter attention due to resume clutter or vague storytelling. Avoid these common pitfalls:
- Using generic achievements like “Improved efficiency” without numbers or context.
- Listing too many unrelated tools or side projects that dilute focus.
- Failing to highlight teamwork. Meta highly values collaboration and communication.
- Leaving your LinkedIn headline or About section blank, which limits visibility in recruiter searches.
Tip: Read your resume or LinkedIn summary aloud. If it sounds like a list of tasks instead of results, rewrite it to focus on impact and influence, that’s what makes Meta take notice.
Preparation Resources & Study Plans
Preparing for the Meta data scientist interview can feel overwhelming—but with structure and focus, you can turn it into a manageable plan. The goal isn’t just to memorize concepts, but to think like a Meta data scientist: analytical, product-driven, and data fluent.
Core Areas to Master
Meta tests a balanced mix of technical and product skills. Focus your prep on these pillars:
- SQL & Data Analysis: Practice writing efficient queries with joins, aggregations, and window functions.
- Statistics & Experimentation: Master A/B testing fundamentals, p-values, confidence intervals, and bias mitigation.
- Product Sense: Learn to define success metrics, evaluate product trade-offs, and reason through decisions.
- Communication: Practice explaining your thought process and translating data into actionable insights.
Tip: Narrate your reasoning out loud while solving practice questions. Meta interviewers value candidates who communicate their thinking as clearly as their code.
Weekly Study Plan (4 Weeks)
| Week | Focus Area | Key Actions |
|---|---|---|
| 1 | SQL & Data Wrangling | Practice daily SQL problems (Interview Query, LeetCode SQL, Mode Analytics SQL tutorials). |
| 2 | Statistics & Experiment Design | Review hypothesis testing, A/B test design, and confidence intervals. Practice analyzing experiment results. |
| 3 | Product Sense & Case Studies | Study Meta’s products. Practice metric questions like “How would you measure success for Instagram Reels?” |
| 4 | Mock Interviews & Review | Simulate full interviews. Record and review your responses for clarity and structure. |
Tip: Follow a consistent rhythm such as daily SQL practice, alternate-day case analysis, and weekly mock interviews, to build both confidence and stamina before the real thing.
FAQs
How many interview rounds are there for Meta data scientist roles?
Typically, there are four to six rounds:
- Recruiter Screen
- Technical Screen (SQL + Statistics)
- Onsite or Virtual Interviews covering analytical execution, product sense, and behavioral questions
- Team Matching (if you pass all rounds)
Each interview builds on the previous one, so consistency and clarity matter more than perfection.
What types of questions are asked in the Meta data scientist interview?
Expect questions from these categories:
- SQL & Data Analysis – Writing queries, aggregations, and logic reasoning
- Statistics & Experimentation – Hypothesis testing, confidence intervals, and A/B test design
- Product Sense – Designing metrics and evaluating product success
- Behavioral – Communication, collaboration, and leadership examples
How should I prepare for product sense and analytical questions?
Start by studying Meta’s products (Facebook, Instagram, WhatsApp, Threads).
For each product, ask yourself:
- What metrics define success?
- What trade-offs exist between engagement and user experience?
- How would I design an experiment to test a new feature?
Tip: Frame answers around users, metrics, and impact. Meta interviewers care deeply about connecting data to product outcomes.
What is the salary range for Meta data scientists?
As of 2025, base salaries range from $130K to $240K+, with total compensation (including RSUs and bonuses) between $180K and $600K+, depending on level and experience.
How can I best showcase my portfolio or previous projects?
Choose 2–3 projects that demonstrate measurable impact and product thinking. Explain the context, your methods, and most importantly, the outcome. Adding visuals, dashboards, or case summaries can make your projects more memorable.
What are common reasons for rejection at Meta?
Most rejections stem from weak structure or unclear reasoning, shallow product understanding, failing to connect data insights to decisions, poor communication or collaboration examples. Use rejections as feedback to improve your storytelling and framing.
What happens after I receive an offer from Meta?
Once you’re matched with a team, Meta will send a formal offer including base pay, RSUs, and bonuses. After acceptance, you’ll go through background checks and a structured onboarding bootcamp to learn Meta’s tools and data infrastructure.
Are there differences between remote and onsite Meta interviews?
Not in content, but just in logistics. Virtual interviews follow the same format, but require solid setup: good lighting, strong Wi-Fi, and clear communication. Onsite rounds may include casual team chats or culture-fit discussions.
How do I optimize my resume and LinkedIn for Meta applications?
Tailor your content around impact and collaboration. Use measurable outcomes and product-oriented language—words like metrics, experiments, growth, and user engagement resonate strongly with Meta recruiters.
Are system design questions purely modeling-focused for Meta data scientists?
System design questions typically extend beyond modeling alone. Interviewers expect candidates to discuss experimentation strategy, evaluation metrics, and product tradeoffs, especially how model decisions affect user experience and downstream stakeholders.
What happens if I do not finish the SQL question in time?
Some candidates reported running out of time during the SQL portion of the technical screen. In these cases, interviewers may ask you to verbally explain your query logic. Demonstrating a clear, structured approach and sound reasoning can still leave a positive impression even without a fully written solution.
Conclusion and Recommended Resources
Landing a data scientist role at Meta is as much about mindset as it is about skill. The process is rigorous, but designed to find people who combine analytical thinking with curiosity, collaboration, and real impact. If you’ve prepared across all areas like SQL, experimentation, product sense, and communication, then you’re already ahead of most candidates.
Tip: Treat your interview like a data story. Define the problem, explain your approach, share insights, and highlight impact. That’s the Meta way.
Mentorship and Mock Interviews
Pair with peers or mentors for mock sessions focusing on analytical execution and product sense questions. Explore Interview Query’s Coaching Program that pairs you with mentors to refine your prep and build confidence.
If you want to simulate real interview pressure, use Interview Query’s Mock Interviews. to test your skills live in a coding environment with real feedback.
Practice Platforms
- Interview Query Dashboard – Meta-style SQL, product, and statistics questions
- LeetCode Database Section – Focus on SQL joins, aggregation, and subqueries
- DataLemur – Realistic SQL + analytics challenges aligned with FAANG-style interviews
Tip: Rotate platforms weekly. Exposure to varied question styles improves your adaptability and reduces test-day surprises.
Reading & Courses
- Experimentation for Data Science (Udemy or Coursera) – Strengthen your grasp of experiment design and hypothesis testing.
- Practical Statistics for Data Scientists by Bruce & Gedeck – Great for concise refreshers on applied stats concepts.
- Meta Careers Portal – Review updated job listings and descriptions to align your prep with current expectations.
Tip: Don’t just read, apply concepts to small data projects. Meta loves candidates who can demonstrate applied learning, not just theory.
Meta Interview Questions
| Question | Topic | Difficulty |
|---|---|---|
Brainteasers | Medium | |
When an interviewer asks a question along the lines of:
How would you respond? | ||
Statistics | Easy | |
Machine Learning | Easy | |
SQL | Easy | |
Machine Learning | Medium | |
Statistics | Medium | |
SQL | Hard | |
Machine Learning | Medium | |
Python | Easy | |
Deep Learning | Hard | |
SQL | Medium | |
Statistics | Easy | |
Machine Learning | Hard |
Discussion & Interview Experiences