
TikTok Interview Questions & Hiring Process Guide (2026)

Introduction
TikTok’s platform is built to inspire creativity and bring joy, and preparing for TikTok interview questions is your first step toward joining this vibrant community. Understanding the TikTok interview process will help you navigate from your initial application all the way through on-site loops and final offers, ensuring you know what to expect at every stage. In the sections that follow, you’ll discover the most common questions asked across technical, design, and behavioral rounds, as well as a clear, stage-by-stage breakdown of the hiring journey.
Why Work at TikTok?
If you’ve ever wondered why work at TikTok, consider the blend of rapid growth, global reach, and an experiment-driven culture that makes every day full of impact and learning.
Competitive Total Rewards
TikTok offers industry-leading salary bands, generous sign-on bonuses, and quarterly RSU refreshers that reward both individual and company performance.
Hyper-Growth & Global Impact
With over 1 billion monthly active users, TikTok’s product cycles move in weeks, giving you the chance to ship features that affect communities around the world almost instantly.
Culture of Data-Driven Experimentation
At TikTok, you’ll join a true data-driven culture at TikTok, running hundreds of A/B tests weekly and leveraging petabyte-scale datasets to inform every decision.
What’s TikTok’s Interview Process Like?
Navigating the TikTok interview process means understanding each phase—from initial assessments to final offers—and tailoring your preparation accordingly. Below is a high‐level view of the typical stages; keep in mind that exact formats vary by function, so be sure to check our Role‐Specific Interview Guides.
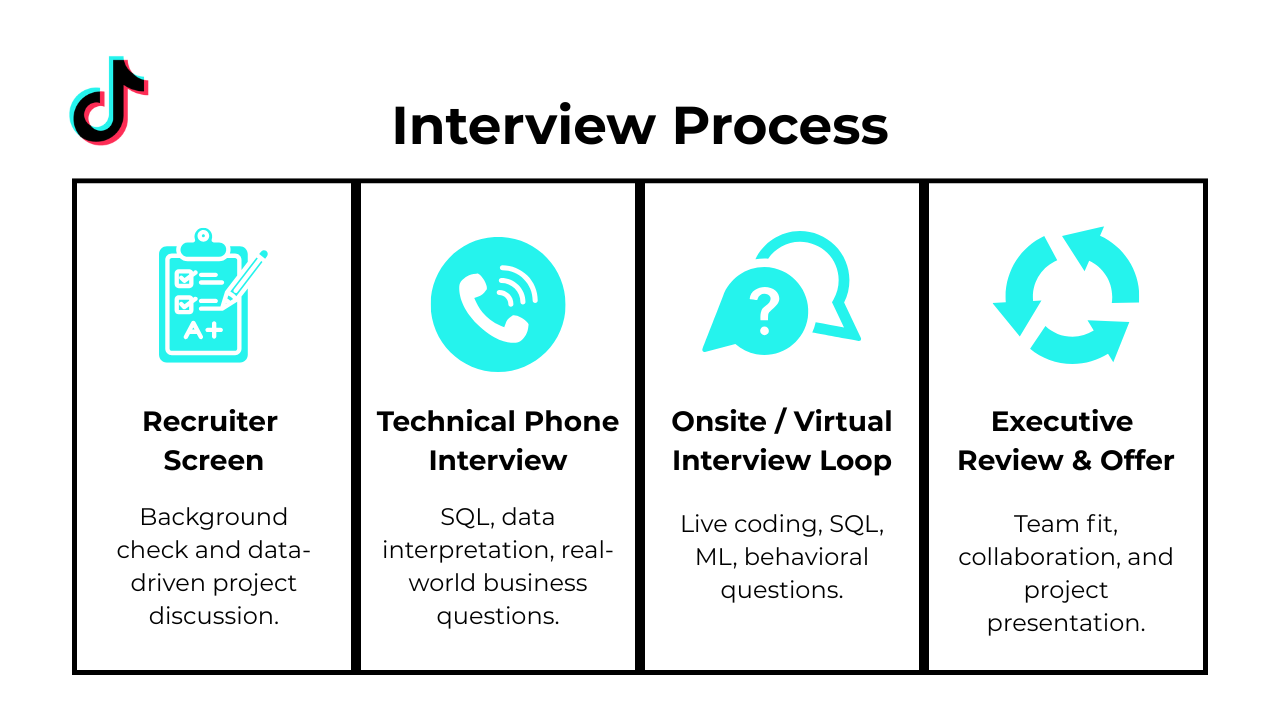
Online Assessment (HackerRank Style)
TikTok Hackerrank questions 2025 and TikTok online assessment questions 2025 form the backbone of this stage, which lasts about 45 minutes and features two problems. You can expect algorithmic challenges on arrays and strings, SQL queries on sample tables (e.g., joins and aggregations), and sometimes probability or combinatorics puzzles. This assessment screens for speed, correctness, and your ability to write clean, efficient code under time pressure.
Recruiter / Phone Screen
In the TikTok HR interview, a recruiter will verify résumé fit, discuss your motivations for joining TikTok, and outline the role’s scope. Be prepared to succinctly articulate your past projects, cultural alignment with TikTok’s values, and any logistical details like availability or location preferences.
Technical & Functional Rounds
These live interviews dive deeper into coding (data structures and algorithms), system‐design (scalability, latency trade‐offs), and functional cases (data analysis or product scenarios). Near the end of each loop, interviewers often revisit TikTok interview questions from earlier stages to probe your refinements and thought process. For detailed question sets by role, explore our TikTok Software Engineer and TikTok Data Analyst guides.
HR / Values Panel
This round focuses on culture fit and behavioral alignment. Interviewers use TikTok behavioral interview questions to map your past experiences to core values like “Always Day 1” and “Inspire Creativity.” Structure answers with the STAR method, highlighting collaboration, ownership, and adaptability in fast‐moving environments.
Offer & Debrief
After your performance is scored and calibrated, you’ll receive an offer call covering compensation, RSUs, and next steps. During this conversation, the team may share insights from your TikTok interview experience and offer constructive feedback, so listen closely and ask clarifying questions.
Good luck on your journey—each phase is an opportunity to showcase the skills and mindset TikTok values most!
Challenge
Check your skills...
How prepared are you for working at Tiktok?
Most Common TikTok Interview Questions
Role-Specific Interview Guides
Whether you’re joining as an engineer, data expert, or product leader, understanding the most frequent interview questions for TikTok will give you the edge. Below are the key question categories you’ll encounter, along with guidance on where to focus your preparation.
Role-Specific Interview Guides
Dive deep into each function’s question bank by following our curated guides:
- TikTok Data Scientist → Data Scientist Interview Questions
- TikTok Data Engineer → Data Engineer Interview Questions
- TikTok Software Engineer → Software Engineer Interview Questions
- TikTok Machine Learning Engineer → MLE Interview Questions
- TikTok Product Manager → Product Manager Interview Questions
- TikTok Research Scientist → Research Scientist Interview Questions
- TikTok Product Analyst → Product Analyst Interview Questions
- TikTok Data Analyst → Data Analyst Interview Questions
- TikTok Business Intelligence Analyst → Business Analyst Interview Questions
Behavioral & Culture Questions
TikTok looks for evidence of ownership, cross-functional collaboration, and agility under pressure. In this section, you’ll find prompts mapped to TikTok’s values. We cover classic TikTok behavioral interview scenarios and drill into TikTok behavioral interview questions that reveal your fit with the “Always Day 1” ethos.
What would your current manager say about you? What constructive criticisms might they give?
This question tests self‐awareness and honesty. Outline two or three core strengths (e.g. delivering clean dashboards under tight timelines) with concrete examples, then share one or two growth areas you’ve actively worked on (e.g. improving presentation skills), and how your manager would frame those for you.
Why did you apply to our company?
Show that you’ve researched TikTok’s mission and data culture. Explain how you’re excited by working with real-time, high-velocity analytics or personalized recommendation systems, and how your background in experiment design or large-scale ETL maps to their biggest challenges.
-
Highlight a moment when you went beyond the ask—perhaps you built an automated alert that caught churn early or optimized a pipeline to cut runtime in half. Walk through how you scoped the extra work, got stakeholder buy-in, and delivered measurable business impact without derailing the original timeline.
-
Describe a framework you use (e.g. RICE scoring or Eisenhower matrix) to rank tasks by impact vs. effort, how you visualize deadlines in tools like Jira or a shared calendar, and the communication rhythms you maintain with product and analytics partners to re-align priorities as blockers arise.
-
Pick a high-visibility initiative—migrating a monolith to microservices, scaling an ETL pipeline, etc. Detail the technical hurdles (e.g. schema drift, performance bottlenecks), your diagnostic approach (profiling, logging), and the solutions you implemented (partitioning, blue-green deploys), plus how you validated success.
Tell me about a time you cleaned and organized a large, messy dataset—what steps did you take?
Start with data profiling to spot missing or inconsistent fields, then explain the transformations you applied (date normalization, null imputation), how you automated those checks in CI/CD, and how you documented the pipeline for reproducibility and stakeholder trust.
How would you explain your technical methods and insights to a non-technical audience?
Emphasize clear storytelling: use simple analogies (e.g., “an ETL pipeline is a factory assembly line”), visual dashboards to illustrate key metrics, and a two-step approach—start with high-level outcomes before diving into technical details—so that both executives and cross-functional teammates can follow and act on your findings.
Online Assessment & Coding Challenges
Early rounds often begin with a timed online test. You’ll see TikTok Hackerrank questions on algorithms, data structures, and SQL queries, followed by more nuanced TikTok coding assessment problems. Focus here on clean code, test cases, and performance under time constraints.
How would you write a SQL query to get the top three highest employee salaries by department?
Join the
employeesanddepartmentstables, then applyDENSE_RANK()partitioned by department and ordered by salary descending. Filter for ranks ≤ 3 to include up to three top earners per department, handling smaller teams gracefully. Finally, sort the results by department name and salary to satisfy the output requirements. This pattern is a staple for building polished leaderboard or compensation dashboards.-
Use
ROW_NUMBER() OVER (PARTITION BY employee_id ORDER BY salary_effective_date DESC)(or highest auto-incrementid) to rank each employee’s salary records, then filter forrow_number = 1. This restores a one-to-one mapping of employee to most recent salary without deleting history. Mentioning an audit of the ETL and adding a unique constraint for future loads demonstrates production-grade thinking. A covering index on(employee_id, salary_effective_date DESC)ensures the query remains performant. Given a list of integers and a target N, how would you find all combinations that sum to N?
The classic solution uses recursive backtracking: iterate through the sorted list, accumulate a running total, and prune when the sum exceeds N or when duplicates appear. When the remaining target reaches zero, record the current combination. For large inputs, a DP memoization keyed by
(index, remaining)trades space for speed. Clear analysis of time complexity (O(2^n) worst-case) and pruning strategies shows you understand the trade-offs of exhaustive search.How would you select a uniformly random element from an unbounded data stream using only O(1) space?
Implement reservoir sampling of size one: keep the first element, then for the k-th incoming item replace the stored value with probability 1/k. This guarantees that at any point every seen element is equally likely without retaining the stream. Explaining the inductive proof of uniformity demonstrates rigorous understanding. This technique is fundamental in telemetry and real-time analytics where memory is constrained.
How could you simulate drawing balls from a jar when you know each color’s count?
Build a cumulative-weight array from the counts, generate a random float in
[0,total), and binary-search to select the corresponding color. To sample without replacement, decrement the chosen color’s count and update the cumulative weights; to sample with replacement, leave counts intact. This mirrors weighted randomization tasks in recommendation engines or A/B bucketing. Discussing numerical precision with large counts shows attention to detail.-
Iterate over every feature permutation to build deterministic decision trees that split on the query vector’s value for that feature, then aggregate the majority vote across all trees. Using only NumPy and pandas forces you to hand-craft bootstrapping, tree traversal, and voting logic. This exercise assesses algorithmic fluency, code discipline, and your grasp of bias-variance trade-offs without library shortcuts. Discussing exponential run-time in the number of features and ways to limit permutations demonstrates practical realism.
Write a SQL query to select the second-highest salary in the engineering department.
Filter
employeestodepartment='engineering', then use eitherDENSE_RANK()overORDER BY salary DESCand pick rank = 2, or a correlated subqueryMAX(salary) WHERE salary < (SELECT MAX(salary)…). Handling ties correctly ensures you return the true second distinct value. This small but tricky ranking question tests careful edge-case thinking and common analytic patterns.How would you calculate first-touch attribution for each converting user?
Given an
attributiontable (withconversionflag andchannel) anduser_sessions, partition byuser_idordered bysession_ts, filter for sessions whereconversion=TRUE, and pickFIRST_VALUE(channel)for the earliest row. Handling ties on identical timestamps may require a secondary ordering column. This metric is crucial for measuring the original marketing channel that drove each conversion.What was the last transaction recorded on each calendar day?
Use
ROW_NUMBER() OVER (PARTITION BY CAST(created_at AS DATE) ORDER BY created_at DESC)and filter forrow_number = 1to pick the latest timestamp per day. Casting the datetime to a date ensures correct grouping, and ordering by timestamp yields the true “last” event. This pattern is widely used in time-series reporting for financial or operational dashboards.-
Normalize each rectangle to
(min_x, max_x, min_y, max_y), then returnNOT (r1.max_x < r2.min_x OR r2.max_x < r1.min_x OR r1.max_y < r2.min_y OR r2.max_y < r1.min_y). Edge and corner touches count as overlap. This tests geometric reasoning and careful handling of inequality boundaries—a common question in graphics and collision-detection coding interviews. -
Model the grid as a graph and perform a BFS from
(0,0), enqueuing neighbors according to each cell’s unlocked door and tracking visited cells to avoid cycles. The first time you reach the target, the BFS depth is the minimum step count; return –1 if unreachable. This question gauges your ability to apply graph traversal and boundary checks under tight complexity constraints. -
Compute the min and max of the list, divide that range into equal-width bins, and count values per bin—omitting bins with zero count. Mapping each value to its bin index takes O(1) time; aggregating into a dictionary yields O(n) overall. Handle edge cases like zero-range data by collapsing to a single bin. This problem tests your ability to implement basic EDA primitives efficiently.
-
Iteratively assign each of the n points to the nearest of k centroids (in m-dimensional space), then recompute centroids as the mean of their assigned points until convergence. Vectorize distance computations with NumPy and handle empty clusters by reinitializing or skipping them. Return a list of cluster labels for each point. Interviewers look for correctness (convergence criteria), efficiency (avoiding Python loops), and awareness of the O(i×k×n×m) time complexity.
How do you find all employees who joined before their manager?
Given
employees(emp_id, name, hire_date)andmanagers(emp_id, manager_id), joinemployeese toemployeesm viamanagersone.manager_id = m.emp_id, then filtere.hire_date < m.hire_date. Selectinge.nameyields those employees. This tests your ability to navigate self-joins and compare row-level timestamps in a single SQL query.-
Implement a comparison-based algorithm such as mergesort: recursively split the list, sort each half, and merge by lexicographic string comparison. This guarantees O(n log n) runtime and stability. Demonstrating a handwritten mergesort or heapsort shows mastery of divide-and-conquer sorting techniques beyond relying on library calls.
-
Use a modified binary search: at each step, determine which half is properly sorted and whether the target lies within its bounds. Recurse into that half; otherwise search the other. Handle wrap-around boundaries and singleton arrays robustly. This question tests your ability to adapt classic algorithms to non-trivial data layouts.
-
Self-join the
subscriptionstable onuser_id, comparing two rows at a time to check ifstart_a < end_b AND start_b < end_afor completed subscriptions (end_date IS NOT NULL). Wrapping this logic in anEXISTSsubquery or boolean aggregation per user yields a true/false for overlap. Ensuring subscription integrity prevents double-billing and supports accurate retention analytics. Write a function to reconstruct a friendship timeline from “begin” and “end” events for user pairs.
Read two lists of timestamps for friendship starts and ends, then merge-join them chronologically, matching each “begin” to the next “end” for a given user pair. Use dictionaries or heaps to efficiently track open friendships and close them in order. This tests your ability to process semi-structured time-series data and maintain state across events—skills critical for social-graph features.
-
Model this as a Markov chain: define states based on the last two days’ rain statuses, build the 4×4 transition matrix from historical data, and compute its (n–2)-th power times the initial state vector. Alternatively, use dynamic programming to iterate the probabilities day by day. This problem tests your ability to implement probabilistic forecasting and manage state-space explosion.
How would you implement a weighted random key selector from a dictionary of key→weight mappings?
Build a cumulative-weight list from the dictionary values, generate a random float in
[0,total_weight), and binary-search to pick the corresponding key. Updating the mapping for streaming weights or frequent reselection requires efficient data structures (e.g., Fenwick trees). This technique underpins traffic allocation in A/B experiments and load balancing in distributed systems.
Case Study & Analytics Problems
For data-driven roles, you’ll tackle real-world scenarios: defining KPIs, designing A/B tests, and writing data-pull queries. This section introduces TikTok case study interview prompts as well as specialized TikTok shop interview questions for commerce teams, all meant to assess your analytical rigor and business impact awareness.
-
Begin with a waterfall decomposition of the total revenue change into price and volume contributions across each category, subcategory, and discount level to surface the biggest drops. Drill into attribution sources and customer cohorts to see if particular channels or segments suffered larger declines. Plot time series of average selling price, units per order, and discount depth to distinguish one-off events from structural shifts. Finally, run a simple regression of revenue on these drivers to quantify each factor’s impact and highlight recovery levers.
-
Decompose DAU into retention of existing users, activation of new users, and creator-generated re-engagement. For each hypothesis run A/B tests or geo-holdouts: feed tweaks should lift session depth and return rates; acquisition spend should drive installs and day-1 retention; creator-tool upgrades should increase content uploads and subsequent views. Measure incremental DAU per engineering week or marketing dollar to compare ROI. Use funnel metrics—video views per session, follow events—to validate sustained impact.
-
A mass blast risks subscriber fatigue, unsubscribes, and spam-folder placement that hurt long-term engagement. Instead, segment customers by recent purchase behavior or propensity scores to target high-ROI cohorts. Simulate expected lift versus churn using historical campaign response and complaint rates. Propose a small-scale A/B test (e.g. 1,000 customers) to measure net revenue per email before rolling out broadly.
-
Apply an interrupted time-series or difference-in-differences design that compares pre/post trends, adjusting for seasonality and marketing mix. Hold out a control cohort (by region or signup date) that did not receive the new flow. Add a trend term in your model to isolate the redesign’s incremental effect from the pre-existing decline. Validate with propensity-score matching on user attributes to control for shifts in acquisition sources.
-
Two common approaches:
- Churn-based: LTV ≈ ARPU / churn rate = $100 ÷ 0.10 = $1,000
- Tenure-based: ARPU × observed lifetime = $100 × 3.5 = $350
Reconcile by noting a 3.5-month tenure implies an effective churn (~28%). Discuss which method aligns with stakeholder definitions, whether to adjust for gross margin, and if discounting future cash flows is required for NPV.
-
Track requests-per-minute, average wait time, and surge multiplier by geohash. Compare against active-driver counts and acceptance rates to infer supply gaps. Compute a demand-supply ratio (requests ÷ drivers) and set alert thresholds (e.g., 95th percentile of ETA spikes). Overlay event calendars and time-of-day patterns to distinguish normal peaks from anomalies requiring driver-incentive interventions.
How would you measure the frequency of incorrect pickup locations reported by riders?
Join rider feedback tags for “incorrect map pin” with GPS start-location deltas between app pins and actual pick-up coordinates. Build a funnel: total trips → trips with location complaints → trips with GPS delta > threshold (e.g., 50 m). Slice by city, app version, and map-tile provider to identify systematic issues. Cross-validate with driver “can’t find rider” logs to capture silent failures.
How would you choose the optimal Lyft cancellation fee when testing $1, $3, and $5 variants?
Run an A/B/C test randomizing riders (or regions) to each fee level. Measure cancellation rate, ride completion, net revenue per ride (fare plus fee minus lost demand), and customer satisfaction (e.g., CSAT, complaint rate). Use statistical methods (e.g., CUPED, hierarchical Bayesian) to handle sparse events and shrink variance. Choose the fee that maximizes incremental net revenue while keeping user experience metrics within acceptable guardrails.
Tips When Preparing for a TikTok Interview
Whether you’re gearing up for a coding, data, or product loop, a targeted preparation plan can make all the difference in your TikTok interview success. Below are five actionable strategies to sharpen your skills, build confidence, and ensure you’re ready for each phase of the process.
Simulate the OA
Recreate the full-time-press environment by completing two end-to-end HackerRank-style tests under strict timing. Focus on writing correct, efficient solutions and practice clean code submission habits—this is what the TikTok online assessment rewards.
STAR Story Bank
Develop a library of 8–10 Situation–Task–Action–Result narratives that highlight ownership, collaboration, and rapid iteration. Use these for the HR and values panels, where TikTok behavioral interview questions probe how you handle ambiguity and drive impact.
Product Metrics Fluency
Master key TikTok KPIs—retention curves, click-through rates, and For-You feed ranking metrics. Be prepared to explain how you’d design, measure, and iterate on experiments that move these numbers, demonstrating your data-driven mindset.
Mock System Design
Schedule 45-minute whiteboard or virtual design sessions with a peer to practice end-to-end architecture problems. Time your breakdowns of requirements, trade-off discussions, and scalability considerations to mirror the live loop.
Self-Retro
After every practice session, spend ten minutes writing down three specific areas for improvement and a concrete plan to address them. This rapid feedback loop helps you internalize lessons and continuously elevate your performance.
Salaries at TikTok
Average Base Salary
Average Total Compensation
Conclusion
Mastering the TikTok interview questions and navigating the TikTok interview process equips you for success across any function. Dive deeper into the role that fits you best with our detailed guides:
- Data Scientist Interview Questions
- Data Engineer Interview Questions
- Software Engineer Interview Questions
- Machine Learning Engineer Interview Questions
- Product Manager Interview Questions
- Research Scientist Interview Questions
- Product Analyst Interview Questions
- Data Analyst Interview Questions
- Business Analyst Interview Questions
Ready to put your preparation to the test? Schedule a mock interview to simulate the real loop, or follow one of our learning paths for structured study plans. And for inspiration, check out how Jayandra Lade refined his approach and landed an offer at TikTok. Good luck—you’ve got this!
FAQs
How many rounds are there in the TikTok interview process?
Typically, candidates go through five stages: an initial assessment, a recruiter or phone screen, technical and functional rounds, a values‐fit conversation, and finally an offer discussion. Depending on the team and seniority level, you may encounter extra design or case‐study interviews, but most applicants will complete these five core steps.
What questions appear in the TikTok online assessment?
The coding test usually features two problems to be solved in under an hour. Expect one algorithm/data‐structure challenge—often arrays, strings, or graphs—and one SQL query involving joins, aggregations, or window functions. Occasionally, a probability or combinatorics puzzle may appear. Hand‐written solutions, edge‐case considerations, and clean time‐complexity analyses are all evaluated.
Does TikTok ask behavioral questions for technical roles?
Yes. Even in engineer and data loops, you’ll face scenario‐based prompts exploring how you navigate ambiguity, mentor peers, and own outcomes. These discussions are designed to assess collaboration, adaptability, and leadership potential. Interviewers want to see examples of how you’ve driven projects forward, handled setbacks, and aligned your work with broader team or product goals.
How long does TikTok take to give interview feedback?
Feedback timelines vary by stage, but most candidates hear back within one to two weeks after each loop. The initial test results often arrive within 48–72 hours. For on‐site and panel rounds, expect debriefs and decisions to be communicated roughly a week after completion, though visa or executive approvals can occasionally extend this.
What is the pass rate for the TikTok Hackerrank test?
While TikTok doesn’t publish an official statistic, anecdotal data suggests about 30–40% of first‐time applicants advance past this stage. Success hinges on clear, optimized code, thoughtful handling of edge cases, and familiarity with common patterns. Consistent practice under timed conditions can improve your odds significantly.
Discussion & Interview Experiences