
Data Science Case Study Interview Questions and Answers (2025 Guide)


Introduction
So, you’ve made it past the resume screen. Maybe you’ve even tackled some tough SQL and Python challenges. Now comes the part many candidates find the trickiest—the data science case study interview.
Unlike a straightforward coding question or probability puzzle, a case study is all about how you think. It’s an open-ended business problem meant to simulate what you’d actually do on the job.
The interviewer wants to see how you approach ambiguity, structure your thoughts, and tie data insights back to impact.
In this guide, we’ll break down everything you need to master case data science study interviews—from real examples and proven frameworks to common mistakes and practice plans. You’ll learn how top data scientists approach open-ended business problems, and how to apply the same structured reasoning in your own interviews.
What is a Data Science Case Study Interview?
A data science case study interview is a problem-solving session where you’re asked to analyze a real or hypothetical business scenario using data science methods. These problems can range from identifying why a key metric dropped to building a predictive model or deciding how to measure success for a new feature launch.
The goal? To assess whether you can think like a data scientist in a messy, real-world setting and not just write clean code.
Data Science Case Study vs Technical Interviews: What’s the Difference?
Let’s break it down:
| Traditional Technical Interview | Case Study Interview |
|---|---|
| Focuses on algorithms, coding, and specific outputs | Focuses on strategy, decision-making, and insights |
| Clear right or wrong answers | Open-ended and multiple valid approaches |
| Meant to test technical depth | Meant to test business thinking, communication, and prioritization |
In short, case studies mirror what you’ll actually do as a data scientist, turning vague business goals into actionable insights. They test how you think, prioritize, and communicate impact, not just how well you can code on a whiteboard.
Why Do Companies Like FAANG+ and Startups Use Case Interviews?
Whether you’re interviewing at Meta, Amazon, or an early-stage startup, case studies are used for one big reason: they test your ability to turn data into impact.
Top companies don’t just want smart coders. They want data scientists who:
- Understand business goals
- Can work with ambiguous requirements
- Ask sharp, clarifying questions
- Build solutions that scale
- Communicate insights clearly to stakeholders
Startups love them because they reveal whether you can wear multiple hats. FAANG+ companies use them to evaluate product sense, experimentation skills, and cross-functional thinking.
Types of Case Studies Asked in Data Science Interviews
When you hear “data science case study,” what exactly does that mean?
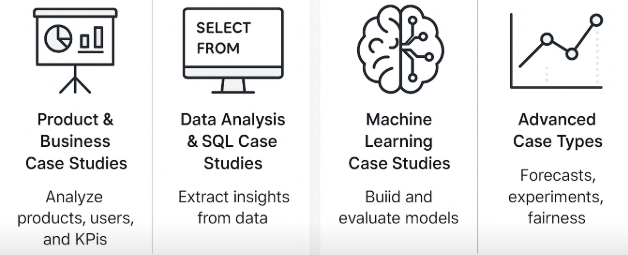
Well, it depends. The format varies wildly depending on the company, team, and role, but most fall into 3 or 4 broad case study types. Some focus more on product intuition. Others test modeling chops. Many test both.
Read more: Top 110 Data Science Interview Questions
Let’s break them down (with real examples for each).
Product & Business Case Studies
This is the most common case type, especially at product-driven companies like Meta, Uber, Airbnb, or DoorDash. Here, you’re expected to think like a PM + Data Scientist hybrid. The focus is on product metrics, user behavior, and business outcomes.
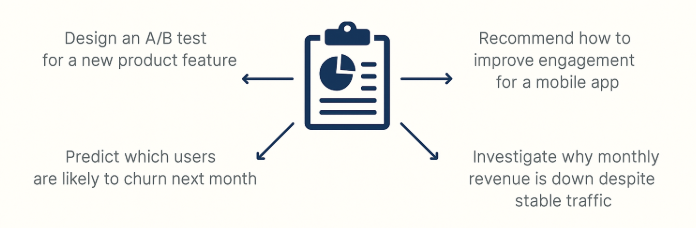
You might be asked to:
- Investigate a sudden KPI drop (e.g., “Why did sign-ups drop 20% last week?”)
- Suggest metrics to evaluate a new feature launch
- Design and assess an A/B test (including success criteria)
- Prioritize data insights to reduce user churn
One candidate at a delivery startup shared: “They asked why repeat orders dropped in LA. No data given. Just walk them through how you’d debug it.”
These cases are about structured thinking, metric design, and business impact. Here are some example product and business-focused case study questions that test how you approach ambiguous, real-world data challenges with a structured and analytical mindset:
1. How would you investigate a decline in the average number of comments per user?
To investigate the decline in the average number of comments per user, consider factors such as user engagement, content quality, and changes in user demographics. Analyze metrics like user activity levels, comment frequency, and user retention rates to identify potential causes for the decrease.
To assess potential biases in Jetco’s boarding time results, consider factors such as the sample size, selection of flights, and time of day when the study was conducted. Investigate whether the study accounted for variables like passenger load, boarding procedures, and airport infrastructure, which could influence boarding times.
3. Given a SaaS company, calculate the formula for the average lifetime value
To calculate the average lifetime value, you need to consider the monthly revenue per customer and the average customer lifespan. The formula is: Average Lifetime Value = Monthly Revenue per Customer * Average Customer Lifespan. Given that the product costs $100 per month and the average customer stays for 3.5 months, the average lifetime value would be $350.
4. How would you evaluate whether a 50% rider discount promotion is a good or bad idea?
To evaluate the effectiveness of a 50% rider discount, you should implement an A/B test comparing a group receiving the discount to a control group. Key metrics to track include changes in ride frequency, customer acquisition, retention rates, and overall revenue impact. Additionally, consider the long-term effects on customer behavior and the potential for increased market share.
To measure the health of the Mentions app, you could track metrics such as user engagement, frequency of interactions, and user retention rates. To attribute increases in celebrity-fan interaction specifically to the Mentions app, you could conduct A/B testing or use statistical models to differentiate between the effects of the app and the celebrity’s intrinsic motivation to engage more with fans.
To solve this, calculate the head start distance the first car has after one hour, which is 60 miles. Then, determine the relative speed difference between the two cars, which is 20 mph. Divide the head start distance by the relative speed to find the time it takes for the second car to catch up, which is 3 hours.
To determine the mouse’s location with the fewest scans, use a binary search approach by dividing the grid into smaller sections. By repeatedly scanning halves of the grid, you can narrow down the mouse’s location efficiently.
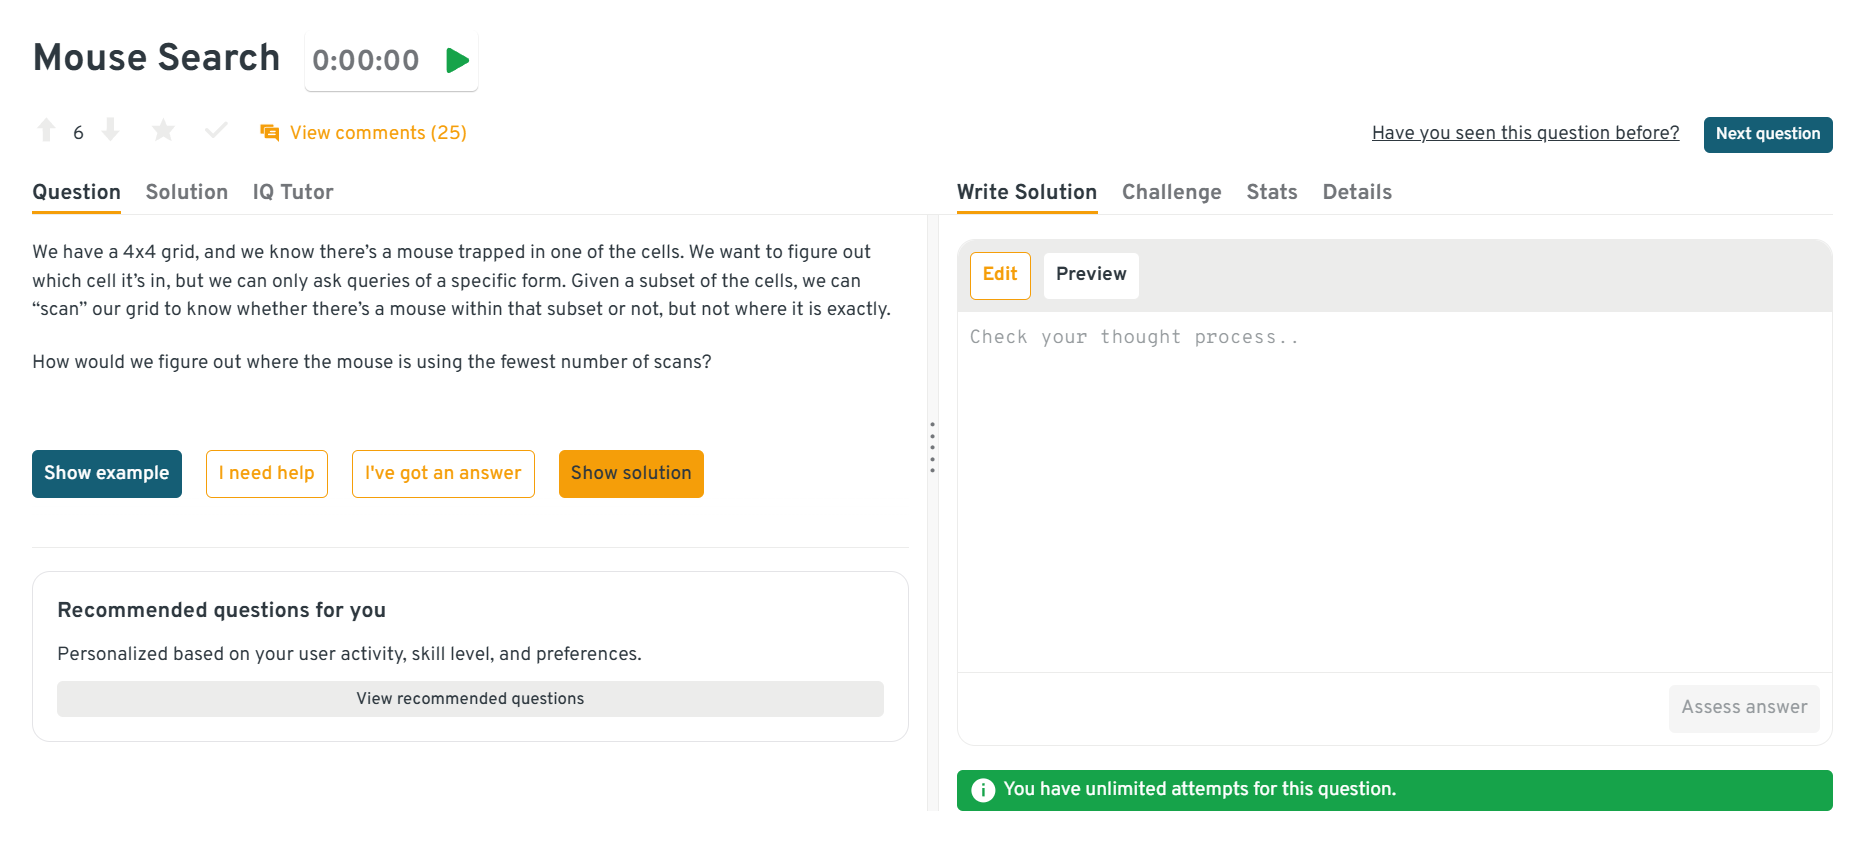
You can explore the Interview Query dashboard that lets you practice real-world Data Science interview questions in a live coding environment. You can write, run codes, and submit answers while getting instant feedback, perfect for mastering Data Science problems across domains.
8. How would you measure the percentage of Facebook stories that are fake news given a time constraint?
To measure the percentage of fake news stories on Facebook within a limited timeframe, you could use a combination of automated tools and manual verification. Automated tools can quickly scan and flag potential fake news based on certain criteria, while a team of fact-checkers can manually verify a sample of stories to estimate the overall percentage of fake news.
9. How would you measure the success of the Instagram TV product?
To measure the success of Instagram TV, consider metrics such as user engagement, viewership numbers, and content creation rates. Analyzing user feedback and retention rates can also provide insights into the product’s performance and areas for improvement.
10. What is potentially flawed with the VP’s approach regarding insurance leads?
The VP’s approach may be flawed due to a lack of consideration for other variables that could affect customer retention and value, such as the quality of leads or the agents’ ability to convert leads into sales. Simply increasing the number of leads does not necessarily correlate with increased value or retention if these other factors are not accounted for.
Data Analysis & SQL Case Studies
If the role is analytics-heavy (think: data analyst, product analytics, marketing science), expect to get SQL-style case questions, even if they’re not live-coding.
These questions usually revolve around:
- Defining key metrics (conversion, engagement, retention)
- Performing cohort analysis
- Tracing user attribution across touchpoints
- Finding upsell or drop-off patterns
Even if no code is required, think out loud like you’re writing one. Use WHERE, GROUP BY, and JOIN logic in plain English. Below are sample SQL and data analysis case study interview questions.
11. Find the total salaries of employees who didn’t finish any of their projects
To calculate the total salaries of employees who didn’t complete any projects, first filter the projects table to identify employees where all associated projects have End_dt IS NULL. Then join this set with the employees table on id = employee_id and sum their salary. Make sure to include only those who had at least one project assigned.
12. Calculate the first touch attribution for each user_id that converted
To determine the first touch attribution, join the attribution and user_sessions tables on session_id. Filter for sessions where conversion is true, and then find the earliest session for each user_id to identify the channel through which they first discovered the website.
13. Categorize and sum sales by type and region
To categorize each sale, use a CASE WHEN clause based on the conditions: all July sales are Promotional, sales ≥ 2000 or from the East are Premium (unless in July), and the rest are Standard. Group the sales table by region and calculate the sum of total, promotional, standard, and premium sales. Remember to prioritize the Promotional category first since July overrides other rules.
14. Recommend a new friend for John based on a weighted point system
To identify John’s best potential friend, assign scores to all users using a weighted system: +3 points per mutual friend with John and +2 points per mutual page like. Exclude users who are already friends with John or who he has blocked. Use joins on the friends, likes, and blocks tables to compute scores for each candidate. Return the name of the top-scoring non-friend, non-blocked user with the highest friendship points.
To solve this, you need to join the employees and departments tables, filter departments with at least ten employees, and calculate the percentage of employees earning over 100K. Then, rank these departments based on the calculated percentage and select the top three.
16. Write a query to get the number of customers that were upsold
To determine the number of upsold customers, identify users who made purchases on different days. This involves grouping transactions by user and filtering for those with more than one distinct purchase date.
17. Write a SQL query to find the average number of right swipes for different ranking algorithms
To solve this, join the swipes and variants tables on user_id and filter users who have swiped at least 10 times. Group the results by variant and swipe_threshold (10, 50, 100), and calculate the average of is_right_swipe for each group to get the mean number of right swipes. Count the number of users in each group to complete the output.
18. Given the transactions table below, write a query that finds the third purchase of every user.
To find the third purchase of every user, you can use a window function like ROW_NUMBER() to assign a sequential number to each purchase per user, ordered by the created_at and id fields. Then, filter the results to only include rows where the row number is 3, indicating the third purchase.
19. Write a query that returns all neighborhoods that have 0 users
To find neighborhoods with no users, perform a LEFT JOIN between the neighborhoods table and the users table on the neighborhood_id. Filter the results where the user_id is NULL, indicating no users are associated with those neighborhoods.
20. Write a query to get the current salary for each employee after an ETL error.
To solve this, you need to identify the most recent salary entry for each employee, which can be done by selecting the maximum id for each unique combination of first_name and last_name. This ensures that you retrieve the latest salary record for each employee.
Machine Learning Case Studies
In these interviews, you’re asked to design or evaluate an ML system but not just the algorithmic part. Interviewers want to see if you understand the problem context first.
It’s less about tuning hyperparameters, and more about:
- Framing the business goal clearly
- Justifying model choice (e.g., tree-based vs neural net)
- Discussing feature engineering
- Thinking through offline vs online evaluation
More senior roles might also expect a discussion on scaling the model, feedback loops, or cold start problems.
Below are common machine learning case study interview questions designed to assess how well you apply ML concepts to real-world business problems, perfect for preparing for an ML case study interview, machine learning case study interview, or data science use case interview questions.
21. How do we deal with missing data to construct a housing price prediction model?
To handle missing square footage data in housing listings, consider using imputation techniques such as mean, median, or mode imputation based on available data. Alternatively, more advanced methods like regression imputation or using machine learning models to predict missing values can be employed to maintain the integrity of the dataset for model training.
22. How would we build a bank fraud detection model with a text messaging service?
To build a bank fraud detection model, you would start by collecting and preprocessing transaction data to identify patterns indicative of fraud. Implement machine learning algorithms to classify transactions as fraudulent or not, and integrate a text messaging service to alert customers for transaction verification.
To build a model for bidding on a new, unseen keyword, you can use historical data to train a machine learning model that predicts the optimal bid price. This involves feature engineering to extract relevant features from the keywords and using regression techniques to predict the bid price for new keywords. Additionally, you may consider using natural language processing (NLP) techniques to better understand the context and relevance of the keywords.
24. How would we know if we have enough data to create an accurate enough model?
To determine if there is enough data to create an accurate model, you should evaluate the data’s quality, diversity, and representativeness. This involves checking for missing values, ensuring a wide range of scenarios are covered, and confirming that the data reflects real-world conditions. Additionally, statistical methods like learning curves can be used to assess if more data would improve the model’s performance.
To increase recall without altering the search algorithm, you can enhance the data inputs or outputs. This could involve expanding the dataset with more relevant keywords, using synonyms, or improving the indexing process to ensure more comprehensive coverage of potential search queries. Additionally, implementing user feedback mechanisms to refine search results based on user interactions can also help improve recall.
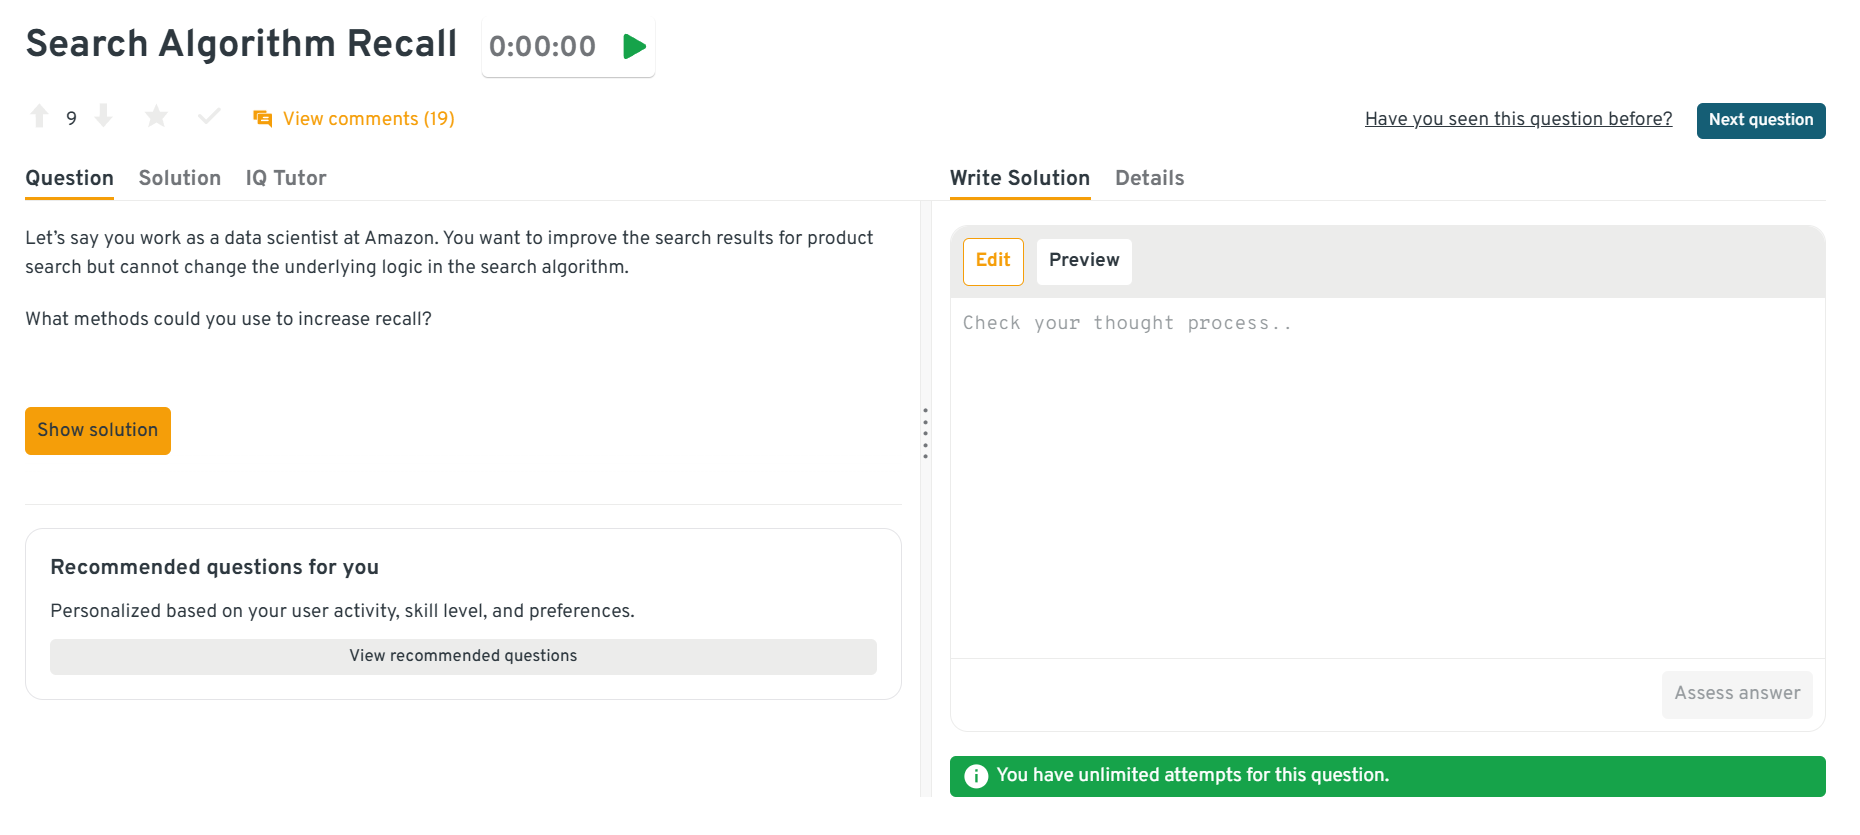
You can explore the Interview Query dashboard that lets you practice real-world Data Science interview questions in a live coding environment. You can write, run codes, and submit answers while getting instant feedback, perfect for mastering Data Science problems across domains.
26. How would you design a model to detect potential bombs at a border crossing?
To design a bomb detection model, start by defining the inputs, such as sensor data or images, and the outputs, like a binary classification indicating the presence of a bomb. Measure the model’s accuracy using metrics like precision, recall, and F1-score, and test the model through cross-validation and real-world trials to ensure reliability and effectiveness.
27. Your job is to perform sentiment analysis on an existing Amazon customer feedback dataset.
To perform sentiment analysis, convert raw text data into numerical vectors using techniques like TF-IDF or word embeddings. Train models such as logistic regression, SVM, or neural networks on these vectors to classify sentiments. The training involves adjusting model parameters to minimize prediction errors on labeled data.
28. Bagging vs Boosting: When & Why Choose One Over the Other
To compare bagging vs boosting, you should explain their core differences (parallel vs sequential, error correction vs variance reduction). Then give scenarios: if your model is overfitting / high variance, bagging (e.g. Random Forest) might help; if underfitting / high bias, boosting (e.g. Gradient Boosted Trees) could improve performance. Also discuss trade‑offs: boosting is more prone to overfitting on noisy data; bagging may be less sensitive to outliers. Consider ensemble size, computation cost, interpretability, and how feature importance changes.
29. Variable Error: Data Quality Impacts on Logistic Model
Here, you have a logistic regression model where a feature variable has a data quality issue (e.g. decimal point missing — 100.00 becomes 10000). Ask: Would the model still be valid? You need to reason about whether the model’s coefficients and scaling get distorted. Then propose fixes: detect outliers/anomalies; rescale or standardize features; possibly remove or correct the bad entries; retrain with clean data. Also consider feature sensitivity, regularization to dampen large weights, and validation performance for detecting the issue (e.g. if one feature dominates unexpectedly).
30. Bias‑Variance Trade‑off & Class Imbalance in Finance
To handle a finance classification problem with imbalanced classes (e.g. fraud detection / rare default), you’d explain bias‑variance trade‑off first: more complex model → low bias but high risk of overfitting (variance). Then consider class imbalance: standard accuracy is misleading; use metrics like precision, recall, AUC‑ROC, or PR curve. For model choices: over‑/under‑sampling, synthetic data (SMOTE), cost‑sensitive learning, or adjusting class weights. Also validation strategy is important (e.g. stratified splits, cross‑validation), and monitoring performance over rare classes.
Advanced Case Types (Emerging in 2025)
In 2025, companies are getting bolder with their case studies especially in domains like AI, experimentation, and fairness. You might encounter newer case formats like:
Time Series Forecasting - Predict future demand, churn, or revenue. Discuss seasonality, data windows, and modeling trade-offs.
31. How would you forecast inventory demand for perishable goods at a grocery chain?
To forecast demand, you’d analyze historical sales data, looking for seasonality (daily, weekly, holiday spikes). You’d handle missing values, outliers (e.g., spoilage, stock-outs), and consider external covariates (weather, promotions). Choose a model such as ARIMA, exponential smoothing, or perhaps more advanced ones like Prophet or LSTM if non‑linearities are strong. Validate with backtesting; use rolling windows. For business impact, quantify forecast error vs. costs of overstock vs. understock.
32. How would you model time‑series user retention decay for newly onboarded users?
Here, track cohorts by their signup date, measure active usage over time (e.g. weekly retention). Fit decay curves (e.g. exponential decay), or even use survival analysis. Account for censoring (users lost to follow up). Explore seasonal or campaign effects. Use the model to predict how many from a new cohort will remain active at 30, 60, 90 days, which helps plan interventions or budget.
33. Design a forecasting model to predict monthly churn in subscription business
You’d gather monthly subscription data, possibly with lagged churn rates, engagement metrics, usage patterns. Look for trend, seasonality, structural breaks (e.g. pricing changes). Use models like Holt‑Winters, ARIMA with exogenous variables, or even supervised ML on temporal features. Evaluate with metrics like MAE, MAPE, maybe even asymmetric loss if false negatives are more costly. Also monitor drift over time.
Causal Inference & Uplift Modeling - How do we measure the true effect of an intervention (vs correlation)? Useful for pricing, targeting, or experimentation.
34. How would you design an experiment to measure the uplift from offering discounted pricing to high‑risk churn users?
Clarify what “high‑risk” means. Randomize in test vs control among those users. Measure churn rates over some window post‑treatment. Use techniques for uplift modeling: compute treatment effect heterogeneity, perhaps use a two‑model approach or a meta‑learner (e.g. uplift random forest). Adjust for confounders. Ensure the sample is large enough. Evaluate with metrics like net gain, Qini curve, or uplift AUC.
35. You notice a correlation between ad spend and conversions; how do you test if the ad spend causes more conversions (vs just correlated)?
Propose causal inference methods: A/B test or randomized controlled trial is ideal. If not possible, consider quasi‑experimental designs: difference‑in‑differences (before vs after), instrumental variables if you have a valid instrument, or regression discontinuity if applicable. Ensure consistency in data (same markets / segments), control for confounders. Check robustness via sensitivity analysis.
36. How would you model customer “uplift” to decide which customers to target with retention offers?
Start by splitting customers into treatment (offer) vs control group. Train uplift model (e.g. using uplift tree or causal forest) to estimate incremental effect per customer. Include features like usage frequency, recency and demographics. Use metrics like uplift curve, AUUC. Ensure model performance is validated correctly (avoid leakage). Incorporate cost of offers vs expected incremental revenue. Use business constraints (budget, offer capacity) to choose top customers.
LLM Prompt Optimization - Design tests to evaluate different prompts or model behaviors, especially in roles touching generative AI.
37. AI Feedback Summarization Biases
To uncover bias in a tool that summarizes manager feedback into employee summaries, first collect outputs over a representative set of input feedback (across gender, seniority, departments, etc.). Compare whether certain groups’ feedback gets summarized differently — for example, does the tool systematically downplay negative feedback for some groups? Use quantitative metrics: sentiment scores, length of summaries, presence/absence of critical vs positive content. Then perform qualitative review. Mitigate by retraining with balanced data, using fairness constraints, or giving human reviewers oversight for sensitive cases.
To evaluate deploying a multi‑modal generative AI tool (product photos + text reviews) vs a unimodal (text only) setup, you’d compare business and technical trade‑offs: richer signals may improve quality but increase risk of visual bias, higher computation cost, possible misalignment (images vs text). For bias, test whether visuals introduce unfair representations (e.g. imagery that reflects certain styles or demographics unfairly). Set up evaluation: human evaluation, error analysis across subgroups, and fairness metrics. For deployment, ensure monitoring for drift, fallback for poor visual inputs, and guardrails/prompt constraints.
39. Generative AI for Fraud Detection
To decide between using retrieval‑augmented generation (RAG), prompt engineering, or fine‑tuning for detecting financial fraud, you’d start by assessing the dataset (size, labels, text quality), model requirements (explainability, latency, cost), and domain constraints (risk/regulation). For example, if the dataset is small but descriptions are rich, prompt engineering or RAG may be better; if the dataset grows (e.g. doubles), fine‑tuning could become more viable. Also consider trade‑offs: maintenance, inference cost, risk of overfitting, ability to update model vs prompts.
Model Fairness, Bias & Monitoring - Explain how you’d detect bias in a credit approval model or monitor drift in production ML pipelines.
40. How would you detect bias in a credit scoring model?
First, define sensitive attributes (e.g. gender, race, age). Compare model outcomes across groups (e.g. false positive/false negative rates, calibration curves, precision/recall). Use metrics such as demographic parity, equalized odds and equal opportunity. Check if features proxy for protected attributes. Possibly retrain with fairness constraints or additional features. Do bias mitigation (pre‑, post‑, in‑processing). Monitor in production drift such as populations shifting, feature distributions changing.
41. A deployed model’s calibration is drifting over time—what processes would you put in place to monitor and adjust?
Set up periodic evaluation on fresh data: check calibration (e.g. reliability diagrams, expected vs observed). Monitor feature drift (statistical tests), detection of covariate shift. Use alerting thresholds. Possibly recalibrate via Platt scaling or isotonic regression; retrain model if drift is severe. Also monitor business metrics to see downstream impact. Ensure logs capture data needed.
42. You’re tasked with ensuring that a facial recognition model isn’t disproportionately misidentifying certain demographic groups. How would you test and remedy that?
Collect evaluation data with demographic labels. Measure error rates per group (false positives/false negatives). Identify if imbalance in training data may have caused bias. Explore feature distribution differences. Use techniques for fairness: rebalancing, fairness‑aware loss functions, and data augmentation. Validate improvements. Also, ensure that metrics meaningful to stakeholders are understood (legal, ethical, user‑facing).
These types aren’t yet standard, but they’re showing up more in interviews for roles at AI-focused teams, especially in fintech, healthcare, and GenAI startups. Practice at least one case from each type so you’re ready to flex whatever muscles the interview demands.
What to Expect in the Interview Format
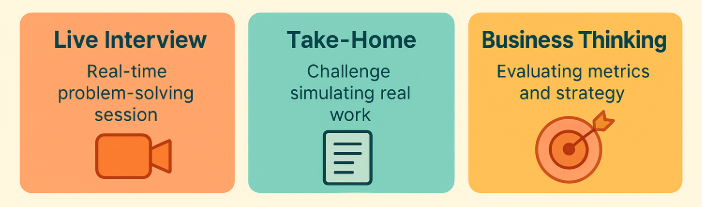
Data science case interviews vary depending on the company. You might get a live problem-solving session with an interviewer, or a take-home challenge that simulates real work. Some interviews test your business thinking. Others test your SQL or modeling skills. The key is to know what kind of case you’re walking into.
Read more: 23 Take-Home Data Science Challenges (with Examples + Solutions)
Let’s walk through what that typically looks like.
Live Interview vs Take-Home
| Aspect | Live Case Study Interviews | Take-Home Case Studies |
|---|---|---|
| Format | Real-time interview via video or phone call | Asynchronous assignment, typically 24–72 hours to complete |
| Data Provided | Usually no data or code; purely scenario-based | Dataset and problem prompt provided |
| Goal | Walk through thought process and decision-making verbally | Conduct full analysis or modeling, and submit deliverables (notebook, PDF, or slides) |
| Skills Tested | - Clarifying goals - Structuring approach - Prioritizing metrics or models - Communicating under pressure |
- Data exploration and cleaning - Analysis or modeling - Visualizing insights - Scoping and prioritizing decisions |
| Deliverables | None (just verbal communication) | Notebook, PDF report, or slide deck |
| Challenges | Thinking aloud and structuring answers clearly in real-time | Deciding scope, handling vague prompts, prioritizing key insights |
Format by Company Type (FAANG vs startups vs consulting)
| Company Type | Case Interview Style | Example Prompt or Focus Area |
|---|---|---|
| FAANG Companies | - Live and structured - Focus on metrics, experimentation, or ML strategy |
- Meta: Measure success of a new Stories feature - Amazon: Churn prediction or delivery optimization |
| Startups | - Flexible format - May include take-homes or Zoom walkthroughs |
- Emphasis on decision-making and team fit rather than coding live |
| Consulting / Analytics Firms | - Highly structured - Business-heavy with focus on KPIs and trade-offs |
- “Sign-ups dropped in a key region. What’s your next step?” |
How Long It Takes and What They Provide (data, prompt, tools)
Here’s how the formats usually break down:
| Format | Duration | What They Provide | What to Clarify |
|---|---|---|---|
| Live Interview | 30–60 minutes | - A verbal or written prompt - No data provided - Expectation to structure and discuss solutions |
- Ask how in-depth your explanation should be - Confirm if frameworks are allowed |
| Take-home Project | 24–72 hours | - Dataset (often CSV) - Problem statement (may be vague) - Instructions for submission format |
- Can you use external resources? - What tools/languages are allowed? - How will it be evaluated? |
| Schema-Only Prompt | Varies | - Description of database tables - Expectation to infer logic (e.g., attribution modeling) |
- Ask how assumptions should be documented - Confirm expected output format |
How Interviewers Assess Your Data Science Case Study Performance
Solving the case is only half the challenge. The other half is knowing what your interviewer is actually looking for. Most candidates over-focus on technical accuracy but that’s just one piece of the puzzle.
In a case study interview, your evaluation is usually based on four main areas:
Read more: Data Science Skills Test and Assessment
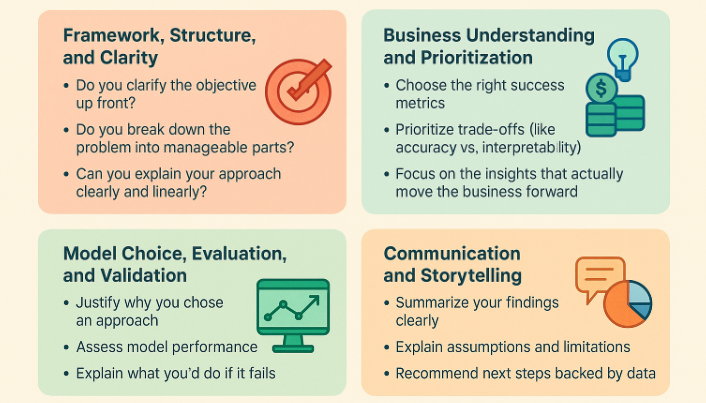
1. Framework, Structure, and Clarity
Before diving into solutions, interviewers want to see if you can break the problem down into a logical sequence. If you start organized, you stay organized even if the problem evolves. A well-structured approach often matters more than arriving at the “perfect” answer.
2. Business Understanding and Prioritization
It’s not just about models or queries, it’s about using data to drive real-world business outcomes. Good candidates understand context: what matters to stakeholders, which trade-offs are worth making, and how to tie recommendations back to KPIs that impact the bottom line.
3. Model Choice, Evaluation, and Validation
You don’t need to be a Kaggle Grandmaster but you do need to explain why a certain method fits the problem. Interviewers care more about your reasoning than whether your model has 95% accuracy.
4. Communication and Storytelling
After all your analysis, can you communicate the results clearly to both technical and non-technical stakeholders?
Many interviewers picture you in front of a stakeholder: Would they trust your recommendation Would they understand what you just said?
If you’re submitting a take-home, your written summary matters as much as your notebook. If you’re presenting live, your delivery and structure are key.
Proven Frameworks to Tackle Any Case Study Interview
When you’re staring at a vague prompt like “Why did engagement drop last week?”, it’s easy to panic or jump straight into metrics. But top candidates don’t do that. They follow a structured, reusable data science case study framework that gives their answer both clarity and direction.
You don’t need a dozen templates. You just need one that works across most formats.
Here’s the one we recommend.
5-Step Framework to Solve Any Data Science Case Study
This five-step method works whether you’re doing a live interview, a take-home project, or even a real-world product problem at work.
| Step | What to Do |
|---|---|
| 1. Clarify the Objective | Don’t assume the goal, confirm it. Ask clarifying questions like “Are we trying to improve engagement, reduce churn, or find a root cause?” Reframe in your own words. |
| 2. Plan Your Approach | Outline your plan before diving in. Will you define KPIs, build a model, or compare cohorts? Share your roadmap so the interviewer knows what to expect. |
| 3. Define Metrics and Data | Choose specific success metrics (e.g., “7-day retention by channel”) and describe the data you need and how you’d validate it. |
| 4. Analyze or Model | Perform the analysis or walk through the modeling process. Mention assumptions, trade-offs, and explain clearly—especially in live interviews or take-homes. |
| 5. Communicate Impact | Summarize key findings and explain why they matter. Connect the insight to a business outcome or recommendation. |
This structure applies to nearly every case study on Interview Query. Use it consistently, and you’ll find it easier to stay focused and make your thinking clear.
Clarifying Questions to Ask
Strong candidates don’t rush into solving. They slow down and ask sharp questions up front. Here are a few that often impress:
- What’s the business context for this problem?
- What does success look like?
- Is this a diagnostic, predictive, or decision-making problem?
- How recent or complete is the data?
- Are there any business constraints (timeline, costs, teams involved)?
You don’t need to ask all five. Just pick one or two that show you’re thinking beyond the numbers.
How to Prioritize Methods or Techniques
Sometimes you’ll feel stuck between multiple directions. Do you build a model or run an A/B test? Do you segment users or analyze trends?
Here’s how to choose:
- Start simple. Most interviewers prefer a clear baseline over a flashy model.
- Match the method to the goal. If the question is about causal impact, lean toward experiment design. If it’s about future behavior, propose a predictive model.
- Watch the trade-offs. For example, a complex tree-based model might boost accuracy but hurt interpretability. Be ready to explain why your choice is appropriate.
Time Management Tips for Live Interviews
You won’t have infinite time. Here’s how to keep things moving during a live session:
- Spend the first 3–5 minutes clarifying the problem
- Use the next 5–10 to structure your plan
- Dive into one or two key analyses — not everything
- Save 3–5 minutes at the end to summarize
If you’re running out of time, don’t rush the math. Instead, explain your direction and what you’d do next. Showing good prioritization is often better than showing a full solution.
For timed practice, pick a case from the Interview Query challenge bank, set a 30-minute timer, and simulate the pressure.
Real Case Study Walkthroughs (With Answers)
Here are four example case study questions with detailed answers to give you an idea of how to approach these problems:
Example 1: Evaluating the LinkedIn Green Dot Feature (Product Case)
Prompt: How would you analyze the effectiveness of the new LinkedIn chat feature with a green dot for active users given that we cannot A/B test it due to engineering constraints before release?
1. Clarify the Objective
The goal is to evaluate whether the green dot, which signals that a user is online increases engagement with LinkedIn’s chat feature. Specifically, we’re trying to measure whether the feature results in more messaging activity, especially from users who were previously less likely to engage.
Key clarification questions:
- What does “effectiveness” mean here? Increased message sends? First-time initiations? Higher reply rates?
- Is this a feature aimed at new users, existing users, or both?
These distinctions affect how the results will be interpreted.
2. Plan Your Approach
Since there may not be an A/B test in place, use a pre-post analysis as the main analytical framework. The core idea is to compare user behavior before and after the feature was launched.
To improve confidence in the results, the analysis should:
- Segment users based on engagement level (frequent vs first-time chatters)
- Identify users who were never exposed to the feature as a natural control group (e.g., users inactive during the launch period)
- Account for external confounders like seasonality, mobile vs desktop, or concurrent product updates
3. Define Metrics and Data
Measuring success starts with selecting appropriate metrics that reflect meaningful user behavior, not just vanity numbers.
Engagement metrics:
- Daily active chat users
- Total number of messages sent
- First-time message initiations
- Draft-to-send ratio (which can act as a signal for hesitation or user intent)
Retention metrics:
- The percentage of users who return to use chat after sending a message for the first time post-launch
- Session frequency or re-engagement rate for chat users in the post-launch period
User segmentation:
- Different user types (e.g., recruiters vs. job seekers) may behave differently
- Platform distinctions (desktop vs mobile) could affect feature visibility
- Time zones or geographies might influence when users are active and more likely to benefit from the green dot signal
4. Analyze or Model (Consider Behavior and Edge Cases)
To analyze the feature’s effectiveness, a time series or cohort-based approach would be appropriate.
Steps:
- Create pre- and post-launch windows (e.g. 2 weeks before and after)
- Compare user behavior across these periods while holding user identity constant where possible (focusing on users active in both time frames)
- Compare outcomes like message volume, reply rates, and initiations
- Use cohort views to see whether first-time users continued messaging
Also explore behavioral nuances (edge cases) like:
- Are users more likely to message someone with the green dot showing?
- Does the green dot encourage or discourage certain user groups?
5. Communicate Impact and Recommend Metrics
To executives, we’d report three simple metrics:
When presenting results to stakeholders, it’s helpful to focus on just a few key takeaways, ideally metrics that tie directly to product goals and business value.
Recommended summary metrics:
- Change in the percentage of users initiating a chat for the first time after launch
- Lift in total message volume or frequency per user compared to pre-launch
- Retention or return rate of users who initiated a chat after seeing the green dot
Frame these in terms of user engagement and feature stickiness and not just statistical significance. The goal is to show whether this feature drives meaningful, lasting behavior change.
Video Solution:
Example 2: Frequent Job Switches vs Manager Promotion (Data Analysis Case)
Prompt: Given a table of user experiences, determine if frequent job-switching leads to faster promotion to a manager role for data scientists.
1. Clarify the Objective
The central hypothesis is that data scientists who switch jobs more often tend to get promoted to manager roles faster. The goal is to test this assumption using career history data. Specifically, the focus is on understanding whether there’s a measurable relationship between number of job switches and time to first managerial promotion.
Key clarification points include:
- Should users who never become managers be excluded from the analysis?
- Is the time-to-promotion measured in months from first role to first manager title?
- What counts as a job switch - internal title changes or only external moves?
2. Plan Your Approach
To validate the hypothesis from different angles, two complementary analyses can be performed:
- Forward analysis: Segment users by how many times they’ve switched jobs, then compare the percentage of users in each group who eventually became managers.
- Backward analysis: Focus on those who already became managers. Measure how long it took them to reach that role based on how many jobs they held before the promotion.
By comparing the trends in both directions, the analysis can offer a more balanced view while minimizing bias from incomplete career histories.
3. Define Metrics and Data
The dataset should include the following:
user_id– unique identifier for each userstart_date,end_date– to measure tenure and calculate time to promotiontitle– to detect when someone became a manager- Unique job identifiers – to count the number of job switches per user
Key metrics:
For forward analysis: Promotion rate per job-switch segment
Example Segmentation for Forward Analysis (users with 5+ years of experience):
Job Switches % Promoted to Manager Never switched 10% Switched once 20% Switched twice 30% Switched three times 40% This shows a positive trend — more switches correlate with higher promotion rates.
For backward analysis:
Average time (in months) from career start to first managerial promotion per switch group
Example Output for Backward Analysis (only among managers):
Job Switches Before Promotion Avg. Time to Promotion (months) 1 50 2 46 3 44 This supports the idea that users who switch more frequently may reach managerial roles slightly faster.
4. Analyze or Model
To run the backward analysis using SQL:
WITH manager_promo AS (
  SELECT user_id,
         MIN(start_date) AS promotion_date
  FROM playground.user_experiences
  WHERE title = 'data science manager'
  GROUP BY user_id
)

SELECT num_jobs_switched,
       AVG(TIMESTAMPDIFF(MONTH, career_started_date, promotion_date)) AS month_to_promo
FROM (
  SELECT u.user_id,
         mp.promotion_date,
         COUNT(DISTINCT u.id) AS num_jobs_switched,
         MIN(start_date) AS career_started_date
  FROM playground.user_experiences u
  JOIN manager_promo mp ON u.user_id = mp.user_id
  WHERE u.start_date < mp.promotion_date
  GROUP BY u.user_id, mp.promotion_date
) grouped
GROUP BY num_jobs_switched
ORDER BY month_to_promo;
This query calculates the average time to promotion based on the number of job switches. Further refinements could include:
- Binning time into ranges (e.g., 0–20, 21–40 months) for easier interpretation
- Filtering out users with years of experience to reduce noise
- Excluding internal transfers if needed
5. Communicate Impact
The results suggest a trend: data scientists who switch jobs more frequently may be promoted to manager roles more quickly. However, this pattern must be interpreted carefully.
Several limitations apply:
- The data excludes users who have not yet become managers — they could be close to promotion, which would affect results
- The analysis doesn’t account for career intent — some individuals may not want to become managers
- Factors like company size, role type, or geography may also play a role
This insight can be valuable when advising candidates on career trajectories or when companies evaluate internal promotion paths. But the results should be used directionally, not deterministically.
Example 3: Amazon Product Search Recall Boost (ML Strategy)
Prompt: Imagine you’re on the Amazon Search team. Executives are concerned that too many relevant products are missing from the search results. Your goal is to improve recall in the product search system. How would you approach this problem?
1. Clarify the Objective
The problem is to increase recall in Amazon’s search results. That means returning more relevant products that the user would consider but that are currently being missed.
Before jumping into solutions, confirm:
- What does “relevant but missing” mean? Are there labeled examples?
- Are there specific product categories or search types where this happens more?
- Is the current system optimizing for precision (relevance) at the cost of recall (coverage)?
- Is this about candidate generation, ranking, or both?
You want to frame the problem precisely: “How do we improve the coverage of relevant results without degrading user experience?”
2. Plan Your Approach
Start by decomposing the search pipeline. Typically, there are two main stages:
- Retrieval (Candidate Generation): Narrow millions of items down to hundreds or thousands.
- Ranking: Reorder those items to show the most relevant ones on top.
Improving recall almost always starts with candidate generation. A roadmap:
- Analyze queries with known low recall (e.g., zero-result or low-click queries).
- Identify whether failure is due to query understanding, poor recall, or downstream ranking bias.
- Expand the candidate pool using query rewriting, embeddings, synonyms, or semantic similarity.
- Validate whether improvements actually return relevant products (not just more results).
3. Define Metrics and Data
Key metrics to track:
- Recall@K: Of all known relevant products, how many appear in the top K?
- Coverage: % of queries that return at least one result
- Click-through rate (CTR) on added candidates
- Relevance score distribution of newly recalled items
Supporting data:
- Click logs and search session data
- Labeled relevance datasets (human-rated or derived from user behavior)
- Query embeddings or historical query clusters
- Product metadata and category hierarchies
4. Analyze or Model
To increase recall, consider these modeling strategies:
- Query Expansion/Rewriting: Add synonyms, correct typos, and rewrite vague terms using historical click logs or query embeddings.
- Semantic Search: Use transformer-based models (like BERT or Amazon’s internal embedding models) to find semantically similar items, even if keywords don’t match.
- Category-Based Recall: Infer the user’s intent category early, then recall items from that entire class to avoid missing edge cases.
- Long-Tail Optimization: For rare queries, leverage transfer learning, user-level personalization, or popularity-based backfill methods.
Remember, boosting recall can hurt precision. Always monitor trade-offs with offline evaluation and online A/B testing, especially around:
- Time to first click
- Cart addition rates
- Session abandonment
5. Communicate Impact
When presenting to executives or cross-functional teams, shift the focus from ML modeling to customer and business impact.
For example:
- “We improved Recall@20 by 18% on long-tail queries, while maintaining CTR”
- “Zero-result queries dropped by 40% for searches in the apparel category”
- “Customer satisfaction scores on search relevance improved in post-purchase surveys”
Position your solution as a system-level improvement and ****not just an ML tweak. Show how it drives better discovery, more conversions, and higher customer retention.
Example 4: Instagram A/B Test Success Metric (Experiment Design)
Prompt: You’re running an A/B test for a new Instagram feed ranking algorithm. The goal is to improve user satisfaction. How would you define success metrics? What would you watch out for?
1. Clarify the Objective
The high-level goal is to measure whether a new feed ranking algorithm improves user satisfaction. But “satisfaction” is vague, clarifying it is critical before launching an experiment.
Key clarifying questions:
- Are we optimizing for engagement (likes, comments), retention (7-day, 28-day), or perceived quality (subjective ratings)?
- Does satisfaction mean short-term boosts or long-term retention?
- Are there specific user segments (e.g. creators, casual users) that matter more?
A refined objective might be: Evaluate if the new ranking leads to better quality engagement and improved user stickiness, without negative side effects like decreased creator visibility.
2. Plan Your Approach
Start by scoping the experiment with these steps:
- Identify primary success metrics tied to user satisfaction.
- Define guardrail metrics to ensure no critical behaviors are harmed.
- Decide on segmentation: global test or segmented (e.g. high-usage vs low-usage users).
- Determine test duration and power: long enough to detect behavioral lift.
This framing shows you’re tracking metrics as well as designing a responsible experiment with checks and balances.
3. Define Metrics and Data
Primary Success Metrics (Proxies for Satisfaction):
- Time Spent on Feed: More time may indicate higher interest, but must be interpreted carefully.
- Session Depth: Number of posts viewed, time per post.
- Engagement per Session: Likes, shares, comments normalized by feed exposure.
- Return Rate: 7-day and 28-day retention rates.
Guardrail Metrics (To Prevent Harm):
- Negative Feedback Rate: “Hide post,” “Not interested,” or “Report.”
- Content Diversity: Are we unintentionally collapsing variety?
- Creator Impressions / Reach: To avoid harming distribution.
Additional Considerations:
- Ensure device/platform consistency (e.g. Android vs iOS)
- Track scroll behavior: did users engage less despite longer sessions?
- Check distribution shifts: does the model favor a small set of content?
4. Analyze or Model
Once the test is live:
- Use A/A testing beforehand to validate tracking instrumentation and variance.
- Run holdout analysis to estimate counterfactuals, if needed (e.g. compare a small group of users who weren’t exposed to the new feed (the holdout group) with those who were, to better understand what would have happened without the change).
- Visualize distributions, not just averages (e.g. do heavy users behave differently?)
- Break results into cohorts: age, usage frequency, geography.
Also, monitor time-lagged effects: a feed might initially increase clicks but lead to burnout days later. Watch for day-over-day decay in metrics.
Statistical tests like t-tests or bootstrapped confidence intervals can help validate that observed lifts are significant.
5. Communicate Impact
Summarize results in terms of both metric lift and user experience improvement.
Example framing:
- “The new ranking increased session depth by 12% and retention by 3%.”
- “Creator reach stayed within ±2%, confirming fairness wasn’t compromised.”
- “Feedback rates dropped slightly, suggesting improved content quality.”
Tie the impact back to user goals (“relevant content faster”) and business goals (“higher daily active usage, better ad opportunities”).
Finally, include a recommendation: whether to launch, iterate, or roll back based on trade-offs observed.
Common Mistakes in Case Interviews (And How to Recover)
Even the strongest candidates stumble in case interviews not because they don’t know enough, but because they fall into avoidable traps. The good news is that most of these case study interview mistakes are predictable. Once you know what to watch out for, you can steer clear or recover if you hit one.
Let’s go through the five most common ones.
Starting Without Clarifying the Problem
This is the single most common mistake. A candidate hears a problem like “retention is dropping” and dives straight into solutions without asking what kind of retention, which user segment, or what time frame we’re talking about.
Here’s how to avoid it:
- Restate the goal in your own words
- Ask clarifying questions about scope, time period, or user group
- Confirm what success looks like
Even if you’re wrong about your first assumption, your interviewer will appreciate that you tried to nail down the objective before going further.
Overengineering the Model Without Business Justification
Another common pitfall is jumping to the most complex solution. You get asked to predict churn or detect fraud, and you immediately start talking about neural networks and ensemble models.
The problem? You haven’t explained why that level of complexity is necessary.
Instead, ask yourself:
- What’s the baseline I can start with?
- Is interpretability important in this context?
- Would a simple model actually get us 90% of the way there?
For example, in a prompt like “How would you model churn in a financial context with class imbalance?” you’ll impress the interviewer more by starting with logistic regression and explaining class weighting than by diving into XGBoost with no context.
Ignoring Metrics That Matter to Stakeholders
Sometimes candidates run the perfect analysis and completely miss the point.
They optimize for accuracy when the business cares about retention. They design an experiment with beautiful statistics but forget to define a success metric that product managers actually track.
Before you go too deep, ask yourself:
- Who are the stakeholders?
- What decision are they trying to make?
- What metric would they care about most?
Poor Verbal Structure or Overloading with Jargon
It’s easy to overwhelm the interviewer with technical detail especially in live interviews. You start explaining your model, feature pipeline, and metrics all in one breath, and suddenly they’re lost.
Here’s how to stay clear:
- Talk in bullet points, even if you’re speaking
- Use short sentences with a clear topic per point
- Avoid jargon unless it’s necessary and explain it if you use it
Getting Stuck - What to Say and Do
You’ll freeze at some point. It happens to everyone. The key isn’t to avoid getting stuck, it’s to know how to handle it when you do.
If you’re stuck:
- Re-state what you do know
- Talk through your options out loud
- Ask the interviewer a clarifying question to buy time
- Pivot to a smaller part of the problem that you can solve
For example, in a take-home case where the goal is unclear, it’s better to document your assumptions and proceed than to leave things blank.
If you’re stuck during a live session, say something like: “I’m considering two approaches here — either comparing week-over-week engagement or segmenting by user cohort. I’d like to walk through both quickly before choosing. Is that okay?”
That kind of thinking earns points, even if the final answer isn’t perfect.
Top Case Interview Mistakes and Quick Fixes at a glance
This table highlights the most common pitfalls in data science case interviews, and how to recover fast when things go off track.
| Common Mistake | Description | How to Recover / Avoid It |
|---|---|---|
| Starting Without Clarifying the Problem | Jumping into analysis without defining the goal or scope leads to irrelevant insights. | Restate the objective, ask clarifying questions, and confirm success criteria before starting. |
| Overengineering the Model | Using complex models without business need wastes time and confuses interviewers. | Start simple, justify complexity, and explain trade-offs (e.g., interpretability vs. accuracy). |
| Ignoring Stakeholder Metrics | Focusing on technical metrics instead of business outcomes like retention or revenue. | Identify stakeholders, align on their goals, and track metrics that drive decisions. |
| Poor Verbal Structure / Excessive Jargon | Rambling or using unexplained technical terms loses clarity. | Speak in bullet points, use plain language, and summarize before explaining details. |
| Getting Stuck During the Interview | Freezing or going silent when unsure. | Re-state what you know, think aloud, ask clarifying questions, and tackle a smaller sub-problem. |
Communication and Presentation Tips for Data Science Case Questions
Strong communication during case study storytelling **helps you explain your solution and get hired.
Whether you’re presenting a take-home project or talking through a case live, your ability to structure your thoughts, choose the right level of detail, and connect your work to business outcomes is what turns a good answer into a memorable one.
Read more: How to Present a Data Science Project (With Examples)
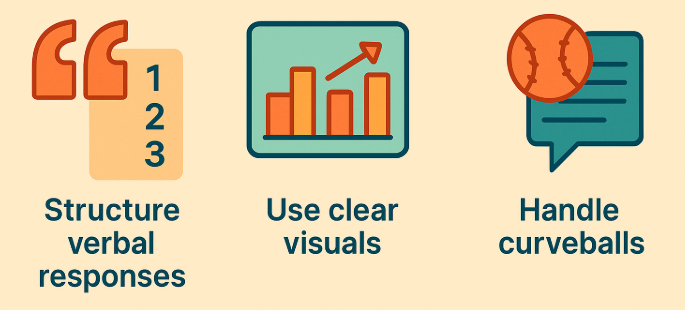
How to Structure Verbal Responses in a Data Science Case Interview
Your interviewer is evaluating what you say and also paying close attention to how clearly and logically you communicate data insights.
A few tips:
- Start with a headline. One sentence that summarizes your takeaway before diving into detail.
- Break it down into three points. People retain ideas better in sets of three. It also keeps you from rambling.
- Use signposts. Say things like “First, I’d segment the users,” or “Next, I’d look at the funnel drop-off.”
Here’s a quick example in context: “My hypothesis is that retention dropped due to changes in the onboarding experience. First, I’d compare drop-off rates in the signup flow before and after the change. Then I’d segment by acquisition channel. Finally, I’d check for any product bugs that launched in the same time window.”
That’s it. Simple structure, clear logic.
Visualization Best Practices
If your case interview includes a take-home component or notebook submission, clean visuals are just as important as clean code.
What interviewers are looking for:
- Titles that explain the chart’s takeaway, not just what’s plotted
- Axis labels and units that are readable at a glance
- Charts that support your narrative
When in doubt:
- Use bar charts for comparisons
- Use line charts for trends over time
- Avoid pie charts unless you really need them
And don’t overdo it. One great plot beats five mediocre ones.
Handling Curveballs and Follow-Up Questions
Case interviews are meant to be dynamic. Interviewers will often throw in a new constraint mid-way through or ask “What if we didn’t have that data?” just to see how you react.
The worst thing you can do is freeze. Here’s what to do instead:
- Stay calm and repeat the updated prompt back to them
- Treat it as a version two of your earlier answer
- Say something like: “In that case, I’d shift from tracking conversions to looking at session length as a proxy for engagement. It’s not perfect, but it could still provide signal.”
Good interviews aren’t about perfect answers. They’re about showing how you think when the situation changes.
Preparation Strategy for Data Science Case Studies
Case study interviews test whether you can think clearly and analytically in unfamiliar situations, often with imperfect data or under vague instructions.
With the right strategy of how to prepare for data science case study interviews **and 2 to 4 weeks of focused practice, you can build real confidence.
Read more: How to Prepare for a Data Analyst Interview
Practice Schedule (2–4 Week Plan)
You don’t need to overtrain. But you do need consistent practice. Here’s a sample plan you can adapt based on your timeline:
| Week | Goals | Activities |
|---|---|---|
| Week 1 | Understand case formats and develop structure | - Read 3–5 solved case studies - Practice prompt clarification aloud - Try 1 SQL/product case daily from Interview Query challenges |
| Week 2 | Improve delivery and depth of analysis | - Work through 2 full-length case studies with peer or timer - Focus on communication & summary - Solve one take-home challenge and review using Interview Query’s take-home tool |
| Week 3–4 (Optional) | Polish delivery and handle curveballs | - Simulate live interviews - Time-box responses to 30–40 mins - Practice curveball handling & presentation polish |
If your goal is a FAANG interview, double down on metrics design and experimentation. For startups, expect more product intuition and messy data.
Tools: Mock Interviews, AI Practice Tools
To simulate real interviews, use:
- Interview Query peer mock interviews: Pair with another candidate to practice.
- Get instant feedback using the AI Interview Tool and practice explaining your reasoning clearly.
- Jupyter Notebooks with saved templates for EDA, model selection, or reporting.
Have a reusable notebook setup where you can quickly drop in a dataset, generate summaries, and plot charts. Time spent building your toolkit pays off under pressure.
FAQs on Data Science Case Study Interviews
What is a data science case study?
A data science case study is a real-world business scenario where you apply data science techniques, like analysis, modeling, and experimentation—to draw insights or make decisions. It’s designed to test not just coding ability, but your problem-solving, communication, and business reasoning skills.
How do data science case studies impact the industry?
Data science case studies help bridge the gap between theory and practice. They showcase how analytics, machine learning, and experimentation drive measurable business impact, like improving customer retention, optimizing pricing, or personalizing recommendations. Many companies use them internally to guide data-driven decision-making.
Why are data science case study interviews important at FAANG+ companies?
FAANG+ companies use case studies to evaluate whether candidates can translate data into strategy. These interviews test how you define metrics, handle ambiguity, and align technical work with business goals—skills that matter far more than pure coding proficiency in roles at Meta, Amazon, or Google.
How do I prepare for a data science case study interview?
Start by mastering frameworks for structuring problems—clarify the goal, define success metrics, outline your approach, and explain trade-offs. Then, practice case questions involving product metrics, A/B tests, or predictive modeling. Reviewing solved examples and mock interviews helps build confidence and fluency.
What types of case studies are asked in data science interviews?
Common types include:
- Product & Business Cases (e.g., drop in engagement or churn analysis)
- SQL & Data Analysis Cases (metric design, attribution, cohorts)
- Machine Learning Cases (model framing, feature design, validation)
- Experimentation & Causal Inference Cases (A/B test setup, interpreting results)
These mirror the real problems data teams tackle in modern tech organizations.
Data Science Case Study Interview Checklist and Resources
By now, you’ve seen how wide-ranging data science case study interviews can be—from product drop-offs and A/B tests to modeling strategies and LLM prompt evaluation. The formats vary, but the core goal stays the same: Can you take an ambiguous business problem and turn it into structured, data-informed thinking?
Before you go into your next interview, take a minute to run through this checklist. It’s the same list used by top candidates and by many of the hiring managers evaluating them.
Your Case Interview Checklist
✓ Did you clarify the business goal?
Make sure you know exactly what success looks like before diving in.
✓ Did you define the right metrics or outputs?
Think in terms of measurable impact—not just generic performance.
✓ Did you structure your approach clearly?
Use frameworks and explain your roadmap before getting into the weeds.
✓ Did you communicate your findings in plain language?
No jargon walls. Make your insights easy to understand.
✓ Did you tie your answer back to business outcomes?
Always end by explaining why it matters and what the company should do next.
Practice Next: Case Study Datasets, Platforms and Resources
You don’t need to wait for an interview to get started. Use open-source datasets and prompts to simulate the experience.
Ready to practice real interview case studies? Explore the Interview Query Case Study Bank for real prompts used by top companies, organized by role and topic.
Want hands-on, results-driven prep? Tackle Interview Query Challenges — curated SQL and analytics case questions with expected outputs.
Looking for real-world datasets? Find diverse practice data on Kaggle Datasets or search niche topics using Google Dataset Search.
Preparing for a specific role? Dive into tailored case prep with:
- Data Analytics Case Study Guide
- Business Intelligence Case Study Guide
- Marketing Analytics Case Study Questions
- Data Engineer Case Study Interview Questions
Pick a use case, then ask yourself: What business problem could this dataset help solve? What analysis or model would I build? How would I present the insight to a stakeholder?
Case study interviews aren’t about being perfect. They’re about showing how you think. If you bring structure, ask smart questions, and connect the data back to decisions, you’ll be ahead of 90% of candidates.