
DoorDash Analytics Case Study Interview Questions (with Answers)


Overview
To land an analytics or data science role at DoorDash, you must successfully clear one or two case study interviews — typically during the second round, after your initial screening. These case studies are designed not only to test your analytical skills but also your coding proficiency, especially in SQL and Python.
DoorDash analytics case studies primarily assess your ability to:
- Formulate relevant metrics for hypothetical business scenarios.
- Write SQL or Python code to extract and analyze those metrics from real datasets.
Generally, DoorDash case studies fall into three key categories:
1. SQL Analytics: These require you to analyze a business problem and write SQL queries to generate actionable metrics.
2. Product Metrics: Focused on product sense, these questions ask you to measure success, evaluate feature changes, or understand trade-offs reflected in product metrics.
3. Business Initiatives: These test your business acumen by asking you to assess the potential impact of new features or strategic initiatives.
This blog provides expert strategies, real DoorDash analytics case study questions, and a step-by-step video walkthrough—all designed to boost your confidence, sharpen your problem-solving skills, and help you succeed in your DoorDash interview. Whether you’re aiming to master SQL queries, strengthen your product sense, or nail business case discussions, this guide has you covered.
Framework and Tips for DoorDash Analytics Case Studies
No matter the company, there is a specific analytics framework to follow for data analytics case study interviews. The steps are:
- Ask clarifying questions to understand the problem fully.
- Use the components of the question to make reasonable assumptions.
- Formulate a hypothesis based on your understanding.
- Provide relevant metrics and perform data analysis to test your hypothesis.
- Propose actionable solutions based on your findings.
Always remember: Make your recommendations ACTIONABLE—the goal is to drive meaningful business impact.
Here are some specific tips tailored for DoorDash analytics case studies:
- Consider DoorDash’s business model: DoorDash has three main user bases—customers, merchants, and Dashers (delivery drivers). Each has distinct pain points and priorities. Your answers should reflect a solid understanding of these groups and address their challenges appropriately.
- Familiarize yourself with the data: While you won’t get actual DoorDash data before the interview, practicing with sample datasets helps. Common data points include delivery times, order value, tip amounts, driver profiles, and customer accounts.
- Ask for clarification: DoorDash case studies are often open-ended and vague initially. For example, you might be asked why there’s significant variation between order times and pickup times. Practice asking insightful clarifying questions to narrow the problem.
- Communicate clearly: Walk the interviewer through your thought process step-by-step. Explain your assumptions, analysis, and reasoning so they understand how you arrive at your conclusions.
- Manage your time effectively: Case study interviews are time-bound. Allocate your time wisely between understanding the problem, analyzing data, and crafting recommendations to ensure you cover all parts thoroughly.
- Prioritize business impact: DoorDash operates in a fast-paced environment with multiple competing priorities. When proposing solutions, emphasize how your recommendations prioritize the biggest levers for growth, efficiency, or user satisfaction.
- Understand DoorDash’s market context: Familiarity with DoorDash’s competitive landscape, recent product launches, and market trends can strengthen your hypotheses and solutions, demonstrating business savvy.
Check out the linked video walkthrough for a more contextualized example of how to approach analytics case studies, including a narrated coding deep dive. It is very similar to what you might face at DoorDash. While watching, keep in mind the tips above and how you would adjust your approach:

Now, we can look at real DoorDash case studies and how we can apply the approaches we have covered.
DoorDash Case Study: Analytics Take-Home
In addition to live, interviewer-led case studies, DoorDash may assign a take-home analytics project as part of your interview process. Unlike real-time problem-solving, this round evaluates your ability to work independently with data, structure a clear business narrative, and communicate actionable insights through a report or presentation.
You’ll typically receive a business scenario (e.g., a sudden drop in order completion rates or a new incentive program for Dashers) along with a sample dataset. Your task is to analyze the data, identify root causes or opportunities, and deliver recommendations in a well-structured format—usually a slide deck or a document.
This round assesses:
- Data exploration and visualization skills
- Your approach to framing business problems and hypotheses
- Ability to prioritize key metrics
- Structured storytelling and executive communication
In this section, we’ll walk through:
- The typical format of DoorDash take-home case studies
- How to approach data analysis when working offline
- Tips for structuring your findings in a presentation-ready format
- Common pitfalls to avoid in take-home submissions
Question:
Analyze the provided data and generate specific recommendations for improving our business. Provide any supporting analysis and state your assumptions in your work.
The dataset includes information like:
- Customer order time
- Restaurant order time
- Driver arrives at restaurant time
- Order delivered time
- Driver ID
- Customer ID
- Amount of discount
- Amount of tip
How to Solve This Question:
With Doordash take-home assignments, you should start by asking questions. Then, you should perform your analysis and, ultimately, package that analysis and showcase your insights.
1. Start by Asking Questions
You can start with some broad questions like: What can I learn from this dataset, and what potential insights can I generate that would be of value? As you develop your questions, also think about specific metrics that you can pull to help answer them.
For example, you might have questions like:
- What can the timestamp components tell us about delivery efficiency?
- Does order value affect tipping?
- Which merchants generate the greatest volume of orders? Where are these merchants located?
- How efficient are Dashers? What are the average earnings of Dashers?
Develop your questions and remember to consider all three aspects of the Doordash business model: customers, Dashers, and merchants. Answering these questions, for example, would provide business insights affecting all three user groups.
Additionally, you should consider metrics. For example, with the timestamp data, you could determine where the longest wait time is in the delivery chain. You could also identify average tip values, average order size by merchant, average customer order value, etc.
2. Document Your Work
As you perform your analysis, provide examples of your work. Here’s a look at a Doordash analytics case study project on GitHub. The user provides visualizations and detailed SQL queries used in the analysis.
Here’s a look at a visualization from the project, showing the correlation between discount and tip amount:
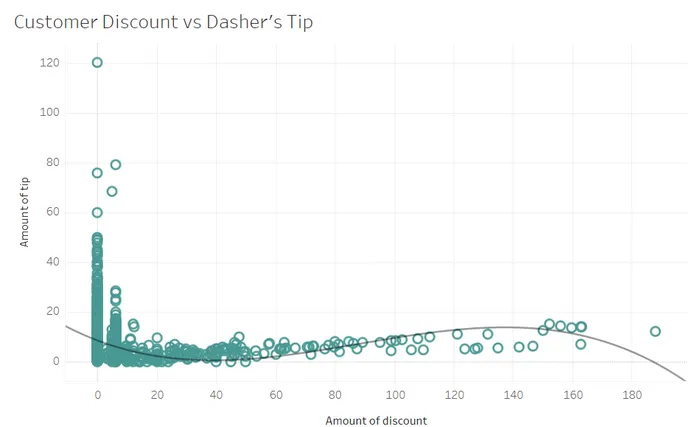
3. Provide Clear Recommendations
Finally, you want to package your analysis and provide recommendations for the business. This is your chance to show off your business and product sense. Here are some example insights from the given dataset:
Merchant Partnerships - Identify the top merchants from the data regarding average order value and daily orders. This data could used to reward these merchants through promotions or advertising and strengthen partnerships with these high-growth stores.
Operational Efficiency - Identify the longest wait times in the delivery chain. This insight helps identify potential breakdowns in the delivery chain. How can you use this information to reduce delivery times?
Average Wages for Dashers—The provided data shows the average tip amount and daily tip amount earned per driver. This can be used as a marketing tool to encourage Dasher sign-ups.
These are just a few of the insights you could generate. Hopefully, they illustrate what direction you can take in your analysis. Ultimately, your goal should be to provide compelling recommendations that showcase your ability to work with data and your business sense.
4. Form Hypotheses to Drive Your Analysis Before diving into data crunching, define clear hypotheses. For example:
Hypothesis 1: “Higher discount rates lead to lower tip amounts per order.” Hypothesis 2: “Restaurants with longer prep times significantly delay order delivery.” These hypotheses guide your analysis and show your problem-solving mindset.
5. Prioritize Metrics That Drive Business Impact Not all metrics are created equal. Structure your analysis to focus on:
- High Impact, Easy to Influence Metrics (e.g., Merchant Order Volume)
- High Impact, Hard to Influence Metrics (e.g., Customer wait time during peak hours)
By clearly prioritizing metrics, you demonstrate an ability to focus on what will move the business needle.
6. Highlight Data Limitations & Assumptions DoorDash will look for candidates who understand data caveats. Explicitly state:
- Lack of customer satisfaction metrics (no NPS or ratings in dataset)
- Absence of external factors like traffic or weather conditions
- Tipping data may exclude cash tips
- Mentioning these will show your critical thinking and analytical maturity.
7. Bucket Recommendations by Effort & Impact Organize your suggestions into:
Quick Wins (Low Effort, High Impact):
- Incentivize high-performing merchants with promotions.
- Improve in-app driver arrival notifications to reduce wait times.
Long-term Strategic Initiatives (High Effort, High Impact):
- Implement operational changes to reduce restaurant prep times.
- Re-design incentive structures for Dashers based on efficiency metrics. This shows you understand resource prioritization and stakeholder buy-in.
8. Prepare Deliverables in Business-Friendly Formats Structure your final submission to be executive-friendly:
- SQL/Python Notebooks with comments for code transparency
- Slide Deck (3-5 slides) summarizing key insights, metrics, and business recommendations
- Visualizations/Dashboards to make complex data intuitive
Presentation is as important as analysis—DoorDash values how well you communicate insights.
9. Showcase Cross-functional Thinking Demonstrate how your analysis will require collaboration with:
- Product Managers (to refine business assumptions)
- Operations Teams (to implement efficiency strategies)
- Engineering Teams (for data pipeline or product feature improvements)
This shows you’re thinking beyond data and understand real-world execution dynamics.
Test your skills with real-world analytics challenges from top companies on Interview Query. Great for sharpening your problem-solving before interviews. Start solving challenges →
DoorDash Case Study: Business Case Practice Problem
Here are two more DoorDash interview questions that can help you practice and refine your approach for your upcoming Doordash interview:
1. Let’s say you’re working on Doordash demand-side deliveries. Doordash is launching delivery services in New York City and Charlotte and needs a process for selecting Dashers (delivery drivers).
Important starting question: Are the operating conditions the same in both cities and how to do those impact deliveries? How would we go about deciding which Dashers are assigned deliveries?
How to Solve This Question:
Different cities mean different conditions within which to operate. For example, consider the urban density of the two markets in terms of mode of transportation. In New York City, where the buildings and restaurants are packed together tightly, Dashers may rely on bicycles or electric scooters. In a sprawling city like Charlotte, where restaurants and homes are further apart, a Dasher would likely use a car.
As a result of how Dashers navigate their city, you would want to adjust your thinking for the unique traffic patterns and realistic delivery ranges that impact delivery times.
Next, when it comes to how to choose Dashers to be assigned orders, think algorithmically. What inputs and outputs might be used in the model? For example, in using a Dasher for a particular order, we have a feature input such as:
- # of outstanding requests
- # distance to restaurant and customer
- # of available couriers on the road
- # of successful deliveries
- Dasher ratings
You can then measure these against output variables like customer satisfaction or actual completion time versus estimated completion time (on-time vs. late deliveries). However, it would likely result in some sort of bias that has to be accounted for.
Again, this isn’t a traditional analytics case study because you don’t have a dataset to analyze. But if you had a dataset for this type of question, you might think about metrics like:
- Average delivery time
- # of orders that were within the estimated delivery time
- Customer satisfaction score
- % of on-time deliveries
2. How would you determine whether telling the dashers to go online to meet delivery demands is effective?
Here’s a featured answer from one of our community members, pdmhkr20:
- Clarifying Question:
When “online” is mentioned, does it refer to a notification sent to all drivers on their app, regardless of whether they are online or offline? Or is it specifically to alert drivers who are offline so that, based on their availability, they can decide whether to take up deliveries?
- Assumptions:
Assuming that this feature allows more drivers to deliver food to customers, it would lead to reaching more customers, which in turn would generate more orders and, thus, more revenue. Therefore, it is assumed that increasing the user base is the key driver for the success of this feature, and the analysis will be based on this assumption.
- Analyzing User Flows:
DoorDash has three types of users: ***customers, *** dashers, and *** merchants. The impact of the feature change on all these segments will be analyzed to understand its effect on the entire ecosystem.
Firstly, based on the number of customer orders, which represents the demand, push notifications or emails will be sent to dashers, asking them to go online to meet the demand and thereby increase the supply. The dashers see the notifications, accept the deliveries, go to the restaurant, pick up the order, and deliver it to the customers.
From the restaurant’s perspective, they can accept more orders with more dashers available.
From the customers’ viewpoint, there will be fewer order cancellations.
Examine exactly how the product works. How does a user access a certain feature? How does a user use a certain feature? What kinds of different users are there?
- Define Metrics:
Based on the user flows mentioned, the following metrics can be defined for the three groups:
Dasher:
- Number of deliveries fulfilled per hour
- Average distance traveled
- Dasher Volume: Number of dashers available per hour
- Time spent on the app after receiving the notification
Merchants:
- Number of orders accepted
Customers:
- Number of orders
- Value of the orders
- Customer rating
- Number of canceled orders per customer
- Time between order placement and order receipt
Since the main interest is increasing customer orders on the platform and retaining customers, the key metrics to determine if the feature is working properly are average delivery times per hour and the number of customer orders.
- Test Hypothesis or Actionable Recommendations:
To test the hypothesis, group the dashers who went online during peak hours after receiving the notification and compare them with those who did not go online. Analyze if the delivery times decreased as the number of drivers increased.
Conduct A/B testing to validate the results.
3. Let’s say you work as a data scientist at DoorDash. You are tasked to build a machine-learning system that minimizes missing or wrong orders placed on the app. How would you go about designing this system?
Here’s a featured answer from one of our community members, poised-gold-tahr:
- Confirming Goal
minimizing wrong orders before users place or when users are placing the orders?
- Model Target
Order cancellation rates can be accessed via self-service cancellation or by contacting support to cancel an order. Since this is a binary variable, a binary classification model is applicable.
- How do Users Interact with the System
a banner/in-app notification when a wrong order is predicted, when the user lands on the restaurant page, and when the user is at check-out.
- Reasons for Wrong Order
- wrong address (when GPS location does not agree with the user-selected delivery address)
- distance too far away (for pick up orders)
- quantity too large
- delivery time/schedule etc.
- Features to Collect
past app interactions:
- customer past orders
- customer past cancellation and cancellation reason geolocation:
- distance between customer geolocation & merchant wrong delivery time:
- merchant hour (open/not open)/type of food (i.e., late night food/breakfast etc.) order features
- number of items
- subtotal of order
we should balance between precision and recall. In this case, wrong orders will cause customer/merchant/dasher dissatisfaction if we fail to detect (FN) & if we notify users too often when it’s not the wrong order (FP), they might abort the checkout process. This is also dependent on the intervention we build. [For example, instead of a notification at the checkout page, we might want to ask users if they need to update their delivery address when they open the app and are hundreds of miles away from their usual delivery address. In this case, we may care more about recall]
Supposing we build the prediction model to predict wrong orders when users are on the checkout page, optimizing for precision, and we pop up a window/in-app notification to ask the user to confirm the order again. We should perform offline testing and AB testing to determine effectiveness before launching.
- AB Testing
after offline testing, we should design an AB test & roll-out plan.
- prereq: unit of randomization: customers (for consistent user experience); targeting - registered customers who placed at least one order; variant: test (in-app notification at checkout) control (default checkout experience); confirm goal and metric of ethe experiment - primary KPI is order cancellation rat,e and guardrail is revenue or number of orders
- power analysis to determine proper experiment duration based on prior traffic & design roll-out
- evaluation: a. monitor model precision/recall in production (this can be seen in the control group where no intervention was done) b. evaluation based on primary KPI and guardrails
- launch decision
Common Mistakes Candidates Make in DoorDash Case Studies
Even strong candidates can stumble on case interviews if they fall into these common traps:
Jumping into SQL/Python too soon: Before writing any code, you need to scope the business problem and define what success looks like. Many candidates lose points by diving into data queries without a hypothesis or clear objective.
Ignoring DoorDash’s three-sided marketplace: Your analysis should always account for customers, Dashers, and merchants. Focusing on just one user group shows a limited product sense.
Not asking clarifying questions upfront: DoorDash case prompts are intentionally vague. The interviewer expects you to clarify goals, assumptions, and constraints before solving.
Forgetting to state assumptions: Good analysts always communicate what they’re assuming due to lack of data or ambiguity. This is crucial when you’re dealing with real-world data limitations.
Overcomplicating models or solutions: Your recommendations don’t need to be fancy. Simple, actionable insights that tie back to business objectives are often more impressive.
Sample Framework for Structuring DoorDash Business Case Answers (Cheat Sheet)
When you’re faced with a DoorDash analytics case study—be it take-home or live—use this simple but powerful structure to organize your thoughts and stand out:
DoorDash Analytics Case Framework:
1. Clarify the Problem Statement
Who is affected? (Customer, Dasher, Merchant) What does success look like?
2. State Your Assumptions
What’s unknown? Any constraints (data availability, operational factors)?
3. Define Success Metrics
Primary KPIs (e.g., delivery time reduction, order growth) Supporting metrics (e.g., Dasher satisfaction, merchant opt-in rate)
4. Analytical Approach
What data would you need? What queries/analysis would you run? (SQL/Python/Data Viz) Any experimentation or A/B testing needed?
5. Recommendations
Actionable suggestions backed by data. Consider trade-offs and limitations.
6. Risks & Next Steps
Any potential blind spots in your analysis? Propose follow-up analyses or testing.
FAQs About DoorDash Analytics Interviews
How technical are DoorDash analytics interviews?
Expect a balanced mix. You’ll need to demonstrate solid SQL/Python skills for querying and analyzing data, but equal emphasis is placed on business acumen—interpreting data and making actionable recommendations.
Does DoorDash provide data during case interviews?
For take-home assignments, you’ll typically receive a dataset. For live interviews, you’ll be asked how you would approach the problem with data (often without access to actual datasets). They want to assess your analytical thinking and problem-scoping.
How should I prepare for DoorDash case studies?
Practice structured problem-solving using real datasets, simulate business scenarios, and brush up on SQL and exploratory data analysis (EDA). Review DoorDash’s business model deeply and stay ready to discuss metrics, trade-offs, and operational constraints.
How do I showcase product sense in an analytics interview?
Always tie your analysis back to DoorDash’s three core users—customers, Dashers, and merchants. Show that you understand how metrics and decisions impact the user experience and business growth.
Will I need to design experiments (A/B tests)?
It’s very likely. DoorDash cares about data-driven decision-making, so be prepared to discuss how you’d structure an A/B test, define success metrics, and account for edge cases like selection bias or confounding variables
How hard is the DoorDash interview?
DoorDash interviews are challenging but fair. The company expects candidates to demonstrate a balance of analytical rigor, product sense, and business intuition. The difficulty level depends on the role, but for analytics and data science positions, you should be ready for SQL/Python coding challenges, case studies that test problem-solving skills, and behavioral interviews assessing cultural fit and collaboration abilities. Structured preparation and understanding DoorDash’s marketplace dynamics significantly improve your odds.
How should I answer “Why do you want to work at DoorDash?”
To craft a compelling answer, tie your response to DoorDash’s mission and business model. Highlight how you’re passionate about solving real-world logistical challenges, working at the intersection of data and product, and contributing to a platform that serves millions of customers, merchants, and Dashers. Personalize it by mentioning a specific DoorDash product initiative or value that resonates with you, and how your skills align with driving impact in that area.
Is it easy to get hired at DoorDash?
DoorDash maintains a competitive hiring process, especially for analytics and technical roles. While the company is scaling and frequently hiring, landing an offer requires thorough preparation, strong analytical problem-solving, and the ability to translate data insights into actionable business recommendations. The key is not just technical proficiency but showcasing how you can make decisions that move the needle for DoorDash’s complex three-sided marketplace.
What is the best way to answer “What is your biggest weakness?” in an interview?
Frame this answer as a growth-focused reflection. Choose a real, professional weakness (e.g., “I sometimes overanalyze datasets before moving to high-level summaries”) and then pivot to how you are actively working on it (e.g., “I’ve been using structured frameworks to balance deep dives with time-efficient analysis”). The goal is to show self-awareness, a learning mindset, and that your weakness won’t hinder your ability to succeed in the role.
Resources for the DoorDash Interview
If you have a DoorDash data science interview coming up, practice with these resources from Interview Query:
Ready to ace your DoorDash analytics interview? It’s not just about knowing SQL or metrics—you need to think like a DoorDash analyst, solve problems under pressure, and connect data to business outcomes. That’s where Interview Query comes in with company-specific learning paths, mock interviews, and curated question banks tailored toward roles at DoorDash and similar companies
With resources like the DoorDash Analytics Interview Guide and 2025 Data Analytics Case Study Practice Set, you’ll get access to real case questions, detailed walkthroughs, and coaching support designed to boost both your analytical skills and product intuition.
Take the next step—explore more analytics case study questions, try mock interviews on Interview Query. Bookmark this blog or share it with peers who are also prepping. It could be the difference between applying and offering. You’ve got this!