
Analytical Approach and Framework (Updated in 2025)


What is an analytical approach and framework?
An analytical framework is a structure that helps us make sense of data in an organized way. We take an analytical approach by dividing a complex problem into clear, manageable segments and then reintegrating the results into a unified solution.
Below, we will explore how and when to use three types of analytical frameworks:
- A Framework for Qualitative Research: Translating problems into numbers.
- Case Study 1: Banner ad strategy.
- A Framework for Quantitative Research: Putting numbers in context.
- Case Study 2: Marketing channel metrics.
- Data Science Methodology: Step-by-step approach to gathering data and drawing conclusions.
This article explores how a theoretical framework supports analytical frameworks in breaking down complex problems. It covers qualitative and quantitative approaches with real-world case studies.
Types of Analytical Frameworks
There are three main types of data analytics frameworks, each with its own strengths depending on what it is they help us organize.
1. Qualitative research frameworks
When dealing with categorical questions such as, “Are our clients satisfied with our product?” we need a way to translate that question into numbers to create data-based insights. A qualitative research framework does this by transforming “soft” problems into “hard” numbers.
The qualitative research framework also helps us translate abstract concepts into quantifiable data. It is used for questions like “Would investing five more hours per week in research add more value to our product?”. In this case, we aim to quantify the concept of value to compare different strategies. A qualitative framework eases this process.
2. Quantitative research frameworks
Let’s say that we are already dealing with well-defined numeric quantities. For example, the “daily active users” our application sees is a metric we have extensively defined and measured. This information helps us know how well the app is currently doing - but doesn’t say much about where to find improvements.
To improve, we need to understand which factors are driving our key metrics; we need to give our metrics context. Quantitative research analytics frameworks help us understand the relationships between different metrics to put our core metrics in context.
3. Data science methodology
Let’s say we have defined our concepts and put all our metrics in context, then we’re just getting started. We still need to gather data to conclude.
Numerous ways exist to do this, some prone to error or inconsistency. So, we need an organized process to reduce risks and maintain organization. Data science methodology frameworks offer a reliable step-by-step approach to concluding data.
Now, let’s examine how each of these analytical frameworks works.
A Framework for Qualitative Research
Depending on the context of the business environment, we could use a few qualitative research analytical frameworks. Specific situations and problems call for different approaches, and we want to ensure that we are translating the business challenge into numerical measurements in the right way.
Two examples of these approaches include product metric frameworks for measuring success and diagnosing changes in metrics, as well as evaluating the impact of potential feature changes to our product. Another common business case for translating a problem into hard numbers is through A/B tests, which have a framework of their own.
However, these specific frameworks follow the same four-step structure outlined below. They begin with a vaguely defined business problem and need to convert it into hard numbers to address it.
The framework to go about finding these solutions has four steps:
- First, ask clarifying questions. Gather all the context you need to narrow down the scope of the problem and determine what requires further clarification.
- Second, assess the requirements. Define the problem in terms of precise metrics that can be used to address gaps from the previous step.
- Third, provide a solution. Each solution will vary depending on the type of problem you’re dealing with.
- Fourth, validate the solution. Do this against your pre-existing knowledge and available data to minimize the likelihood of making mistakes.
Case Study 1: Banner Ad Strategy
Let’s review each of those framework steps with a business example of an online media company that wants to monetize web traffic by embedding banner ads in its content. Our task is to measure the success of different banner ad strategies and select the best one to scale up.
1. Clarifying Questions & Assumptions
Initially, we need to gather context about our monetization method. Will revenue depend on ad impressions, clicks, or the number of users who buy the advertised products?
We also need to identify our audience type. Does it consist of stable (loyal) readers with regular engagement? Or is it primarily composed of click-bait article chasers with low rates of future engagement?
This information is necessary to define each strategy’s success and determine which strategies to test in the future. For example, if we have a click-bait audience, we can observe the revenue for each monetization strategy in the short term and then compare the results.
However, if we have a regular audience, we must understand each strategy’s customer lifetime value. Strategies like filling the page with ad banners could make us more money in the short term but contribute to the loss of loyal readers, hurting profits in the long term.
2. Assessing Requirements
Once we have gathered context and clarified assumptions, we must precisely define the solution requirements. Let’s say our review reveals that our revenue depends on how many clicks the ads get and that our webpage has a stable user base who reads it regularly.
We need to define the metric to optimize our banner ad strategy. We stated that the average customer lifetime value (CLV) was a good choice, which is the total revenue the company expects to make for each of its readers. In this case, the average CLV would be the average number of clicks per session and the average number of times each user views our pages for each banner strategy.

The resulting metric helps us choose between a strategy that generates more clicks in the short term versus a strategy that reduces reader churn. We also need to define the set of strategies we’ll evaluate. For simplicity, let’s say we will only test the number of banners we show each user.
3. Solution
At this point, we’ve defined our problem numerically and can create a data-driven solution.
In general, solutions can involve running experiments, deciding on product features, or explaining metric changes. In this case, we’ll design an A/B test to identify the best banner ad strategy, based on our assessment requirements.
In this case, we need to define an A/B test to decide our optimal strategy. Based on our requirements, the A/B test should be user-based instead of session-based: We’ll divide users into two groups, showing each group a different number of ads during their visits. For example, Bucket A receives one banner ad per webpage, while Bucket B gets two. Over time, we can capture how the number of ads shown impacts engagement.
We must ensure identical banner content for both groups to reduce causal effects. If Bucket B sees the same two banners, half of Bucket A should see one banner and the other half the other banner. We should also alternate the order of banners for Bucket B to avoid interference from the display order.
Lastly, decide on the experiment duration. To account for long-term effects, we should run the experiment for at least three months.
4. Validation
A useful first step is re-checking the numbers and performing a gut instinct check. If results seem odd, we should suspect a problem, investigate the cause, and revise our approach.
In this example, we tested a banner strategy hypothesis. The validation step involves evaluating differences between the test and control groups (users who didn’t receive the treatment over three months) and identifying any confounding factors that might have affected the results. We must also determine if the differences and observations are statistically significant or potentially spurious results.
A Framework for Quantitative Research
The second type of analytical approach comes from the quantitative research framework. After we define our key metrics clearly, this framework helps give them context. With this framework, teams can enhance their understanding of the key metric, making it easier to control, track, assign responsibilities, and identify improvement opportunities.
To understand the factors that drive them, assign responsibilities to team members, and identify opportunities for improvement.
We do this by breaking down the key metrics into lower-level metrics. Here’s a step-by-step guide:
Identify the key metric: Determine the main metric you want to focus on (e.g., revenue for a sales team).
Define first-level metrics: Break down the key metric into components that directly relate to it. For a sales team, first-level metrics would be the sales volume and the average selling price because the revenue is the sales volume times the average selling price.
Identify second-level metrics: Further refine your analysis by breaking down the first-level metrics into their underlying factors. For a sales team, second-level metrics could include:
- Sales volume:
- Number of leads generated
- Conversion rate
- Average order value
- Average selling price:
- Discounts and promotions
- Competitor prices
- Sales volume:
Assign responsibility and track progress: Once you have a better understanding of first—and second-level metrics, allocate responsibility for improving them to different team members and track their progress to enhance the key metric.
Case Study 2: Marketing Channel Metrics
Let’s explore an example where we apply the quantitative analytics framework to a company called Mode, which sells B2B analytics dashboards through a SaaS freemium subscription model (users can use the product for free but must pay monthly or annually for advanced features).
Step 1: Identify the key metric
Our key metric is marketing ROI (revenue over expenses) for each of our marketing channels.
Step 2: Define first-level metrics
Two first-level metrics stand out:
- Revenue: Driven by our average Customer Lifetime Value (CLV) - the total revenue we make for each new customer over the years.
- Expenses: Driven by our Customer Acquisition Cost (CAC) - the cost of gaining new customers.
Step 3: Identify second-level metrics
Now, we need to identify the second-level metrics for each of our first-level metrics.
First-Level Metric: Customer Lifetime Value
CLV is calculated as the Average Revenue Per Customer (ARPC) - the average amount a customer spends each month - divided by the churn rate (CR) - the percentage of users that stop using the platform each month:

So, ARPC and CR are the second-level metrics driving CLV.
First-Level Metric: Customer Acquisition Cost
On the other side of our marketing ROI equation, CAC is the average amount the sales team spends in salaried time and equipment/software value to sign up one new customer.
There are quite a few second-level metrics we could investigate under CAC, mainly from looking at the customer acquisition funnel:
- Cost per View (CPV): The amount it costs the company for each new person to see our landing page.
- Free Sign-Ups per Total Number of Views (FSU/TNV): The percentage of landing page visitors who create a free account.
- Paid Customers per Total Number of Views (PC/TNV): The percentage of landing page visitors who create a premium account directly.
- Paid Customers per Free Sign-Ups (PC/FSU): The percentage of free account users who upgrade to a premium account.
With this information, we can define our CAC as:
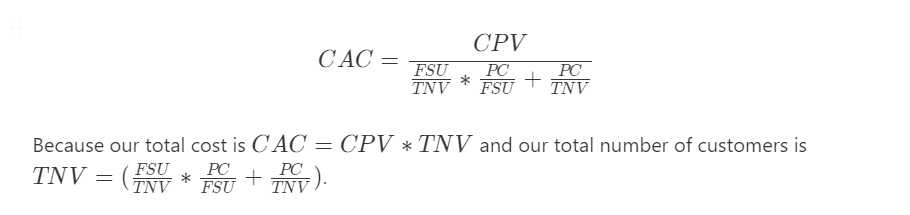
So, the four metrics we identified serve as our second-level metrics.
Step 4: Assign responsibility and track progress
With a clear understanding of first- and second-level metrics, the sales team can assign responsibilities for improving each metric and track their progress in enhancing the key metric of marketing ROI.
Data Science Methodology
Let’s say we’ve defined our concepts and metrics. We translated our business problem into hard numbers using a qualitative framework. Then, we used the quantitative framework to gain an analytical understanding of the metrics involved and their relationships. Now, we want to draw conclusions from the data.
We need a reliable process that minimizes errors and keeps things organized to do this. This is where our third analytical framework comes into use. The data science methodology provides a step-by-step approach for reaching conclusions from data, which is especially useful when questions become increasingly complex:
- Data Requirements - Figure out the necessary data, formats, and sources to collect.
- Data Collection - Gather and validate the data, ensuring it represents the problem.
- Data Processing - Clean and transform the data.
- Modeling - Build models to predict or describe outcomes.
- Evaluation - Check if the model meets business requirements and is high-quality.
- Deployment - Prepare the model for real-world use.
- Feedback - Refine the model based on its performance and impact.
Imagine you’re working at a company that wants to boost customer retention in its online store. They collect customer data through website analytics and a customer database. Here’s how they might follow the data science methodology:
Going through each of the steps would look something like this:
- Data Requirements: Identify data needed to improve customer retention, such as demographics, purchase history, website engagement, and feedback.
- Data Collection: Gather data from sources like databases, website analytics, and surveys. Ensure data is accurate, complete, and relevant.
- Data Processing: Clean and analyze the data to remove errors, duplicates, and missing values. Look for patterns and trends you could use for feature engineering.
- Modeling: Using machine learning algorithms and historical data, Create predictive models to find factors impacting customer retention.
- Evaluation: Compare the model’s predictions to actual customer behavior, checking for accuracy, interpretability, and scalability.
- Deployment: Implement the model in the online store’s retention strategies. This could include targeted marketing campaigns, personalized recommendations, or loyalty programs based on the model’s predictions. If you’re working independently, ensure you showcase your projects and results in the best possible way.
- Feedback: Monitor the model’s performance and gather customer feedback to refine it. Update the model’s algorithms or adjust retention strategies based on its predictions. Continuously assess and improve the model to maintain its effectiveness.