
Tesla Data Analyst Interview Guide (2025) – Process, Questions, and Salary Insights


Introduction
Tesla is a leading technology company known for its innovations in Autopilot, electric vehicles, and sustainable energy solutions. The company values innovation and speed over perfection, fostering a mission-driven culture that encourages rapid development and calculated risk-taking. Guided by Elon Musk’s “first principles” approach—breaking complex problems down to their fundamentals and rebuilding from the ground up—Tesla empowers employees to think independently and move fast. They look for dedicated, high-performing individuals who can adapt quickly and push the boundaries of what’s possible.
Role Overview & Culture
As a Data Analyst at Tesla, you’ll play a key role in driving data-informed decisions across operations, production, and technology. You’ll partner with engineering and product teams, work with large-scale manufacturing and service data, automate production control systems, turn performance metrics into actionable dashboards, identify trends and areas for improvement, and apply statistical methods to maintain and optimize data pipelines.
Why This Role at Tesla?
Working as a data analyst at Tesla means contributing directly to cutting-edge innovation, especially in the fast-growing and niche field of sustainable energy. Your work has the potential to drive meaningful breakthroughs—not just in technology, but in shaping the future of human progress. At Tesla, employees are given a high degree of ownership and autonomy. With Elon Musk’s ambitious vision at the core, the company actively encourages creative problem-solving and bold risk-taking.
At Tesla, strong performance is met with equally strong compensation. Tesla offers competitive base salaries (~$82K–90K), and mid-to-high total compensation (typically $100K+, with top performers reaching $200K+).
To land the job, you must ace the Tesla data analyst interview using the tips down below.
What Is the Interview Process Like for a Data Analyst Role at Tesla?
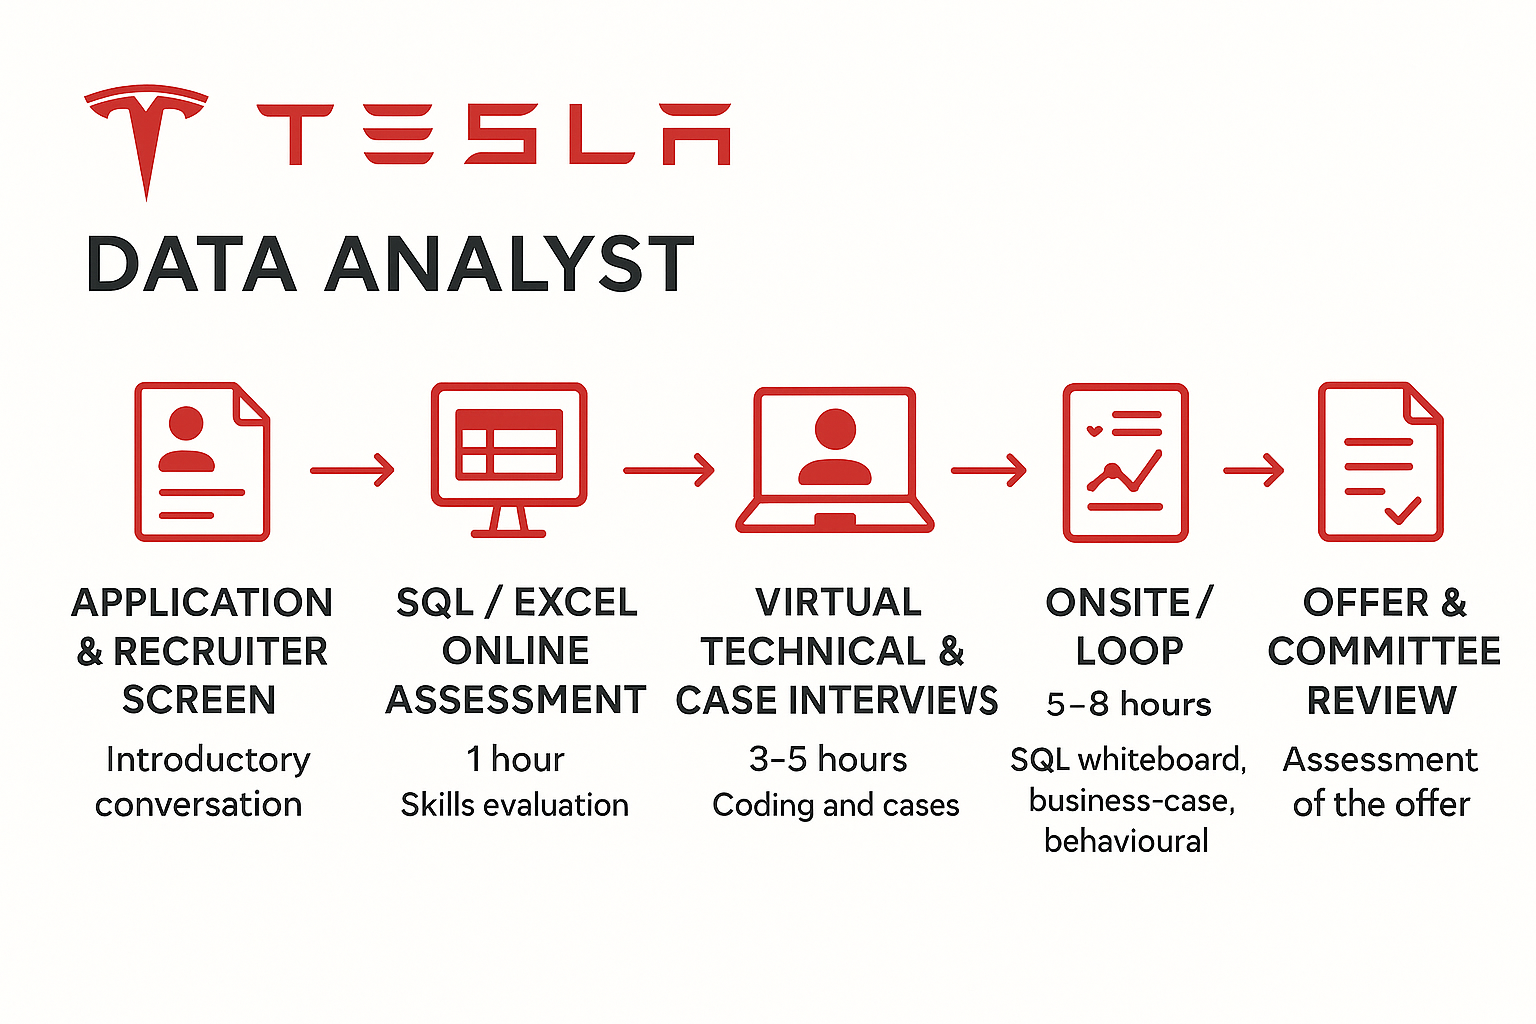
Application & Recruiter Screen
In the first stage of the Tesla data analyst interview, the recruiter will focus on your resume and past experiences that align with the team’s needs. This is an opportunity to introduce yourself and highlight your educational background, technical skills, and relevant work experience.
SQL / Excel Online Assessment
After the recruiter screening, you’ll typically receive a take-home assessment based on a business scenario. You’ll be given a case and a dataset, and asked to clean the data, analyze it, and deliver actionable insights. This stage evaluates your ability to identify business trends and problems, apply analytical techniques, and communicate your findings effectively through data.
Virtual Technical & Case Interviews
After passing the take-home assessment, you’ll be invited to the technical round. This stage tests your overall technical skills through live coding. Topics may include data structures, SQL, Python, statistical modeling, and data visualization using tools like Tableau. You’ll typically be given a business case and asked to demonstrate how you would approach and solve it in real time.
Onsite / Loop
Tesla data analyst onsite interview typically consists of multiple 45–60 minute sessions with analysts or managers. Each session blends SQL whiteboarding, case analysis, data modeling, and behavioral questions. This stage is designed to simulate real working scenarios and assess how you approach cross-functional problems and communicate with the team.
Offer & Committee Review
After each round of interviews, your interviewers will provide feedback to a cross-functional hiring committee. The committee will then make the final decision. This process typically takes about a week after your final round. The recruiter will follow up with the result—and if all goes well, congratulations, you’ll receive your offer letter!
Behind the Scenes
Tesla only hires high-performing candidates and is constantly competing for top talent. Interviewers are required to submit their feedback within 24 hours, ensuring timely and accurate reflections on the candidate’s performance.
In some interview rounds, senior managers are involved to assess whether the candidate exceeds Tesla’s high standards, both technically and culturally. This is known as the bar-raiser vote, where the goal is to maintain or elevate the team’s performance bar. Candidates who don’t meet this threshold may be voted out, regardless of other interviewers’ feedback.
Differences by Level
Tesla also tailors its hiring process based on the candidate’s level of seniority. For senior analysts, the interview process typically includes an additional round focused on assessing their ability to generate strategic insights and support high-level decision-making.
Challenge
Check your skills...
How prepared are you for working as a Data Analyst at Tesla?
Question Categories
Here are a few recurring questions for your upcoming Tesla Data Analyst Interview:
Coding / Technical (SQL & Excel) Questions
Tesla SQL interview questions often focus on writing queries using window functions on production-like datasets. Candidates are expected to demonstrate not just technical accuracy, but also clear, logical thinking and attention to edge cases.
Excel tasks typically involve pivot tables, requiring you to organize and summarize complex data efficiently.
1. Use the RANK window function to display the top 3 users in each city based on post count
Use RANK() in a PARTITION BY city with ORDER BY post_count DESC to identify the top users per location. Filter the output where rank ≤ 3 to get only the most active individuals. Be careful with ties and understand when to use DENSE_RANK() instead. Tesla analysts can use this for regional performance tracking in charging stations or retail service activity.
2. Write a query to find the top 5 ranked actions for Apple users in each session
Apply ROW_NUMBER() or RANK() to rank user actions by frequency within each session. Filter for Apple user events and top 5 actions per session. Ensure partitions are session-specific and ordering captures relevance or frequency. Tesla can use similar logic to rank frequent car control actions in user interface logs.
3. Write a query to find and rank the top user actions overall
Aggregate user action events and rank them by count using a window function. Use RANK() over the total count to list actions by popularity. You may apply filters to focus on meaningful user interaction types. This helps in surfacing the most common user behaviors, useful in UI/UX decisions for Tesla’s infotainment or mobile app.
4. Write a query to pivot a table of monthly sales data
Use conditional aggregation to convert rows into columns by month. Structure your query with SUM(CASE WHEN month = 'January' THEN sales ELSE 0 END) logic. Group by product or region to reflect a pivot format. Tesla analysts can use this to compare unit sales across months for various car models or battery packs.
5. Pivot the exam_scores table to track each student’s score by subject
Apply MAX(CASE WHEN subject = 'Math' THEN score END) pattern for each subject across a grouped student table. Ensure every student appears once with multiple subject columns. Handle nulls where a student didn’t take a subject. Though academic in framing, this structure mirrors how Tesla might track technician certifications or diagnostic coverage.
6. Write a query to create a pivot table showing total sales by branch and month
Structure the pivot using grouped totals with a SUM() for each month as a separate column. Use CASE inside aggregates to separate monthly buckets. Final results should show one row per branch. This technique supports production and sales reporting across Tesla’s multiple service centers or Gigafactories.
7. Get the percentage of search queries where all results shown were from the same company
Group search events by query and count how many unique companies are represented. Use a HAVING COUNT(DISTINCT company) = 1 clause and divide by total queries for the percentage. A CTE and COUNT(*) OVER() might be needed to maintain numerator and denominator in the same scope. Tesla could apply this concept in optimizing product listings or search tools on their site.
Business‐Case Questions
In business-case questions, you may be asked to analyze sales funnel drop-offs to identify where and why potential customers are falling off. You could also be asked to estimate cost savings from improvements in battery yield or manufacturing efficiency, using assumptions and provided data.
These questions are designed to assess your ability to break down ambiguous problems, apply structured thinking, and deliver clear, actionable insights.
8. Estimate the annual storage cost for Google Earth
Break the problem into storage per map tile, update frequency, and total surface coverage. Estimate the size of raw satellite imagery and factor in compression or cloud cost tiers. Multiply by geographic scale and update cycles to model annual storage needs. Though Google-related, this estimation mirrors Tesla’s fleet data and vision archive needs.
9. Calculate the overall advertising cost per transaction
Determine total advertising spend and divide it by the number of successful customer transactions. Include fixed and variable costs such as per-click fees and campaign management. Discuss customer acquisition cost and lifetime value tradeoffs. This is key for Tesla’s digital-only sales model with minimal showroom presence.
10. Evaluate the impact of reducing fees on growth and unit economics
Model price elasticity by comparing projected increases in volume against declining margin per unit. Calculate breakeven points and explore scenarios of diminishing returns. Include operational cost coverage and fixed cost amortization. This case is directly relevant to Tesla’s ride-hailing ambitions and potential RoboTaxi deployment.
11. Identify key metrics for assessing supply chain optimization
Highlight metrics like inventory turnover, supplier lead time, order fulfillment rate, and total landed cost. Discuss how these KPIs interact and can be visualized across global factories. Propose a dashboard or prioritization strategy for continuous improvement. As Tesla vertically integrates, this question mirrors its real-world logistical complexity.
12. Estimate cost savings from improving battery yield by 5%
Begin by defining current battery scrap rates and unit economics per kWh. Estimate how a 5% improvement translates to reduced waste and increased usable output. Layer in fixed vs. variable production costs to understand margin effects. Tesla’s battery line is one of the company’s largest cost centers—small gains here have huge impact.
13. Analyze drop-offs in the Model 3 sales funnel from site visit to delivery
Break the funnel into measurable stages: traffic, configurations, reservations, financing, delivery. Use historical or benchmark conversion rates to compute falloff at each step. Identify bottlenecks and hypothesize reasons—e.g., complexity, price, wait times. Funnel analysis is core to Tesla’s DTC growth and optimizing conversion efficiency.
Behavioral / “Culture Fit” Questions
Try to prepare a few stories that show strong ownership and urgency, and organize them using the STAR method. Keep them flexible so you can easily adapt them to different types of behavioral questions during the interview.
14. Describe a challenging communication experience with stakeholders
Think of a situation where you had to explain something technical, complex, or disappointing to business or cross-functional partners. Show how you tailored your message to different audiences and maintained clarity. Discuss how you handled questions, concerns, or resistance. Tesla analysts regularly communicate across engineering, design, and leadership.
15. Tell me about a time you had to adapt quickly to a major change in project scope or timeline
Choose an example where priorities shifted rapidly—maybe due to data changes, executive feedback, or external events. Explain how you adjusted your plan, coordinated with others, and still delivered value. Highlight resilience and flexibility. Tesla operates in a fast-moving environment where change is constant.
16. Describe a time you had to give or receive constructive feedback
Use the STAR method to describe when you offered or received meaningful feedback. Emphasize how you ensured the conversation was respectful and focused on improvement. Reflect on what you learned or how you applied the feedback. Tesla’s culture depends on rapid learning through honest dialogue.
17. Tell me about a time you took initiative outside of your formal responsibilities
Pick a moment when you noticed an opportunity or problem and acted without being asked. Explain your motivation, what actions you took, and the outcome. Highlight creativity, ownership, and measurable impact. Tesla values people who go beyond the job description and solve real problems.
How to Prepare for a Data Analyst Role at Tesla
Landing a data analyst position at Tesla requires more than just technical ability. Tesla looks for candidates who are not only skilled in data but also deeply aligned with its fast-paced, mission-driven culture. To stand out, you’ll need to combine strong SQL and data visualization skills with a solid understanding of Tesla’s business metrics and values. Below are the key areas you should focus on while preparing for the interview.
Master SQL & Data Visualization
As a data analyst at Tesla, you will work with large-scale datasets to support high-impact decisions. It is important to practice advanced SQL queries, especially joins, CTEs, and window functions. You should also become proficient in building dashboards that transform complex problems into clear and actionable insights using tools such as Tableau or Power BI.
Study Tesla Metrics
Some of you may already have strong technical skills but might be less familiar with the specific terminology used in this niche industry. We recommend reviewing Tesla’s annual reports and earnings calls to understand core KPIs such as production volume, delivery rates, gross margins, and energy storage performance. This background will help you better understand the business context and interpret these metrics effectively during your interviews.
Mock Business-Case Interviews
Prepare to structure your answers around key business concepts such as total addressable market (TAM), cost savings, ROI, and operational impact. Practice combining these metrics with Tesla’s different product lines to get comfortable applying them across various team settings. Also remember to use frameworks and mock cases to sharpen your thinking. You can use Interview Query to practice mock interview with other peers and gaining real-time feedback.
Rehearse Mission Stories
Connect your past projects to Tesla’s mission of accelerating the world’s transition to sustainable energy. Highlight moments where you took the initiative, collaborated across functions, or solved problems under pressure. Beyond strong technical skills, this kind of alignment and ownership is what will truly help you stand out from other candidates.
FAQs
What Is the Average Salary for a Data Analyst Role at Tesla?
Average Base Salary
Is There a Separate Interview for Business Analysts?
Tesla’s interview process for business analysts shares many similarities with that of data analysts, especially in technical and case-based rounds. However, there may be additional focus on stakeholder communication, business process understanding, and cross-functional project experience.
Conclusion
Preparing for a role at Tesla can feel overwhelming, especially with its fast-paced, high-expectation culture. But with diligent preparation, clear thinking, and a strong connection to Tesla’s mission, you can stand out.
For more guidance, check out our full Tesla interview questions & process overview, and explore role-specific tips for the Tesla Business Analyst and Tesla Data Engineer interviews.
Tesla Interview Questions
| Question | Topic | Difficulty |
|---|---|---|
Behavioral | Medium | |
Tell me about a data project that didn’t go the way you expected. What did you set out to do, what surprised you, and how did you handle it? | ||
SQL | Hard | |
SQL | Easy | |
SQL | Easy | |
Machine Learning | Medium | |
Statistics | Medium | |
SQL | Hard | |
Machine Learning | Medium | |
Python | Easy | |
Deep Learning | Hard | |
SQL | Medium | |
Statistics | Easy | |
Machine Learning | Hard |
Discussion & Interview Experiences