
Rivian Data Analyst Interview Guide: Process, Questions & Salary


Introduction
A Rivian data analyst works at the intersection of software, hardware, and real-world operations, where data directly influences vehicle reliability, manufacturing efficiency, and customer experience. As Rivian scales production and delivers connected electric vehicles, analysts operate in an environment shaped by telemetry data, supply chain signals, quality metrics, and fast-moving operational decisions. This is not a reporting-only role. Data analysts at Rivian help teams understand what is happening inside vehicles, factories, and systems, then translate those insights into actions that improve performance and outcomes.
This context shapes the Rivian data analyst interview. Interviewers look for candidates who can work with messy, high-volume data, reason through ambiguity, and explain insights clearly to engineers, operators, and leaders. In this guide, we break down how the Rivian data analyst interview process works, what each stage is designed to assess, and how candidates should prepare for a role where analytics is tightly coupled with product, operations, and mission-driven impact.
Rivian Data Analyst Interview Process
The Rivian data analyst interview process is designed to evaluate technical depth, analytical judgment, and the ability to operate in a fast-growing, engineering-led organization. Rather than testing tools in isolation, Rivian focuses on how candidates apply SQL, Python, and visualization skills to real problems tied to vehicles, manufacturing, supply chain, and internal operations. Most candidates go through multiple stages that combine technical assessments with behavioral and product-focused conversations.
Many candidates prepare by practicing applied analytics problems from Interview Query’s data analyst interview questions and pressure-testing their explanations through mock interviews, which mirror Rivian’s emphasis on live reasoning and communication.
Interview Process Overview
Candidates typically move from an initial recruiter screen into one or more technical evaluations, followed by a virtual onsite that blends live coding, case-style analysis, and behavioral interviews. Compared with traditional corporate analytics roles, Rivian places heavier emphasis on ownership, adaptability, and the ability to explain complex data to non-technical partners.
Some candidates rehearse this progression using real-world challenges that require them to analyze imperfect datasets, define metrics, and defend trade-offs under questioning.
| Interview stage | What happens |
|---|---|
| Recruiter screen | Background, motivation, and alignment with Rivian’s mission |
| Technical screening | SQL, Python fundamentals, and analytical reasoning |
| Technical or case interview | Live coding, SQL scenarios, or data visualization exercises |
| Behavioral or managerial round | Collaboration, ownership, and problem-solving under ambiguity |
| Product or company fit | Interest in EVs, Rivian products, and data impact |
Recruiter Screen
The recruiter screen is usually a short conversation focused on role fit, interest in Rivian, and motivation for working in an EV and manufacturing-driven environment. Interviewers assess whether you understand how analytics at Rivian differs from purely business or marketing analytics roles.
Tip: Be prepared to explain why working with operational or product data, such as vehicle quality or supply chain metrics, excites you more than static reporting.
Technical Screening
The technical screening often covers SQL and Python fundamentals, sometimes in a live or timed format. Questions may resemble LeetCode-style logic or applied analytics scenarios, such as aggregations, window functions, or basic data transformations.
Interviewers evaluate clarity of thought, correctness, and how you explain your approach, not just whether you reach the final answer.
Tip: Talk through your reasoning as you code, especially how you validate results and handle edge cases.
Technical Or Case Interview
In later technical rounds, candidates may be asked to solve more realistic problems using SQL, Python, or visualization tools like Tableau. These interviews often resemble internal Rivian use cases, such as tracking trends, computing moving averages, or designing dashboards that support operational decisions.
Working through case-style challenges helps candidates practice structuring analysis and defending assumptions in real time.
Tip: Start by clarifying the business question and what decision the analysis is meant to support before writing any code.
Behavioral Or Managerial Round
Behavioral interviews assess how you collaborate with engineers, operations teams, and leadership, especially when data challenges assumptions or priorities. Rivian values analysts who can push back constructively, take ownership, and adapt as responsibilities evolve.
Candidates often rehearse these conversations through mock interviews to refine structure and impact.
Tip: Anchor answers around a specific decision you influenced and what changed as a result.
Product Or Company Fit
Some interviews focus on Rivian’s products, mission, and approach to data democratization. Interviewers want to understand whether you are genuinely interested in EVs and how data can improve vehicle quality, reliability, or operational efficiency.
Tip: Be ready to discuss a specific Rivian product or system and how you would use data to improve it.
Challenge
Check your skills...
How prepared are you for working as a Data Analyst at Rivian?
Rivian Data Analyst Interview Questions
Rivian data analyst interview questions focus on how you turn complex, operational data into decisions that improve vehicles, manufacturing efficiency, and reliability. Interviewers care less about perfect syntax and more about whether your logic is sound, your assumptions are explicit, and your conclusions are usable by engineers and operators.
Technical And SQL Questions
These questions assess SQL fundamentals, time-series reasoning, and your ability to validate metrics drawn from telemetry, manufacturing, or supply chain data.
Calculate a rolling 7-day average of vehicle error events by model.
This tests window functions, partitioning, and time-based aggregation, which are common when analyzing vehicle performance trends or quality metrics over time.
Tip: Be explicit about how you handle missing days and model-level partitions.
Identify suppliers whose defect rate increased month over month.
This evaluates grouping logic, month-over-month comparisons, and how you define “increase” in noisy operational data.
Tip: Clarify whether you compare absolute counts or normalized defect rates before writing the query.
Detect overlapping maintenance windows for the same vehicle.
Interviewers use this to test interval logic and data integrity checks that matter in scheduling, warranty analysis, or service operations.
Tip: Explain how you define overlap and how you prevent double counting.
Return the top three failure codes contributing to warranty costs.
This tests aggregation, ranking, and your ability to connect technical output to cost and reliability impact.
Tip: Mention how you would sanity-check results against known warranty drivers.
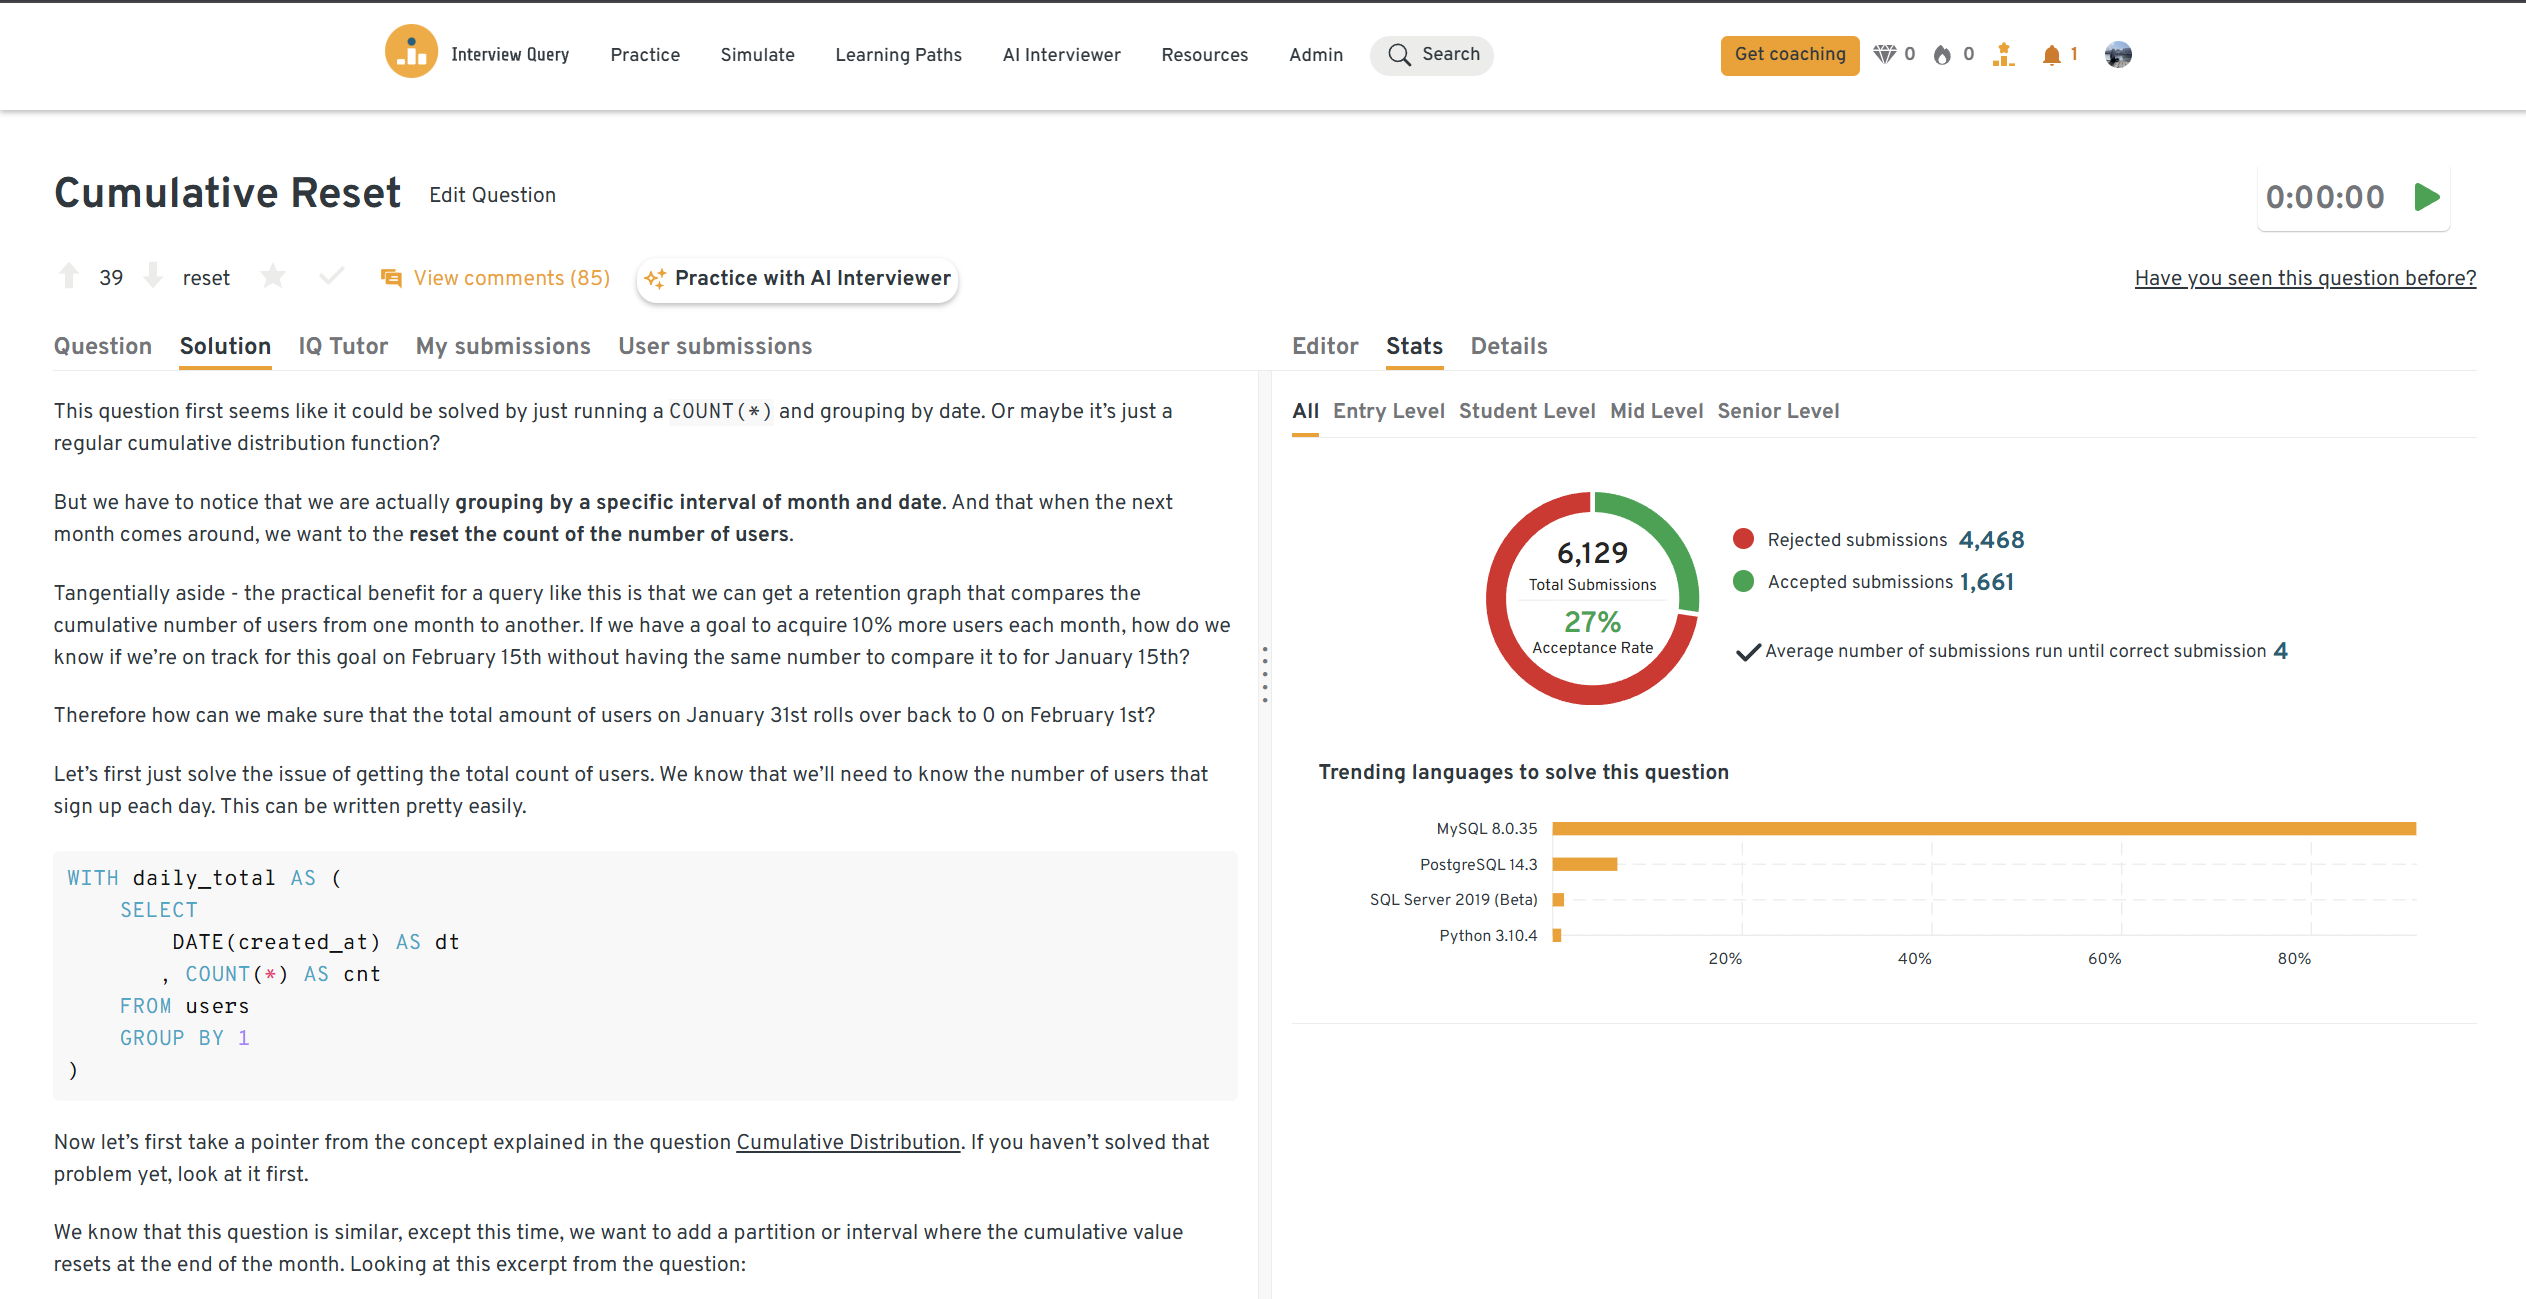
Compute cumulative vehicles produced per plant, resetting each quarter.
This assesses windowing logic and your understanding of period-based reporting used in manufacturing dashboards.
Tip: State how you define quarter boundaries and validate resets.
You can practice this exact problem on the Interview Query dashboard, shown below. The platform lets you write and test SQL queries, view accepted solutions, and compare your performance with thousands of other learners. Features like AI coaching, submission stats, and language breakdowns help you identify areas to improve and prepare more effectively for data interviews at scale.
Python And Data Analysis Questions
Rivian also evaluates Python fundamentals, especially for data cleaning, exploratory analysis, and collaboration with data science teams.
How would you flag anomalous sensor readings from vehicle telemetry?
This tests your ability to reason about distributions, thresholds, and false positives in real-world sensor data.
Tip: Start with a simple statistical baseline before proposing more complex models.
Explain how you would validate a Python-based ETL pipeline feeding dashboards.
Interviewers assess data quality mindset, logging, and reproducibility rather than advanced libraries.
Tip: Walk through checks at ingestion, transformation, and output stages.
Business Case And Data Insight Questions
These questions mirror Rivian’s day-to-day analytics work, where analysts partner with engineering and operations to guide decisions.
How would you measure whether a software update improved vehicle reliability?
This evaluates experimental design, metric definition, and your ability to separate signal from noise.
Tip: Explain how you would define success metrics and control for confounding factors like vehicle age.
Design a dashboard to track manufacturing bottlenecks in real time.
Interviewers look for prioritization, clarity, and alignment with operator decision-making.
Tip: Focus on a small number of actionable KPIs rather than comprehensive coverage.
How would you investigate a sudden spike in warranty claims for a specific model?
This tests structured problem-solving, hypothesis generation, and cross-functional thinking.
Tip: Start with segmentation before jumping to root causes.
Behavioral And Culture-Fit Questions
These questions assess ownership, communication, and judgment in Rivian’s fast-moving, mission-driven environment.
Why do you want to work as a data analyst at Rivian?
Interviewers evaluate genuine interest in EVs and how you see data supporting product and operational impact.
Tip: Tie your motivation to a specific Rivian product or system.
Sample answer: I am excited about applying analytics to physical products where insights directly affect reliability and customer experience. Rivian’s focus on connected vehicles and manufacturing scale means data decisions translate into real-world impact. I am motivated by roles where analytics improves systems people depend on every day.
Describe a time you challenged an engineering or operations team using data.
This tests how you handle disagreement while maintaining trust and momentum.
Tip: Emphasize alignment on decisions rather than winning an argument.
Sample answer: In a prior role, an operations team believed a defect spike was supplier-driven. I segmented the data by process step and showed the issue correlated with a recent internal change. By walking through the analysis and focusing on next steps, we agreed to adjust the process first, which reduced defects without straining supplier relationships.
How do you prioritize competing analytics requests in a fast-growing environment?
Interviewers look for structure and proactive communication.
Tip: Anchor prioritization around impact and risk.
Sample answer: I prioritize based on decision impact and urgency, then communicate trade-offs early. In a previous role, this approach helped me defer a low-impact report to focus on an issue affecting daily operations, keeping teams aligned and outcomes strong.
How would you explain a complex analysis to a non-technical leader?
This evaluates data storytelling and clarity.
Tip: Focus on outcomes and decisions, not methods.
Sample answer: I start with the decision the leader needs to make, then show one or two visuals that highlight the key trade-off. I explain what changes if we act versus if we don’t, and only dive into technical detail if questions come up.
How do you handle ambiguity when data is incomplete or noisy?
Rivian values adaptability and judgment under uncertainty.
Tip: Show comfort making directional recommendations.
Sample answer: When data is incomplete, I make assumptions explicit and test sensitivity. I communicate confidence levels clearly and recommend the best next action while outlining what additional data would reduce uncertainty.
In this video, Jay Feng, co-founder of Interview Query and former data scientist at companies like Nextdoor and Monster, walks through the eight different types of questions you’ll encounter in real data analyst interviews. You’ll get a sense of how each type tests your problem-solving, communication, and technical reasoning skills—exactly the kind of skills Rivian looks for. Watch it before diving deeper into your prep to understand how interviewers think and what strong answers sound like.
How To Prepare For A Rivian Data Analyst Interview
Preparing for a Rivian data analyst interview requires more than brushing up on SQL syntax or Python libraries. Rivian evaluates how you apply analytics to physical systems, explain trade-offs clearly, and operate in a fast-growing, engineering-led environment where data informs real-world outcomes.
Build Structured Thinking Around Operational Problems
Rivian interviews often start with a vague problem tied to vehicles, manufacturing, or supply chain performance rather than a clean analytical prompt. Strong candidates clarify objectives, define success metrics, and outline assumptions before analyzing data.
Tip: Practice framing problems aloud using applied scenarios from Interview Query’s data analyst interview questions. Force yourself to articulate the business or operational decision the analysis should support before writing any code.
Strengthen SQL And Python With Validation In Mind
SQL and Python are core skills for Rivian data analysts, but interviewers care more about correctness, validation, and interpretation than clever solutions. Expect follow-ups about edge cases, missing data, and whether results make sense in a real system.
Tip: When practicing SQL or Python, always ask how you would sanity-check outputs and explain anomalies to an engineer or operations leader who needs to act on the insight.
Practice Live Coding And Explanation Simultaneously
Several Rivian interviews involve live coding or whiteboard-style problem-solving. Interviewers evaluate how you reason through problems in real time and how clearly you explain your approach, not just whether you finish.
Tip: Simulate this pressure by solving problems from case-style challenges while narrating your thought process. Focus on clarity and structure rather than speed.
Prepare Behavioral Stories That Show Ownership And Judgment
Behavioral interviews at Rivian emphasize ownership, adaptability, and collaboration across technical and non-technical teams. Strong answers explain why you made certain trade-offs and what changed because of your decision.
Tip: Prepare STAR-style stories where data influenced engineering, operations, or product outcomes. Refine delivery through live mock interviews, which mirror Rivian’s follow-up-heavy style.
Understand Rivian’s Product And Data Context
Rivian data analysts work close to vehicles, factories, and connected systems. Interviewers expect you to understand Rivian’s products and how data supports reliability, quality, and scale.
Tip: Be ready to discuss a specific Rivian product or system and outline how you would use data to improve performance, detect issues early, or support decision-making.
Role Overview: Rivian Data Analyst
A Rivian data analyst works at the intersection of software, hardware, and operations, using data to improve vehicle reliability, manufacturing efficiency, and business performance. The role goes beyond reporting. Analysts are expected to translate ambiguous operational questions into clear analytical approaches and communicate insights that engineers and leaders can act on.
Day to day, Rivian data analysts extract and clean large datasets from sources such as vehicle telemetry, manufacturing systems, and internal platforms. They build dashboards, automate reporting, and partner with engineering, operations, and leadership teams to diagnose issues and guide decisions. Success depends on both technical depth and the ability to explain complex data in simple, decision-ready terms.
Core responsibilities
- Data analysis and reporting: Build dashboards and reports using SQL, Python, Tableau, or Power BI to track KPIs across quality, manufacturing, and supply chain.
- Data engineering and ETL: Extract, transform, and load data from multiple systems while ensuring consistency and data quality.
- Predictive and exploratory analysis: Support early-stage modeling efforts, such as warranty or reliability analysis, in collaboration with data scientists.
- Automation and scalability: Improve efficiency by automating data pipelines, reports, and monitoring workflows.
- Cross-functional collaboration: Partner with engineers, operators, and leaders to understand needs, troubleshoot issues, and present insights clearly.
- Technical leadership: Establish best practices, mentor junior analysts, and contribute to architectural decisions for analytics solutions.
Candidates preparing for this role benefit from practicing applied analytics problems in the data analyst interview questions bank, which emphasizes interpretation, validation, and real-world context.
Culture And What Makes Rivian Different
Rivian’s data culture reflects its hands-on, mission-driven approach to building electric vehicles. Analysts are embedded in teams close to the product and operations, which means analytics work often connects directly to physical outcomes. The environment is fast-moving and sometimes ambiguous, rewarding adaptability and ownership.
What Rivian interviewers look for
- Ownership mindset: Analysts who take responsibility for insights and follow through to impact.
- Operational intuition: Comfort reasoning about real-world systems, not just abstract metrics.
- Clear communication: Ability to explain technical analysis to non-technical partners.
- Adaptability: Willingness to evolve as systems, tools, and priorities change.
- Mission alignment: Genuine interest in EVs, sustainability, and Rivian’s products.
Because Rivian values data democratization, analysts are expected to make insights accessible rather than gatekeep complexity. Practicing explanations and stakeholder scenarios through mock interviews helps candidates demonstrate this balance clearly.
FAQs
Is the Rivian data analyst interview hard?
Yes, the Rivian data analyst interview is considered challenging, especially compared with traditional corporate analytics roles. The difficulty comes less from trick questions and more from live problem-solving, ambiguity, and explanation quality. Interviewers expect you to reason through SQL or Python problems aloud, justify assumptions, and connect analysis to real operational decisions. Candidates who practice applied scenarios and live explanation tend to perform best.
What technical skills does Rivian prioritize for data analysts?
Rivian prioritizes strong SQL, practical Python, and data visualization skills over advanced machine learning. Analysts are expected to work with time-series data, operational metrics, and large datasets, often in collaboration with engineers. Experience validating data, handling edge cases, and explaining results clearly matters more than knowing niche libraries. Practicing problems from Interview Query’s data analyst interview questions bank closely reflects this emphasis.
Are Rivian data analyst interviews focused on EV or automotive knowledge?
You do not need deep automotive engineering knowledge, but genuine interest in EVs and Rivian’s products is important. Interviewers often ask how you would analyze vehicle reliability, manufacturing throughput, or operational performance. Strong candidates show curiosity about how data improves physical systems and customer outcomes, even if they are learning the domain.
Does Rivian require Python for data analyst roles?
Python is commonly used and can be a differentiator, especially for automation, exploratory analysis, or collaboration with data science teams. However, Rivian places heavier weight on SQL, analytical reasoning, and communication. Candidates who can explain logic clearly and validate outputs often outperform those who rely purely on complex code.
What differentiates strong Rivian data analyst candidates?
Strong candidates consistently anchor analysis to decisions and impact. They clarify the problem before analyzing data, make assumptions explicit, and explain insights in plain language. They also demonstrate ownership, adaptability, and comfort working with incomplete or noisy data, which reflects Rivian’s fast-growing, engineering-led environment.
Turning Analytics Into Real-World Impact at Rivian
The Rivian data analyst interview is designed to assess whether you can move beyond dashboards and help teams make better decisions using data. Strong candidates show they can structure ambiguous problems, apply SQL and Python to real operational questions, and communicate insights clearly to engineers and leaders.
To prepare effectively, focus on realistic analytics scenarios rather than isolated drills. Start by practicing applied problems from the data analyst interview questions bank to build technical confidence. Then, pressure-test your explanations and judgment through live mock interviews, where follow-up questions mirror Rivian’s interview style. Together, these steps help you walk into the Rivian interview confident, structured, and ready to turn data into impact.
Rivian Interview Questions
| Question | Topic | Difficulty |
|---|---|---|
Behavioral | Medium | |
Tell me about a data project that didn’t go the way you expected. What did you set out to do, what surprised you, and how did you handle it? | ||
Behavioral | Medium | |
Behavioral | Easy | |
SQL | Easy | |
Machine Learning | Medium | |
Statistics | Medium | |
SQL | Hard | |
Machine Learning | Medium | |
Python | Easy | |
Deep Learning | Hard | |
SQL | Medium | |
Statistics | Easy | |
Machine Learning | Hard |
Discussion & Interview Experiences