
Goldman Sachs Business Intelligence Interview Questions, Process & Salary


Introduction
Goldman Sachs processes enormous volumes of financial, operational, and risk data every day. The firm supports more than 40 million daily trades during peak market activity, manages trillions of dollars in client assets, and operates one of the most sophisticated risk and control infrastructures in global finance. As the company accelerates its digital transformation, Business Intelligence analysts have become essential. They build the dashboards, analytical models, and validation systems that help teams make faster decisions, improve process stability, and identify emerging risks before they escalate.
If you are preparing for the Goldman Sachs business intelligence interview, this guide explains the role, what Goldman evaluates, and how the interview process works within the Goldman Sachs Business Intelligence group. BI roles across financial institutions have grown as companies modernize legacy systems and expand automation, which has led to more technical interviews focused on SQL, Python, visualization, and structured analytical reasoning. Many candidates strengthen these foundations through the data science interview learning path to prepare for the technical portions of the loop, including Goldman Sachs SQL interview questions that often show up in CoderPad-style screens.
What does a Goldman Sachs Business Intelligence Analyst do?
Business Intelligence analysts transform raw data into insights that improve decision making across trading, operations, engineering, compliance, and risk. Their work ensures that teams can trust the data flowing through critical systems and that leaders have reliable visibility into performance, exposure, and workflow efficiency.
Key responsibilities include:
- Analyzing complex datasets to identify trends, inefficiencies, and risk indicators
- Designing dashboards, reports, and visualizations using Tableau and internal BI platforms
- Building BI solutions with SQL, Python or R, and tools like Alteryx
- Developing data models and ETL processes that support analytics at scale
- Implementing data validation and monitoring rules to strengthen controls
- Identifying automation opportunities and improving processes across business units
- Gathering requirements, managing scope, and presenting insights to stakeholders
Candidates often practice communication and reasoning through mock interviews, since the BI role requires explaining technical findings to partners with varying levels of data fluency.
Why this role at Goldman Sachs
The Business Intelligence role at Goldman Sachs is an ideal fit for candidates who want to combine technical depth with business impact. You work on analytical tools that influence risk decisions, trading workflows, regulatory reporting, and operational strategy across one of the most data-intensive firms in finance.
Reasons candidates choose this role:
- Exposure to high-velocity, real-world financial data environments
- Opportunities to design BI solutions that directly improve operational performance and risk management
- Cross-functional collaboration with engineering, product, operations, and risk teams
- A culture that values accuracy, clarity, and disciplined analytical thinking
- Strong growth paths into analytics engineering, data science, product analytics, and risk analytics
Candidates who want to refine their SQL and analytics fundamentals can explore the SQL interview learning path to build confidence for the technical screen.
Goldman Sachs Business Intelligence Interview Process
Goldman Sachs uses a three-stage business intelligence interview process to evaluate technical depth, analytical reasoning, communication clarity, and cultural alignment. Business Intelligence analysts work across engineering, operations, risk, and strategy teams, so the process is designed to assess both practical data skills and your ability to connect insights to real business decisions. Many candidates strengthen their technical foundations through the data science interview learning path and practice communication through mock interviews to prepare for the analytical and behavioral portions of the loop.
Interview Stages Overview
| Stage | What it focuses on |
|---|---|
| HireVue video interview | Communication, motivation, behavioral skills |
| Technical screen | SQL, Python, BI tasks, data modeling, problem solving |
| Superday | Technical depth, business judgment, cultural fit, collaboration |
HireVue video interview
The HireVue interview is a pre-recorded video screen where candidates respond to behavioral and motivational questions under timed conditions. You typically have 30 seconds to prepare and up to two minutes to answer each prompt.
Interviewers look for:
- Clear communication and structured thinking
- Motivation for the BI role and for Goldman Sachs
- Ownership, leadership, and teamwork examples
- Composure under pressure and time constraint
Some BI candidates also receive a light technical or data reasoning question to gauge baseline competency.
Tip: Practice structuring two-minute responses so you can highlight your context, actions, and results without rushing.
Technical screen
The technical screen typically lasts about one hour on platforms such as CoderPad or HackerRank and often feels like a Goldman Sachs CoderPad interview focused on data skills. For Business Intelligence roles, the focus is on data manipulation, basic algorithms, and BI engineering fundamentals.
Common components include:
- SQL questions that require joins, aggregations, window functions, and data cleaning
- Python or R exercises involving data transformation or logic implementation
- Questions on data modeling, ETL workflows, and warehouse concepts
- Light visualization or interpretation questions based on tables or charts
This stage evaluates your ability to think through data problems clearly and implement clean, correct solutions.
Tip: Narrate your thought process, especially around assumptions, validation, and edge cases.
Superday
The Superday is a series of back-to-back interviews with BI peers, engineers, managers, and cross-functional partners. Each interview typically lasts 30 to 60 minutes and covers a specific dimension of the role.
Superday Structure
| Interview Type | What it focuses on | What you may do |
|---|---|---|
| Technical deep dive | SQL, Python, data models, ETL logic | Write queries, walk through code, explain workflows |
| Analytics and visualization | Interpreting data and building insights | Diagnose trends, discuss KPIs, design a dashboard |
| Data quality and controls | Accuracy, validation, anomaly detection | Investigate metric changes, propose validation rules |
| Process improvement | Workflow optimization and automation | Map a process, identify bottlenecks, suggest BI solutions |
| Behavioral and culture fit | Communication, teamwork, core values | STAR examples, conflict handling, stakeholder alignment |
Superday interviews assess how well you connect technical execution to business outcomes. Interviewers also evaluate your alignment with Goldman Sachs values such as partnership, integrity, and excellence.
Tip: Prepare one strong project story that shows end-to-end problem solving, collaboration, and measurable impact. It often becomes a reference point across multiple interviews.
Challenge
Check your skills...
How prepared are you for working as a Business Intelligence at Goldman Sachs?
Goldman Sachs Business Intelligence Interview Questions and Answers
Goldman Sachs business intelligence interviews focus on how you work with data to support risk, revenue, and operations across the firm. You can expect SQL and analytics questions grounded in real financial or operational datasets, BI and data modeling questions that test how you design reliable reporting, and behavioral questions that assess your alignment with Goldman’s values of partnership, client service, integrity, and excellence.
If you want to drill core skills before the interview, you can practice realistic BI scenarios in the business intelligence interview questions library and sharpen SQL fundamentals through the SQL interview learning path.
SQL and analytics interview questions
Business intelligence roles at Goldman Sachs rely heavily on SQL and quantitative reasoning. You will work with trade, client, risk, and operational data, and interviewers will evaluate how you join large tables, handle edge cases, and translate business questions into precise queries. Many Goldman Sachs SQL interview questions for BI roles are variations of standard business intelligence interview questions that test whether you can move from ambiguous prompts to clean, production-ready logic.
Determine the percentage of users who held the title Data Analyst immediately before Data Scientist.
Filter the title history table to relevant titles, then use window functions to order roles by start date and check whether each Data Scientist row has a previous row with title Data Analyst. This question checks your ability to work with ordered history tables (like role histories, book-of-business changes, or coverage assignments) and compute clean denominators.
Tip: Clarify whether the denominator is “all Data Scientists” or “all employees with at least two roles” before computing the percentage.
You have a table of daily PnL by trading desk and a table of VaR (Value-at-Risk) by desk and day. How would you write a query to identify days when a desk’s loss exceeded its VaR?
Join PnL and VaR tables on desk and date, then filter to rows where
pnl < 0andABS(pnl) > var_amount. You can then aggregate by desk or month to see how frequently this happens. Interviewers are testing whether you can combine financial metrics correctly and produce outputs that risk and management teams actually use.Tip: Explicitly state the grain of the final output, such as “one row per desk per breach day” or “one row per desk with total breaches over a period.”
You receive a transaction table with duplicate client trades due to a system replay. How would you identify and exclude duplicates using SQL?
A strong answer groups by business keys (client_id, trade_id, trade_date, product) and uses window functions or counts to detect multiples. You then keep the canonical record based on a rule such as the earliest
ingestion_timeor a “primary” source flag. At Goldman, this kind of reasoning is crucial because BI teams feed trading, client, and risk dashboards where double counting can materially misstate exposure.Tip: Mention at least one business key that should remain unique and how you would monitor duplicate rates over time.
Write a query to report the total distance traveled by each user in descending order.
While the original question is framed around distance, the same pattern applies to summing trade notional, revenue, or ticket volumes. Group by
user_idand sum the quantity column, ordering by the total. At Goldman, you might use this pattern to rank salespeople by number of tickets handled or operations analysts by cases processed.Tip: Call out any filters you would apply (for example, excluding cancelled trades) to avoid inflating totals.
How would you write a SQL query to compute a client’s 30-day rolling average daily trading volume?
Use a window function like
AVG(volume) OVER (PARTITION BY client_id ORDER BY trade_date ROWS BETWEEN 29 PRECEDING AND CURRENT ROW). This checks your ability to compute rolling metrics often used in risk and liquidity monitoring.Tip: Clarify how you handle weekends or holidays (calendar days vs trading days) so the interviewer sees you think about financial calendars.
You have a payments table and an FX rates table. How would you build a query that reports all payments in USD for a given week?
Join on currency and date (or nearest available FX date), then multiply the payment amount by the FX rate to USD. Interviewers want to see that you understand alignment of dates, the need to avoid double joins, and how to aggregate safely after conversion.
Tip: Mention how you would handle missing FX rates and which table you treat as the “source of truth.”
In our BI dashboards, some revenue numbers do not match finance’s official reports. How would you use SQL to investigate the discrepancy?
A strong answer outlines steps: extract the dashboard query, reproduce it directly in SQL, compare table sources and filters with finance’s logic, and then reconcile differences at the lowest possible grain (e.g., trade-level or account-level). This shows you can operationalize integrity by validating numbers instead of blindly trusting them.
Tip: Emphasize reconciling from the bottom up (detail to aggregate) and documenting the final agreed logic.
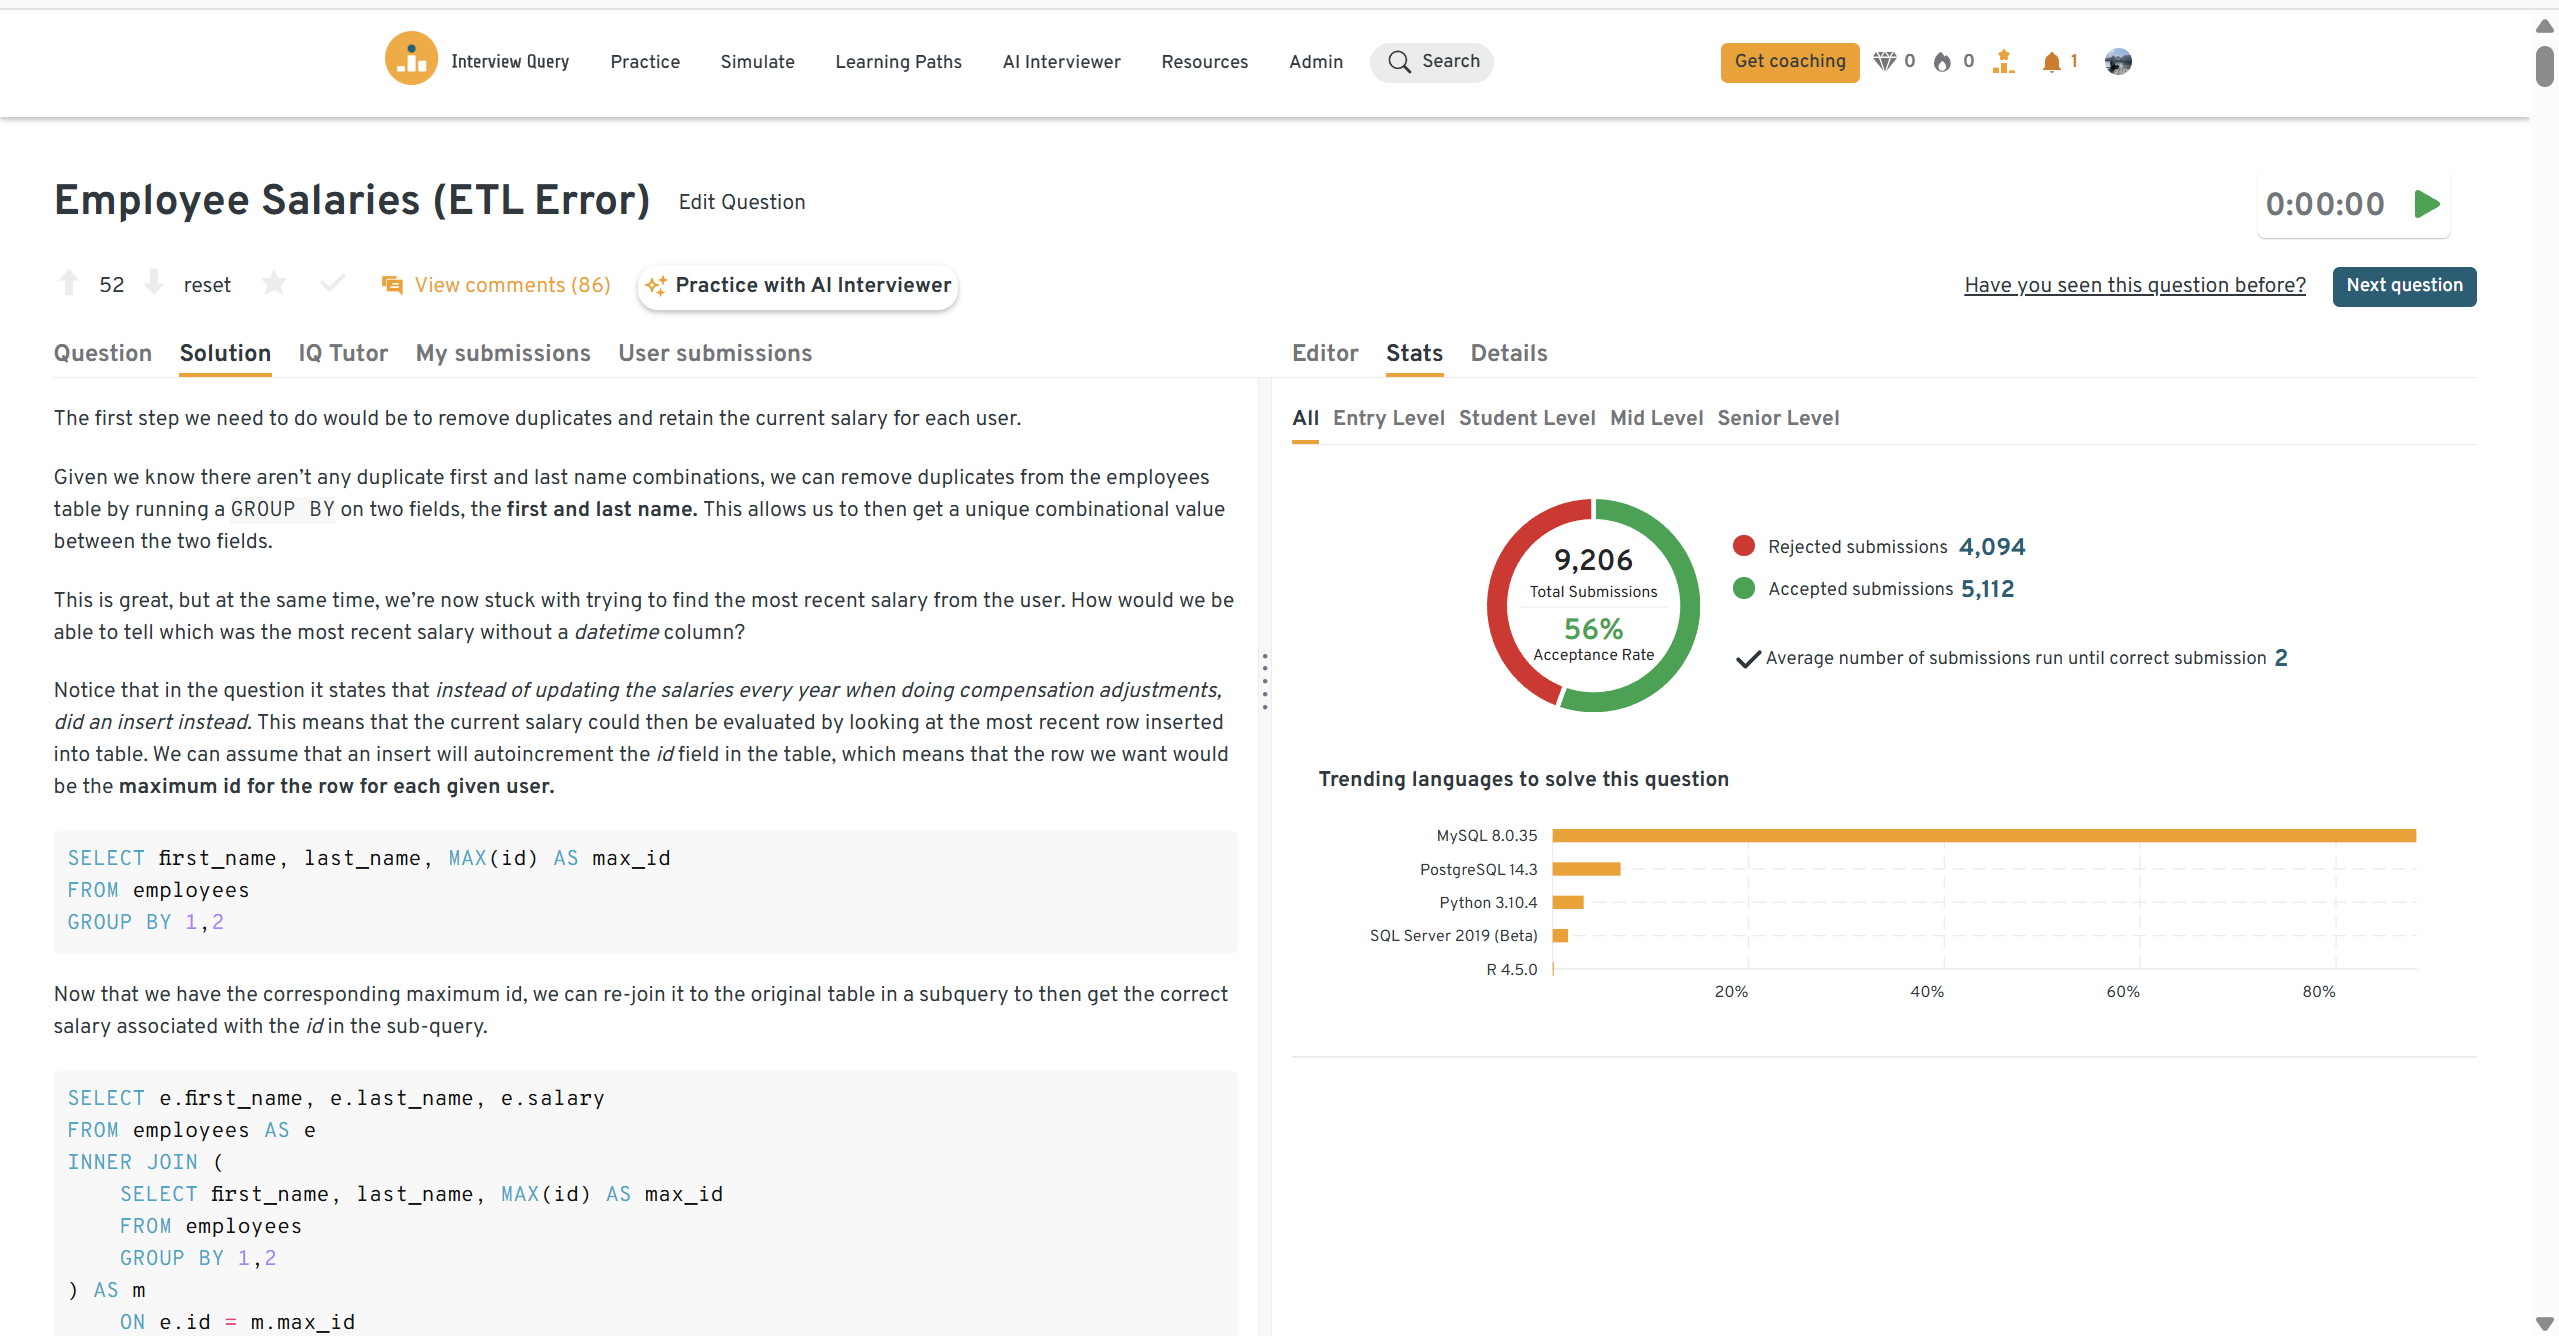
Write a query to get the current salary for each employee after an ETL error duplicated records.
Use a window function such as
ROW_NUMBER()ordered byeffective_dateorupdated_atwithin eachemployee_idto keep only the latest row. This tests your ability to repair data quality issues in core HR or compensation tables, which is important at Goldman where pay, headcount, and cost data feed directly into planning and risk models. Mention how you would validate row counts and reconcile totals with source systems.Tip: Always state which column defines “current” (timestamp or version) and describe one validation check you would run after the fix.
You can practice this exact problem on the Interview Query dashboard, shown below. The platform lets you write and test SQL queries, view accepted solutions, and compare your performance with thousands of other learners. Features like AI coaching, submission stats, and language breakdowns help you identify areas to improve and prepare more effectively for data interviews at scale.
You can practice similar patterns through the SQL interview learning path, which includes window functions, aggregations, and scenario-based questions that mirror BI work at banks and financial institutions.
If you are just starting out, browsing common business intelligence interview questions is an easy way to see how theory turns into practical SQL and analytics exercises.
Data modeling, BI design, and risk-focused interview questions
Goldman Sachs expects BI engineers to think beyond dashboards and build reliable data models and reporting structures that support risk management, regulatory reporting, and business performance tracking.
How would you design a data mart or data warehouse for a new online retailer?
Adapt this to a financial-services context by explaining how you would structure fact tables for trades, positions, or client interactions, with dimensions for clients, products, desks, dates, and currencies. Interviewers look for dimensional modeling skills, awareness of slowly changing dimensions (e.g., client hierarchy updates), and an understanding of how BI teams serve multiple stakeholders.
Tip: Connect your fact and dimension choices to specific reporting needs like PnL attribution or client coverage analytics.
How would you design a core BI model to support risk and PnL reporting across multiple trading desks?
Propose a star schema with a central
fact_positionsorfact_pnltable keyed by desk, book, product, and date. Add dimensions for instruments, calendars, desks, and legal entities. Explain how you would handle intraday vs end-of-day numbers, and how you would support both regulatory and internal views from the same warehouse. This question tests whether you can balance flexibility with strong governance.Tip: Mention the need for a single, governed set of “official” measures (for example, official daily PnL) to avoid competing versions of the truth.
Assume you are building a dashboard for senior leadership to track capital, liquidity, and risk metrics. What KPIs and design choices would you prioritize?
Strong answers identify a small set of headline KPIs (for example, capital ratios, daily PnL, VaR breaches, liquidity buffers) with supporting drill-downs by business, region, or product. You should emphasize clarity over visual complexity and explain how you would annotate definitions so senior leaders and regulators interpret metrics consistently.
Tip: Tie at least one KPI back to risk mitigation or regulatory expectations, reflecting Goldman’s focus on integrity and prudence.
You discover that two teams are using different definitions of “active client.” How would you resolve this and reflect it in BI models?
Outline a process: gather current definitions, quantify where they differ, facilitate a discussion to agree on a primary definition plus any allowed exceptions, and then encode the final logic into a shared semantic layer or dimension table. At Goldman, this demonstrates partnership and client service because consistent definitions drive better decisions and smoother audits.
Tip: Emphasize documenting the aligned metric and updating dashboards so the change is transparent to users.
-
Reformulated as: “Given a calibrated credit score with known error bounds, how would you reason about bias introduced by a hard cutoff, and what implications does that have for how we report risk?”
The question tests your understanding of model uncertainty and classification thresholds. A thoughtful answer explains that some applicants just below the cutoff may actually be good credits (false negatives) and some just above may be riskier than they appear (false positives). For BI, the key is recognizing that aggregated risk reports and approval rates are sensitive to threshold choices, so you should communicate uncertainty and consider scenario analyses.
Tip: Mention that BI teams should work with modelers and risk to present banded or probability-based views, not just single cutoffs.
How would you design monitoring for a key BI pipeline that feeds regulatory or risk reports?
You should describe data-quality checks (row counts, null checks, distribution changes), reconciliation against upstream systems, and alerts when thresholds are breached. Interviewers want to see that you understand integrity is non-negotiable when a dashboard supports regulators or risk committees.
Tip: Include at least one automated check (for example, comparing today’s totals vs last week’s) and one manual review (for example, periodic sign-off from a control team).
Imagine we want to give relationship managers a self-serve view of client profitability. How would you design the BI solution?
Describe a model that brings together revenue, funding costs, capital usage, and operating expenses per client or segment. You would expose curated tables through a BI tool (like Tableau) with filters by region, sector, and coverage team. This question checks both modeling and stakeholder empathy.
Tip: Highlight how you would keep complex definitions (for example, cost of capital allocation) behind the scenes while exposing simple, trustworthy metrics to users.
You can find related architecture and modeling practice in Interview Query’s business intelligence interview questions and modeling and machine learning interview learning path, which include warehouse design, metric-governance, and scenario-based BI modeling questions that resemble Goldman’s environment.
Behavioral and stakeholder interview questions
Behavioral interviews at Goldman Sachs evaluate how you work in high-stakes, collaborative environments where partnership, client service, integrity, and excellence are expected every day. Strong answers use clear STAR structure, emphasize how you protect decision quality with good data, and show you can partner with engineering, risk, and business teams.
Describe a data project you worked on. What were some of the challenges you faced?
Interviewers want to see how you handle ambiguity, technical constraints, and competing stakeholder demands while still delivering value. This is a good place to show ownership and how you protected data quality when something went wrong.
Tip: Include one technical challenge and one stakeholder or process challenge so you show both sides of the BI role.
Sample Answer: I led a project to build a revenue dashboard for a global sales team. Midway through, I discovered inconsistent client hierarchies across regions and missing data for one legacy system. I worked with engineering to standardize keys and with finance to agree on a single client hierarchy. While that was in progress, I delivered a limited but accurate view for the largest regions so leadership could still use it. The final dashboard became the single source of truth for weekly revenue reviews and reduced manual reconciliation time by about 30 percent.
What are some effective ways to make data more accessible to non-technical people?
Goldman values client service internally as much as externally, so they want to know how you help busy stakeholders get to answers quickly. Focus on how you simplify rather than how many tools you use.
Tip: Tie your approach directly to better decisions or faster execution for the business.
Sample Answer: I start by asking what decisions stakeholders need to make, not what charts they want. I then design dashboards around three to five core KPIs, add plain language definitions on the page, and avoid complex visuals unless they are necessary. For a risk team, I also created a short Loom walkthrough that explained how to interpret VaR and PnL views. As a result, they stopped asking for ad hoc extracts and used the dashboard directly in their weekly meetings.
What would your manager say about your strengths and weaknesses?
This question tests self-awareness and whether you fit a culture that values continuous improvement. Choose strengths that map to partnership and excellence, and weaknesses that you are actively managing.
Tip: Anchor each strength or weakness in one concrete example so it feels credible.
Sample Answer: My manager would highlight structured problem solving and reliability as my main strengths. When we had conflicting numbers in two revenue reports, I calmly traced them back to different filters, documented the root cause, and proposed a unified definition that both teams adopted. A weakness I am working on is overinvesting in polishing dashboards before sharing them. I have started sharing early drafts with a small group, which speeds up feedback and keeps me focused on what stakeholders actually need.
-
Goldman Sachs looks for people who can build long-term partnerships even when there is initial misalignment. Show how you adapted your style and improved the relationship, not just the one project.
Tip: Highlight what you learned and how you changed your approach going forward.
Sample Answer: I once supported a senior stakeholder who felt my updates were too technical and detailed. After a candid conversation, I switched to a one-page summary that led with three headlines, key risks, and a simple traffic light status for each metric. The technical detail moved to an appendix. Our meetings became shorter and more focused, and he later asked me to present that format to his broader team as a best practice.
Why do you want to work with us?
Interviewers want to hear a specific answer that links your experience to Goldman’s purpose and values. Connect your motivation to partnership with the business, integrity in reporting, and the chance to support complex financial decisions with high quality data.
Tip: Mention at least one division or type of problem where you see yourself adding value.
Sample Answer: I want to work at Goldman Sachs because BI here sits at the intersection of markets, risk, and client relationships. I am excited by the challenge of building data products that traders, risk managers, and leadership can trust for real decisions. The firm’s emphasis on partnership and integrity aligns with how I already work. I would like to bring my experience in building controlled, reconciled dashboards to support teams where data quality is critical.
Tell me about a time you used data to change a senior stakeholder’s decision.
This evaluates your ability to influence decisions while maintaining respect and trust. The best stories show that you raised concerns early and presented evidence clearly.
Tip: Emphasize how you framed the insight in terms of risk or upside for the business.
Sample Answer A senior manager wanted to retire a ‘low usage’ client reporting tool. Before the decision was final, I analyzed detailed usage logs by client segment and region. I found that although overall usage was low, a small number of high revenue clients used the tool heavily for regulatory reporting. I presented this segmented view and recommended a targeted redesign instead of full retirement. The team kept the product for those key clients and built a lighter solution for others, which protected revenue and avoided last minute escalations.
Give an example of when you identified a significant data quality issue in a report that others were relying on. What did you do?
Here they are directly testing integrity. They want someone who will protect the firm by stopping inaccurate reporting, even when it is uncomfortable.
Tip: Show both the short-term fix and the long-term control you helped put in place.
Sample Answer: While reviewing a monthly risk dashboard, I noticed that one desk’s exposure had dropped to almost zero overnight, which did not match their trading activity. I traced it to a missing file in the ETL process and confirmed with the technology team. I immediately flagged the issue to the report owner, paused distribution, and sent a note explaining the impact and timeline for correction. After we fixed the pipeline, I worked with engineering to add file completeness checks and daily alerts. Since then, similar issues have been caught automatically before reports go out.
Describe a time when you had to prioritize multiple BI requests from different teams. How did you decide what to work on first?
Goldman expects you to balance client service with disciplined prioritization. Good answers show a simple framework and clear communication, not trying to say yes to everything.
Tip: Mention how you involved stakeholders in the tradeoff discussion instead of deciding in a vacuum.
Sample Answer: When I joined my last team, I inherited a long queue of BI requests from sales, risk, and operations. I created a simple intake sheet that captured impact, urgency, and whether the request supported regulatory or executive reporting. I then grouped similar requests, shared a proposed priority list with all requesters, and asked for feedback. Regulatory and executive dashboards went first, followed by items that would automate high volume manual work. This approach made the tradeoffs transparent and reduced ad hoc escalations because everyone understood why certain projects were at the top of the queue.
You might think that behavioral interview questions are the least important, but they can quietly cost you the entire interview. In this video, Interview Query co-founder Jay Feng breaks down the most common behavioral questions and offers a clean framework for answering them effectively.
How To Prepare For a Goldman Sachs Business Intelligence Interview
Preparing for a Goldman Sachs business intelligence interview means showing structured thinking, control-oriented problem solving, and strong alignment with the firm’s purpose and values: Partnership, Client Service, Integrity, and Excellence. BI roles operate in high-stakes environments where data accuracy, auditability, and clarity matter as much as technical skill. Many candidates build foundations through the business intelligence interview questions page, reinforce SQL fundamentals in the SQL interview learning path, and rehearse their behavioral delivery through mock interviews.
Below are seven strategies to prepare effectively.
Demonstrate structured reasoning and precision aligned with Goldman’s culture of excellence
Excellence at Goldman means breaking down complex operational or regulatory problems into clean, auditable steps. Interviewers expect disciplined reasoning when defining KPIs, validating data, or diagnosing mismatches. Practicing frameworks through the BI interview questions section helps reinforce structured responses.
Tip: Start every answer with a roadmap (“I’d break this into three parts…”) to show clarity and discipline.
Show understanding of financial workflows, control processes, and risk-sensitive data
BI teams interact with operations, risk, controllers, engineering, and compliance. You will be expected to understand trade lifecycles, reconciliations, exception handling, and data lineage. Reviewing case-style prompts in the analytics interview questions set can help you simulate real GS scenarios.
Tip: Before interviews, refresh basics like trade capture, clearing, and upstream-downstream data dependencies.
Translate ambiguous business questions into measurable, client-oriented requirements
Interviewers look for your ability to convert unclear requests into precise metric definitions, data requirements, and acceptance criteria. This aligns with the value of Client Service. Studying patterns from the business analyst interview questions library can help you practice this translation step.
Tip: Clearly define scope and assumptions before proposing any KPIs or dashboards.
Strengthen your analytical toolkit so you can validate data with confidence
Goldman prioritizes Integrity, so SQL and analytical reasoning must reflect accuracy, validation, and completeness. You can practice multi-step SQL prompts that mirror GS’s operational data through the SQL interview questions page.
Tip: In every SQL answer, mention at least one validation step such as row counts or timestamp integrity checks.
Build fluency with BI tools and modeling concepts used across Goldman’s dashboards and pipelines
BI roles rely on SQL, Tableau, Python or R, and warehousing concepts such as dimensional modeling and ETL design. Reviewing end-to-end scenarios in the take-home challenges page helps you practice building reusable, auditable structures.
Tip: Highlight how you have used fact tables, SCDs, or ETL validation checks to support reliable reporting.
Prepare one end-to-end BI project story that highlights ownership and measurable impact
Final rounds often include a walkthrough of a dashboard, ETL pipeline, or metric definition you owned. Keep it concise and focused on the problem, data, logic, insights, and impact. Practicing in the mock interviews section helps refine delivery.
Tip: Keep your walkthrough under ninety seconds and emphasize decisions enabled by your work.
Practice behavioral stories tied directly to Goldman’s values of Partnership, Client Service, Integrity, and Excellence
Behavioral questions are heavily weighted. Use the STAR format to show collaboration, cross-functional alignment, and adherence to controls and risk frameworks. You can practice similar prompts in the behavioral interview questions collection.
Tip: Finish each story with a clear, measurable outcome to reinforce impact and value alignment.
FAQs
How competitive is the Goldman Sachs business intelligence interview, and what kinds of behavioral or scenario-based questions should I expect?
It is highly competitive because BI roles support operations, risk, engineering, and front office teams. Interviewers expect structured thinking, strong SQL foundations, and clear communication aligned with Goldman’s core values of Partnership, Client Service, Integrity, and Excellence. You will see a mix of Goldman Sachs behavioral interview questions and scenario-based interview questions focused on data quality, risk, and stakeholder alignment. Many candidates warm up using the business intelligence interview questions collection.
What technical skills are most important for this role?
SQL is essential, followed by Python or R for transformations, and Tableau for visualization. BI candidates must also understand data modeling, ETL concepts, and operational workflows. Reviewing patterns through the SQL interview learning path can help reinforce fundamentals.
Do BI roles at Goldman require financial knowledge?
Not at the start, but an understanding of trading lifecycles, reference data, reconciliations, and regulatory controls strengthens performance in final round discussions. Candidates who can map data flows to financial processes stand out.
What types of questions appear in the HireVue stage?
Expect behavioral questions, competency-based prompts, and one or two technical questions related to SQL or data logic. HireVue emphasizes clarity, structure, and alignment with the firm’s values. You can practice timing and structure through mock interviews.
What technical challenge should BI candidates expect?
BI candidates may receive SQL, algorithmic, or data transformation problems that mirror real operational scenarios. Questions often involve joins, window functions, data validation, and interpreting ambiguous requirements.
How long is the overall interview timeline?
Most candidates move from HireVue to Superday within three to five weeks. Timeline varies based on team availability, the complexity of the role, and technical challenge scheduling.
Does Goldman Sachs allow hybrid or remote work for BI roles?
Some teams allow hybrid schedules, but most BI functions remain office-based to support cross-functional collaboration and sensitive data workflows. You can confirm expectations with your recruiter.
What backgrounds do successful BI candidates come from?
Candidates often come from analytics, data engineering, financial operations, consulting, or business systems roles. Strong performers present clean reasoning, reliable SQL skills, and the ability to connect data insights to business outcomes.
Level Up Your Goldman Sachs BI Interview Prep
Breaking into a Goldman Sachs BI role requires more than technical accuracy. It requires the ability to reason clearly under pressure, translate data into measurable impact, and navigate complex financial workflows with discipline. When you combine strong analytical fundamentals with a deep understanding of how data drives operational and client outcomes, you become the kind of candidate Goldman looks for.
If you want to sharpen your preparation, Interview Query gives you a structured path forward. You can practice realistic SQL and BI scenarios through the SQL interview learning path, explore detailed BI case questions in the business intelligence interview library, and refine your communication through interactive mock interviews.
Build a preparation routine that mirrors the precision and rigor Goldman expects and step into your interview ready to deliver clear, thoughtful, and high-quality answers.
Goldman Sachs Interview Questions
| Question | Topic | Difficulty |
|---|---|---|
Product Sense & Metrics | Easy | |
Let’s say that you’re the PM on Google Maps.
| ||
Data Structures & Algorithms | Easy | |
Machine Learning | Easy | |
SQL | Easy | |
Machine Learning | Medium | |
Statistics | Medium | |
SQL | Hard | |
Machine Learning | Medium | |
Python | Easy | |
Deep Learning | Hard | |
SQL | Medium | |
Statistics | Easy | |
Machine Learning | Hard |
Discussion & Interview Experiences