
Apple Business Intelligence Interview Guide: Process, Questions & Prep


Introduction
Preparing for an Apple business intelligence interview means preparing to operate inside one of the most data-rich consumer ecosystems in the world. Apple’s products and services span billions of users across devices, subscriptions, and transactions, generating continuous streams of behavioral, operational, and financial data. Business intelligence teams sit close to leadership, using this data to evaluate product performance, guide go-to-market decisions, and surface risks and opportunities across Apple’s hardware, software, and services businesses.
The interview process reflects that responsibility. Many candidates underestimate Apple’s BI interviews by focusing only on dashboards or tooling, when the real evaluation centers on structured thinking, SQL precision, and the ability to turn ambiguous data into clear recommendations. Interviewers look for candidates who can define the right metrics, reason through tradeoffs, and communicate insights with confidence in a privacy-first environment. This guide walks through the Apple business intelligence interview process, explains what each stage is designed to assess, and shows how to prepare for the skills Apple BI teams actually value.
Apple Business Intelligence Interview Process
The Apple business intelligence interview process is designed to evaluate how well candidates can translate large-scale data into clear, actionable insights while operating within Apple’s strict privacy and governance standards. Across stages, interviewers assess SQL fluency, analytical reasoning, data modeling fundamentals, and the ability to communicate findings to non-technical stakeholders. Most candidates complete the process in four to six weeks, depending on team availability and the number of technical rounds.
Interview process overview
Candidates typically go through a recruiter screen, one or more technical interviews focused on SQL and analysis, and a virtual or onsite loop that combines case-based analysis and behavioral evaluation. Unlike purely technical roles, Apple business intelligence interviews strongly emphasize decision-making, storytelling with data, and business judgment alongside technical correctness.
Interview process summary
| Interview stage | What happens |
|---|---|
| Application and resume screen | Recruiters assess analytical background, SQL experience, and business-facing impact |
| Recruiter screen | Fit, motivation, role alignment, and logistics |
| Online assessment or technical screen | SQL-heavy analysis and basic Python or logic exercises |
| Onsite or virtual interview loop | Case studies, advanced SQL, analytics reasoning, and behavioral interviews |
| Hiring manager or leadership interview | Business judgment, communication, and team fit |
| Offer and team matching | Final leveling and compensation review |
Application and resume screen
Apple recruiters use the resume screen to identify candidates with real-world business intelligence experience, not just reporting exposure. Strong resumes demonstrate ownership of metrics, experience querying large datasets, and clear examples of how insights influenced decisions. Apple values candidates who can explain why an analysis mattered, not just how it was built.
This is also where candidates are often aligned to specific teams, such as services, operations, product analytics, or finance. That alignment can shape the types of case studies or metrics discussed later in the process.
Apple-specific tip: Frame resume bullets around business question → analysis performed → decision or impact, not tools used.
Recruiter screen
The recruiter screen is usually a 20 to 30 minute conversation focused on background, motivation, and expectations. Recruiters ask about your experience with data analysis, the types of stakeholders you have supported, and what kinds of business problems you enjoy solving. Compensation expectations and location preferences are often discussed at this stage.
Apple places early emphasis on motivation. Candidates are expected to articulate why Apple’s products, ecosystem, or data challenges interest them, rather than giving a generic BI answer.
Apple-specific tip: Be prepared to reference a specific Apple product or service and explain how data could improve it.
Online assessment or technical screen
Many Apple business intelligence roles include a technical screen or online assessment focused heavily on SQL. Candidates can expect questions involving joins, aggregations, window functions, and edge-case handling on realistic datasets such as user activity or revenue tables. Some teams also include light Python or logic-based data manipulation.
Interviewers evaluate clarity of logic, correctness, and how well you structure queries under realistic constraints. Practicing structured SQL questions from the SQL interview learning path is especially relevant here.
Apple-specific tip: Talk through your assumptions and logic as you write queries. Apple interviewers care about reasoning as much as the final output.
Onsite or virtual interview loop
The onsite or virtual loop is the most comprehensive stage and typically includes three to five interviews. Each round evaluates a different dimension of business intelligence work at Apple.
Typical loop structure
| Interview focus | What is evaluated |
|---|---|
| Advanced SQL and analytics | Query correctness, performance awareness, and metric reasoning |
| Business case analysis | Ability to structure ambiguous problems and derive insights |
| Data storytelling | Communicating findings clearly to non-technical stakeholders |
| Behavioral and culture fit | Ownership, collaboration, and judgment |
During case-based interviews, candidates may be asked to analyze a business scenario such as declining engagement, revenue changes, or feature adoption. Interviewers look for how you define metrics, choose analyses, and connect results to decisions. Practicing case-style questions through challenges and explaining results aloud helps prepare for this format.
Apple-specific tip: Always link insights back to a decision. Avoid stopping at descriptive analysis.
Hiring manager review and offer stage
After the loop, feedback is consolidated and reviewed by the hiring manager and leadership. Some candidates may have an additional conversation focused on team fit, scope of responsibility, or long-term growth. Once alignment is reached, recruiters move into leveling and offer discussions.
Apple-specific tip: Be ready to articulate what type of business intelligence work you want, such as product analytics versus operational reporting, to support team matching.
Challenge
Check your skills...
How prepared are you for working as a Business Intelligence at Apple?
Apple Business Intelligence Interview Questions
Apple Business Intelligence interview questions are designed to assess how effectively you can translate complex data into clear, actionable insights that influence product and business decisions. Interviewers focus on strong SQL fundamentals, analytical reasoning, data storytelling, and experimentation judgment rather than deep systems engineering. Successful candidates demonstrate precision in querying, clarity in metrics definition, and the ability to communicate insights to both technical and non-technical stakeholders in a privacy-first environment.
Below are the most common categories of Apple business intelligence interview questions, with notes on relevance where applicable.
SQL & Data Manipulation Questions
SQL is consistently the core technical screen for Apple Business Intelligence roles. These questions test whether you can write correct, scalable queries for business metrics, user behavior, and messy real-world tables. Interviewers care deeply about correctness at the right grain, handling edge cases, and explaining assumptions clearly.
-
This question evaluates your ability to combine filtering, conditional aggregation, and ranking without breaking the data grain. You must enforce the minimum department size using a
HAVINGclause, calculate the percentage of high earners using aCASEexpression, and rank departments correctly. Apple BI interviewers use this type of problem to assess whether you can translate leadership-facing questions into precise, defensible SQL logic.Tip: Always state the grain of your query before writing SQL and sanity-check the denominator in percentage calculations.
-
This question tests your ability to reason about user lifecycle behavior over time. A strong solution identifies each user’s first purchase date and checks for any subsequent purchase on a strictly later date using window functions or a self-join. Interviewers will pay close attention to how you handle same-day purchases, timestamp versus date logic, and edge cases.
Tip: Clarify whether “later day” means a different calendar date and handle same-day repeat purchases explicitly.
List all neighborhoods that have zero associated users in the users table.
This is a classic anti-join problem that evaluates your understanding of exclusion logic. You can solve it using a
LEFT JOINwith a null filter or aNOT EXISTSsubquery, but you should be able to explain why your approach avoids false positives. Apple BI interviews often use questions like this to confirm comfort with joins, null handling, and data completeness checks.Tip: Prefer
NOT EXISTSwhen the joined table may contain duplicates that could affect results.Generate a three-day rolling average of daily deposit amounts from the bank transactions table.
This question evaluates your command of window functions and time-series analysis. You are expected to aggregate transactions to the daily level before applying a rolling average over a defined window frame. Interviewers may probe whether you chose
ROWSversusRANGEcorrectly and how your logic behaves when days are missing.Tip: Always aggregate to the correct time grain before applying rolling window calculations.
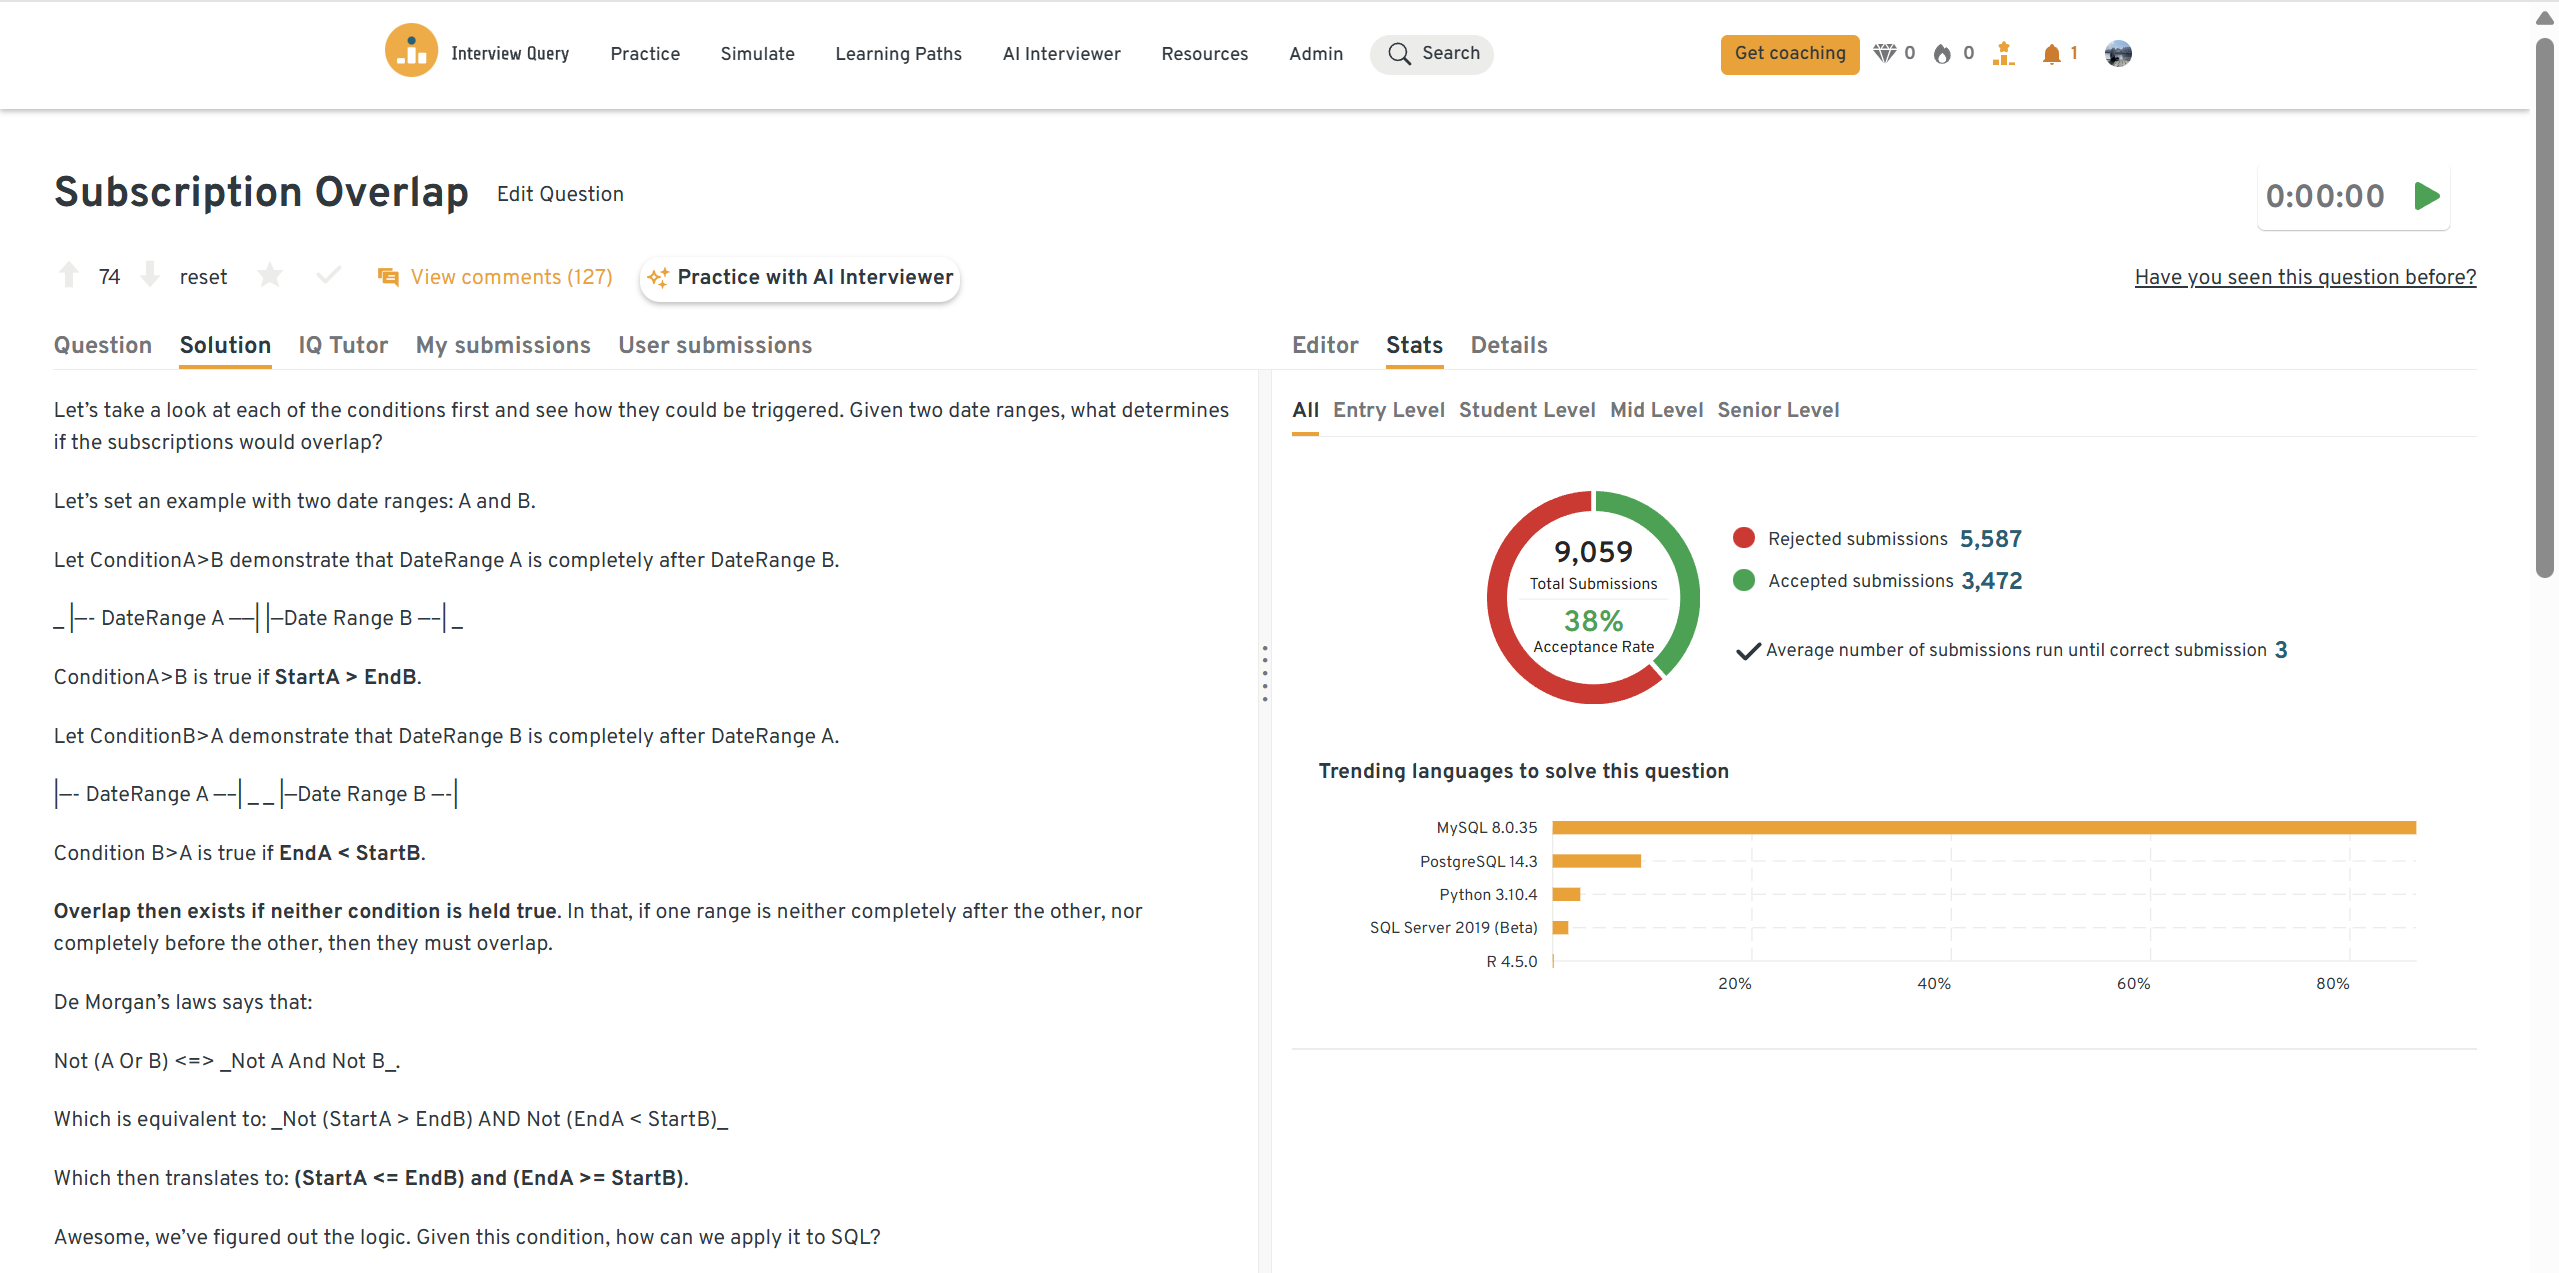
Identify users whose subscription date ranges overlap with any other completed subscription.
This question tests interval logic and self-join reasoning, which are common in subscription and entitlement analyses. A correct solution detects overlapping date ranges using inequality conditions while excluding self-matches. Apple interviewers often look for clear explanations of how you avoid double-counting and validate overlap logic.
Tip: Use the standard overlap condition (
start_a <= end_b AND start_b <= end_a) and explicitly exclude identical records.You can practice this exact problem on the Interview Query dashboard, shown below. The platform lets you write and test SQL queries, view accepted solutions, and compare your performance with thousands of other learners. Features like AI coaching, submission stats, and language breakdowns help you identify areas to improve and prepare more effectively for data interviews at scale.
Data Visualization & Storytelling Questions
Apple Business Intelligence roles place heavy emphasis on how clearly you communicate insights, not just how you compute them. These questions assess whether you can choose the right metrics, design intuitive dashboards, and tell a coherent story that helps product, marketing, and executive teams make decisions. Strong candidates demonstrate structured thinking, audience awareness, and the ability to move from observation to recommendation.
How would you construct a dashboard to track adoption trends for a new Apple Watch feature across geographies?
This question evaluates your ability to define adoption metrics, segment users meaningfully, and surface geographic patterns. Interviewers expect you to discuss cohort-based adoption rates, time-series trends, and regional comparisons rather than raw usage counts. Strong answers explain how the dashboard would guide follow-up questions, such as identifying underperforming regions or correlating adoption with launches or campaigns.
Tip: Start with one primary adoption metric, then layer geography and cohorts only after establishing a clear baseline.
Describe how you’d visualize a user funnel for onboarding into a new iOS feature and communicate drop-off points.
Funnel analysis is a core BI responsibility at Apple, especially for feature launches. Interviewers look for clear step definitions, conversion rates between stages, and thoughtful segmentation by device, OS version, or acquisition source. You should also explain how you would annotate UX changes or incidents to contextualize sudden drop-offs.
Tip: Always pair funnel percentages with absolute counts to avoid misleading conclusions.
How would you present findings from an anomaly in App Store crash rates to both engineers and executives?
This question tests audience-aware storytelling, which is critical for Apple BI roles. A strong answer explains how you would start with a high-level summary of impact, then progressively drill down into technical detail for engineering audiences. Interviewers want to see that you can balance urgency, clarity, and technical accuracy without overwhelming stakeholders.
Tip: Lead with impact first, then diagnostics, and end with clear next steps.
What visualization approaches would you use to compare ARPU across different Apple services, and how would you tell that story?
This question evaluates comparative analysis and strategic communication. You should describe how you would show ARPU trends over time, normalize across services, and highlight meaningful differences rather than noise. Interviewers look for insight-driven narratives that connect ARPU movement to product changes, pricing, or user mix.
Tip: Anchor comparisons around trends and deltas, not static point-in-time values.
How would you design a dashboard to help leadership understand why a product’s engagement declined quarter over quarter?
This question assesses root-cause thinking and metric decomposition. A strong answer discusses breaking engagement into drivers such as active users, frequency, and session depth, then visualizing each component over time. Apple interviewers value dashboards that narrow ambiguity and enable decision-making rather than simply reporting declines.
Tip: Decompose high-level metrics into controllable inputs before adding explanatory dimensions.
To practice visualization and storytelling under realistic constraints, many candidates rehearse explaining dashboards aloud using timed prompts or mock sessions. Tools like the mock interviews and applied BI scenarios in challenges help simulate how Apple interviewers evaluate clarity and narrative flow.
Product & Experiment Design Questions
Apple Business Intelligence interviews strongly emphasize experimentation judgment and metric design. These questions assess whether you can design valid experiments, reason about causality, and translate results into product decisions rather than just reporting statistical significance. Interviewers look for rigor, restraint, and clarity, especially when experiments influence high-visibility product changes.
-
This question evaluates your ability to distinguish short-term behavioral spikes from durable product impact. A strong answer explains how you would compare treatment and control cohorts over time, monitor decay curves, and segment by new versus existing users. Interviewers expect you to account for seasonality, concurrent launches, and other confounders that can falsely inflate early results.
Tip: Always extend analysis beyond the initial rollout window to test whether gains persist.
-
This tests your understanding of statistical power and experimental validity. You should explain how imbalance affects variance, confidence intervals, and minimum detectable effects, then describe mitigation strategies such as reweighting, stratification, or extending the experiment. Apple interviewers value candidates who recognize when results are directionally informative but not decision-ready.
Tip: Recalculate power before interpreting results and clearly state any limitations.
-
This question assesses rigor in experimentation at scale. Interviewers expect discussion of multiple-comparison corrections, baseline balance checks, and guarding against peeking or early stopping. Strong answers also connect statistical significance to practical significance, ensuring results justify real product changes.
Tip: Treat p-values as a starting point, not the final decision signal.
-
This question evaluates end-to-end experiment design in a real product context. A strong response defines clear success metrics, ensures randomization across key segments, and outlines sample size and duration requirements. Apple interviewers look for thoughtful stopping rules and an explanation of how results would be rolled out safely.
Tip: Limit the number of primary metrics to avoid conflicting signals.
[How would you determine whether an observed increase in conversion is driven by product changes rather than shifts in traffic mix?]
This tests causal reasoning beyond basic experimentation. You should describe segmenting by acquisition source, device type, or geography, and validating consistency of lift across cohorts. Interviewers value candidates who proactively check whether external factors explain observed improvements.
Tip: Always validate lifts across stable segments before attributing causality.
To build fluency in experiment design and analysis, many candidates practice applied scenarios using realistic prompts rather than textbook statistics. Resources like hands-on exercises from takehomes and live practice with the AI interview help mirror how Apple evaluates experimental judgment.
Behavioral & Culture-Fit Questions
Behavioral interviews for Apple Business Intelligence roles focus on judgment, ownership, and influence rather than personality alone. Interviewers evaluate how you operate in ambiguous environments, communicate insights responsibly, and collaborate across product, engineering, and leadership teams. Strong candidates demonstrate structured thinking, discretion with sensitive data, and the ability to drive decisions without relying on authority.
How do you navigate and resolve conflicts with team members during high-stakes projects?
This question assesses how you handle disagreement when decisions matter and timelines are tight. Apple interviewers look for calm, data-driven conflict resolution rather than escalation or avoidance. Strong answers show how you align on goals, listen actively, and use evidence to move discussions forward.
Tip: Emphasize how you preserved trust while still pushing for the right outcome.
How do you manage competing priorities and deadlines in a fast-paced environment?
Apple BI teams often support multiple stakeholders with overlapping needs. Interviewers want to understand how you prioritize based on impact, urgency, and risk, not just who asks first. Clear communication and expectation-setting matter as much as execution.
Tip: Frame prioritization decisions around business impact and downstream consequences.
Tell me about a time when your data-driven recommendation faced resistance. How did you respond?
This question evaluates influence without authority. Apple values analysts who can defend insights thoughtfully while remaining open to feedback and alternative perspectives. Strong answers highlight how you reframed the narrative, clarified assumptions, or adjusted analysis to build alignment.
Tip: Focus on how you balanced conviction with collaboration.
Describe a project where you went beyond the stated requirements to deliver exceptional value.
Apple interviewers look for proactive ownership, not just task completion. This question assesses whether you identify opportunities to deepen insight, automate workflows, or elevate decision quality beyond what was initially requested. Impact and follow-through matter more than effort alone.
Tip: Quantify the business or product impact of going beyond the original scope.
Have you ever uncovered a data issue that could have misled business decisions? How did you handle it?
This question probes data stewardship and accountability. Apple BI roles require vigilance around data quality, especially when insights influence leadership decisions. Strong answers show how you identified the issue early, communicated risks clearly, and implemented safeguards to prevent recurrence.
Tip: Highlight prevention mechanisms, not just the immediate fix.
Many candidates refine these responses through structured practice, especially when timing and clarity matter. Tools like mock interviews and guided feedback through coaching help simulate the conversational style Apple interviewers use.
If you want a structured walkthrough of how Business Intelligence interviews are evaluated, this video by Interview Query founder Jay Feng is a helpful companion. In this video, Jay explains what interview questions get asked in business intelligence interviews, the difference between BI engineers and BI analysts, the main categories of BI questions, and how strong candidates approach answers with clarity and structure.
How to Prepare for an Apple Business Intelligence Interview
Preparing for an Apple business intelligence interview requires more than polishing dashboards or memorizing SQL syntax. Apple evaluates whether you can reason through ambiguous business problems, define the right metrics, and communicate insights responsibly in a privacy-first environment. Your preparation should mirror how Apple BI teams operate day to day, not generic analytics interview prep.
Prioritize SQL correctness and metric definition.
SQL is the foundation of Apple’s BI interviews, especially in early technical screens. Focus on writing correct, defensible queries that handle edge cases such as duplicates, nulls, and time boundaries. Spend time explaining your logic out loud, since interviewers care as much about reasoning as results. Structured practice through the sql interview learning path helps reinforce query patterns commonly tested at Apple.
Develop strong analytical storytelling skills.
Apple BI roles require translating analysis into decisions. Practice explaining what a metric means, why it matters, and what action it suggests, rather than simply reporting values. Rehearse walking stakeholders through a dashboard or analysis in a clear narrative arc. Practicing scenarios from mock interviews helps simulate how Apple interviewers probe for clarity and judgment.
Practice experiment and causality reasoning.
Many Apple BI interviews include questions about A/B tests, novelty effects, or traffic-mix shifts. Focus on explaining how you would validate results, check assumptions, and avoid false conclusions. Hands-on practice through applied scenarios like takehomes or structured prompts from the data science interview learning path helps build this muscle.
Avoid common preparation mistakes.
Candidates often overprepare on tools or advanced statistics while underpreparing on business framing. Apple interviewers are less interested in which visualization tool you use and more interested in how you define success and risk. Avoid memorized answers and focus instead on flexible frameworks that adapt to new contexts.
Refine behavioral judgment and communication.
Behavioral interviews at Apple emphasize ownership, discretion, and influence. Prepare stories where you identified data risks early, navigated pushback, or changed decisions through evidence. Practicing concise delivery with feedback using the ai interview or guided sessions via coaching can significantly improve confidence and structure.
If you prepare with intention, focusing on reasoning over rote execution, you’ll walk into the Apple business intelligence interview ready to perform at the level Apple expects.
Role Overview and Culture at Apple
A business intelligence professional at Apple operates at the intersection of data, product, and decision-making, translating complex datasets into insights that guide product strategy, operational improvements, and executive decisions. BI teams support functions such as Services, Retail, Operations, Marketing, and Finance, often working with data tied to products used by hundreds of millions of customers worldwide.
Day to day, the role goes beyond standard reporting and focuses on structured analysis, metric definition, and insight generation that influences real business outcomes. Typical responsibilities include:
- Writing complex SQL queries to extract, transform, and validate large-scale datasets from enterprise data warehouses.
- Building dashboards and reports that track product performance, customer behavior, and operational metrics.
- Defining and maintaining core business metrics to ensure consistency across teams and leadership reporting.
- Conducting deep-dive analyses to identify trends, anomalies, and growth opportunities across Apple products and services.
- Supporting experimentation and evaluation efforts by analyzing feature launches, campaigns, or process changes.
- Translating analytical findings into clear narratives and recommendations for non-technical stakeholders and executives.
Business intelligence at Apple is highly cross-functional. BI professionals work closely with product managers, engineers, data engineers, and business leaders to frame the right questions, align on success metrics, and ensure insights are grounded in real operational context. Clear communication and stakeholder alignment are essential, as insights often influence roadmap decisions and strategic priorities.
Culturally, Apple emphasizes precision, discretion, and ownership. BI teams are expected to handle sensitive data responsibly, challenge assumptions with evidence, and deliver work that is both analytically rigorous and well-polished. Success in this role looks like becoming a trusted thought partner who consistently brings clarity to complex decisions while operating within Apple’s privacy-first environment.
Apple-specific tip: Compared to BI roles elsewhere, success at Apple depends less on dashboard volume and more on judgment, storytelling, and the ability to influence decisions using carefully framed, privacy-aware insights.
Average Apple Business Intelligence Salary
Apple does not publicly break out compensation specifically for business intelligence roles. However, recent data from Levels.fyi shows that Apple’s business analyst compensation provides a strong proxy for business intelligence positions, as both roles operate at similar levels of analytical scope, stakeholder exposure, and decision impact. In the United States, total compensation for Apple Business Analyst roles typically ranges from approximately $110,000 per year at junior levels to over $280,000 per year at senior levels, depending on level and team.
Average Base Salary
Average Total Compensation
Apple compensation emphasizes stable base salary combined with meaningful equity grants and performance-based bonuses. For BI-aligned roles, pay increases significantly with seniority, reflecting greater ownership of metrics, strategic influence, and cross-functional leadership.
National Compensation Overview (United States)
Business Analyst roles as proxy for Business Intelligence positions
| Level | Total Compensation (Annual) | Base Salary (Annual) | Stock (Annual) | Bonus (Annual) |
|---|---|---|---|---|
| ICT2 (Junior) | $108,000 | $108,000 | $7,200 | $2,200 |
| ICT3 (Mid-level) | $180,000 | $132,000 | $28,800 | $11,300 |
| ICT4 (Senior) | $216,000 | $156,000 | $52,800 | $13,200 |
| ICT5 (Lead / Principal) | $288,000 | $180,000 | $85,200 | $30,000 |
Across most U.S. locations, early-career business intelligence–aligned roles cluster around the low-to-mid $100K range, while senior roles show a substantial increase driven primarily by equity and higher-impact responsibilities. As with most Apple positions, compensation varies by team, location, and scope, but long-term upside grows significantly with seniority and sustained ownership.
FAQs
How long does the Apple business intelligence interview process take?
Most candidates complete the Apple business intelligence interview process within four to six weeks, depending on team availability and interview scheduling. Early stages such as recruiter and technical screens usually move quickly, while onsite or virtual loops may take longer due to panel coordination. Recruiters typically provide updates after each stage, though timelines can vary by org.
How technical is the Apple business intelligence interview?
The interview is highly analytical but not engineering-heavy. Candidates are evaluated on SQL proficiency, metric design, experiment reasoning, and data storytelling rather than complex algorithms or system internals. Apple interviewers care more about correctness, judgment, and communication than about using advanced tools or frameworks.
Does Apple require prior FAANG or big tech experience for BI roles?
No. Apple does not require prior FAANG experience for business intelligence roles. Candidates from startups, mid-sized companies, consulting, or non-traditional backgrounds can succeed if they demonstrate strong analytical fundamentals, structured thinking, and the ability to influence decisions using data.
How important is privacy awareness in Apple BI interviews?
Privacy awareness is extremely important. Interviewers often probe how you minimize data exposure, define access boundaries, and interpret metrics responsibly. Candidates who proactively discuss privacy tradeoffs and data stewardship tend to stand out.
Think Like an Apple Business Intelligence Analyst
Landing an Apple business intelligence role means showing more than strong SQL or clean dashboards. You need to demonstrate how you frame business questions, reason through ambiguity, and communicate insights that leaders can trust. Apple interviews reward candidates who prepare deliberately, practice real decision-making scenarios, and explain their thinking with clarity and confidence.
The most effective way to prepare is to mirror the interview itself. Work through realistic SQL, funnel analysis, and experimentation questions that reflect Apple’s scale and constraints, then practice explaining your conclusions out loud. Focus your preparation using targeted resources like the sql interview learning path and the data science interview learning path, and simulate real interview pressure through mock interviews or personalized feedback with coaching.
With the right preparation strategy, you can walk into the Apple business intelligence interview composed, credible, and ready to operate at the level Apple expects.
Apple Interview Questions
| Question | Topic | Difficulty | ||||||||||||||||||||||
|---|---|---|---|---|---|---|---|---|---|---|---|---|---|---|---|---|---|---|---|---|---|---|---|---|
SQL | Easy | |||||||||||||||||||||||
Write a SQL query to select the 2nd highest salary in the engineering department. Note: If more than one person shares the highest salary, the query should select the next highest salary. Example: Input:
Output:
| ||||||||||||||||||||||||
SQL | Medium | |||||||||||||||||||||||
Data Structures & Algorithms | Easy | |||||||||||||||||||||||
SQL | Easy | |
Machine Learning | Medium | |
Statistics | Medium | |
SQL | Hard | |
Machine Learning | Medium | |
Python | Easy | |
Deep Learning | Hard | |
SQL | Medium | |
Statistics | Easy | |
Machine Learning | Hard |
Discussion & Interview Experiences