Stripe Interview Questions for 2026 (Real Questions Shared by Candidates)


Introduction
If you are getting ready for Stripe interview questions this year, you are preparing for one of the toughest interview processes in tech. Stripe has a reputation for small, fast teams, high standards, and a mission that shapes the way money moves online: to increase the GDP of the internet. In 2023 alone, Stripe processed over $1 trillion in payments for millions of businesses in more than 120 countries.
This guide is here to help you get ready. You will see how Stripe structures its interviews, the types of questions to expect in engineering, data, product, and operations roles, and the strategies candidates use to stand out. Think of it as your playbook to walk into the interview with confidence and prepare in a way that matches Stripe’s culture and expectations.
Why work at Stripe?
So why do so many ambitious people target roles at Stripe? A few reasons stand out:
- Impact at scale: Stripe powers payments for startups and Fortune 500s alike, supporting millions of companies and handling more than a trillion dollars in transactions each year. Every project you touch connects directly to how businesses succeed online.
- Clear growth paths: Whether you want to grow as an individual contributor or move into management, Stripe offers a defined track. Many employees take on cross-functional leadership or product ownership within just a few years.
- Global collaboration: With over 8,000 employees across markets, you will work with colleagues from different time zones and backgrounds, gaining exposure to global problems and solutions.
- Culture of rigor: Stripe is famous for its documentation-driven culture. Decisions are thoughtful, feedback is encouraged, and you get the trust and space to make an impact quickly.
Working here means stepping into an environment where responsibility grows with your contribution. If you thrive on ownership and want your work to influence how the internet’s economy runs, Stripe gives you the stage to do it.
Challenge
Check your skills...
How prepared are you for working at Stripe?
What’s Stripe’s interview process like?
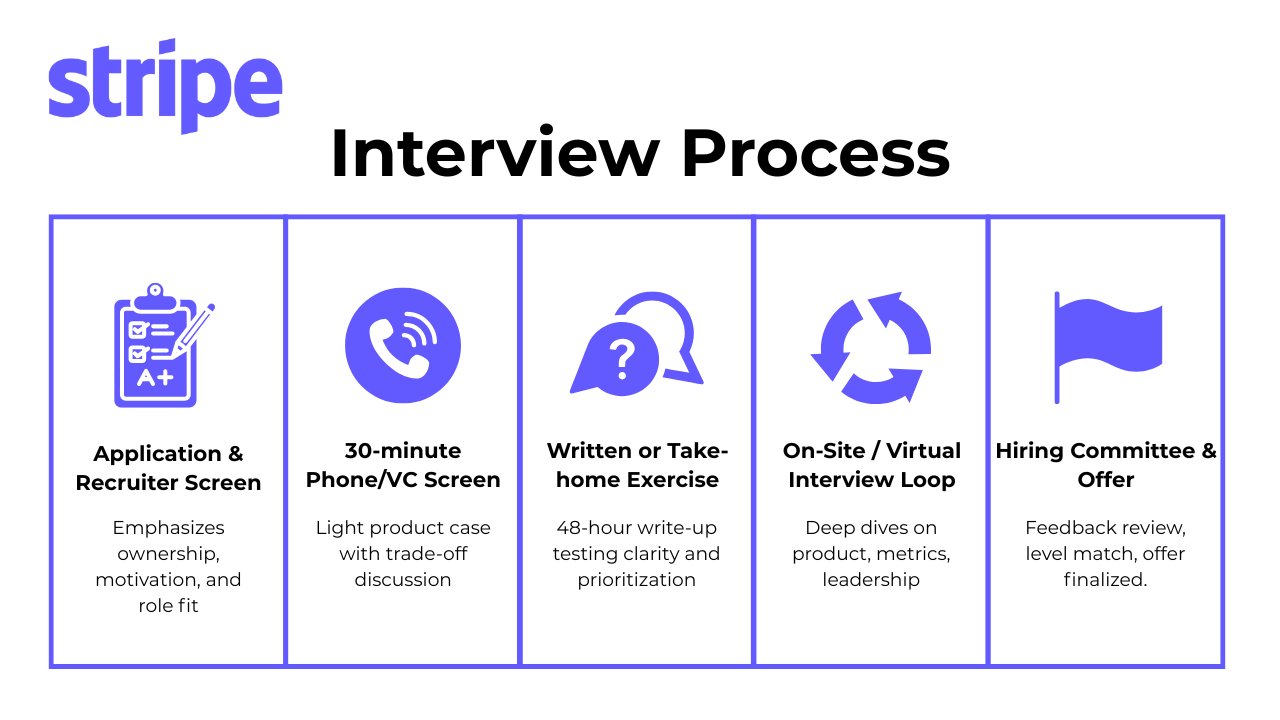
Stripe’s interview process is fast, structured, and designed to reveal how you think, not just what you know. Each stage assesses your ability to apply judgment, communicate clearly, and operate with the same rigor that defines Stripe’s culture. The process typically includes five stages: recruiter screen, take-home assignment, written exercise, final panel, and hiring review.
Recruiter Screen and Phone Call
This first stage helps Stripe understand who you are as a professional and how your experience connects to the role. Recruiters usually ask about your technical background, motivation for joining, and how you’ve handled past projects or challenges. Engineers may receive a short coding or debugging task, while product, analytics, and strategy candidates often discuss a specific project or metric they’ve owned.
Stripe uses this stage to evaluate clarity, curiosity, and communication skills. Candidates who show thoughtful alignment with Stripe’s mission and demonstrate structured thinking stand out early.
Tip: Before your call, read about one Stripe product, such as Connect, Terminal, or Financial Connections. Prepare one example of how your past experience could improve that product or address one of its challenges. It shows initiative and helps you make a strong first impression.
Take-Home Assignment
Stripe’s take-home assignments simulate real work to evaluate your ability to reason, write clearly, and make trade-offs under time constraints.
Example assignments:
- Engineering: Write a small program to process payments, handle edge cases, and document your approach with a short README.
- Data: Analyze a sample dataset of transactions and summarize your insights in two to three slides or a brief notebook report.
- Product/Strategy: Draft a short memo proposing how Stripe could improve adoption for a new feature or market.
The goal is to see whether you can approach open-ended problems methodically, communicate decisions clearly, and produce something practical rather than overly complex.
Tip: Keep your solution simple, structured, and well-documented. Stripe values clear thinking over perfection. Include one paragraph that explains your assumptions, what you prioritized, and what you would do next with more time.
Written Exercise (Select Roles)
For some product, operations, and strategy roles, Stripe includes a written exercise that tests how you communicate through writing. You might receive a short scenario asking you to outline a problem, analyze trade-offs, and recommend a solution in one to two pages.
This exercise helps Stripe evaluate how you think through ambiguity, use data to support decisions, and write in a style that others can easily follow.
Tip: Keep your writing concise and structured with clear headers and a short summary at the top. Stripe values documents that others can read quickly and understand without additional explanation.
Final Panel (Virtual or On-site Loop)
The final panel is a series of four to five interviews that assess your technical depth, collaboration skills, and ability to operate under Stripe’s principles of clarity and ownership. Each conversation explores a different side of how you work.
Technical or Case Round
You will solve problems related to your field, such as coding, SQL, or product logic. Interviewers assess your reasoning, how you test assumptions, and how clearly you explain trade-offs.
Tip: Talk through your thought process and explain why you’re making each choice. Even if your final answer is imperfect, clear reasoning leaves a strong impression.
Product or System Design Round
This round examines your ability to structure large, ambiguous problems. You may be asked to design an API, data model, or high-level product flow. The focus is on trade-offs, scalability, and user impact.
Tip: Outline your approach before diving into details. Use a simple framework like “inputs, process, outputs” or “user goals, data flow, risks” to stay organized.
Behavioral or Culture-fit Round
Here, interviewers explore how you collaborate, handle pressure, and make decisions. They look for examples of teamwork, adaptability, and clear documentation.
Tip: Use the STAR method (Situation, Task, Action, Result) and end with one reflection or lesson learned. Stripe values candidates who can self-assess and grow from experience.
Cross-functional or Stakeholder Round
For senior or cross-team roles, you may meet with partners from other departments. The goal is to test how well you communicate with peers who have different priorities.
Tip: Focus on listening first and aligning on objectives before proposing solutions. Stripe values engineers and analysts who can bridge perspectives across functions.
Hiring Committee and Offer
After the interviews, each interviewer submits written feedback about your technical ability, communication, and overall alignment with Stripe’s culture. A hiring committee then reviews the feedback together, calibrates your level, and ensures that standards remain consistent across teams.
If you pass the review, your recruiter will walk you through a detailed offer that includes base salary, equity, and performance-based bonuses. Compensation is level-dependent, but Stripe’s equity packages are typically competitive with other top-tier tech companies.
Negotiation advice:
- Do your research: Check compensation benchmarks on Levels.fyi or Blind to understand market ranges.
- Emphasize total value: Focus on the full package, including equity, bonus, and potential refresh cycles rather than just the base salary.
- Frame your ask strategically: Highlight the scope of the role or the business impact you can deliver to justify a higher offer.
- Be collaborative: Stripe’s recruiters value professionalism. Frame your negotiation around long-term contribution and career growth.
Tip: When discussing your offer, show appreciation for the opportunity and focus on building a partnership mindset. Stripe appreciates candidates who negotiate thoughtfully and respectfully.
Most common Stripe interview questions
Stripe interviews are designed to be challenging but fair. They test how deeply you can think, how clearly you can explain your reasoning, and how well you align with Stripe’s operating principles. In this section, we’ll walk through the most common categories of questions you should expect, from mission and values prompts to SQL, technical depth, and system design scenarios.
If you are preparing for a specific track, you can also dive into role-focused resources like the Stripe Software Engineer Interview Guide, Stripe Data Analyst Interview Guide, or Stripe Product Manager Interview Guide.
Mission & values questions
These are designed to see if you’ll thrive in Stripe’s async, ownership-driven environment. They often come up in the first recruiter screen or at the very end of the loop. The focus is less on “getting it right” and more on how you demonstrate rigor, long-term thinking, and empathy.
Tell us about a data project you owned. What hurdles did you clear?
Interviewers want to see end-to-end responsibility. Strong answers highlight how you unblocked teammates, made trade-offs, and measured real customer impact.
Sample answer: I led a project to consolidate fragmented payment data from multiple systems into a single analytics warehouse. The main hurdle was inconsistent schemas that broke downstream dashboards. I proposed a unified schema, built automated validation scripts, and wrote clear documentation so teams could onboard easily. The project reduced reconciliation time by 40% and became the basis for monthly revenue reporting. It taught me the importance of documenting early to prevent silent data drift.
How have you made complex data more accessible to non-engineers?
This is about communication. Good responses mention dashboards, documentation, and mentoring that helped others make decisions faster.
Sample answer: At my last company, non-technical teams struggled to interpret retention data buried in SQL scripts. I rebuilt our reporting stack in Looker with business-friendly field names and wrote a short ‘How to Read Retention’ guide. I also hosted a 30-minute demo showing how to use filters and explore the data. Within a month, 70% of recurring ad-hoc requests disappeared, freeing engineering hours for product work. It reinforced how clarity and accessibility multiply the impact of analytics.
What would your manager list as your top strength and a growth area?
Honesty and self-awareness are key here. Stripe looks for candidates who seek feedback and continuously improve.
Sample answer: My manager would say my biggest strength is analytical rigor—I validate assumptions before coding and make sure dashboards tie back to business goals. For example, I built automated QA checks for key metrics, which prevented incorrect reporting during a product launch. A growth area is speed in ambiguous situations. I used to over-refine before sharing drafts, but now I circulate early iterations to gather feedback sooner. It’s made my work faster and more collaborative.
Describe a time stakeholder communication broke down. How did you fix it?
This tests empathy and clarity. Strong answers include documenting agreements, running recap sessions, and iterating until teams had a shared model.
Sample answer: During a fraud detection rollout, analytics and engineering disagreed on the definition of a ‘flagged transaction,’ causing misaligned dashboards. I paused deployment and scheduled a short sync to rebuild a shared definition document that everyone signed off on. I then added metric definitions directly into our dashboard tool so they were visible to all users. The fix improved alignment immediately and reduced reporting conflicts by 90%. The key takeaway was that shared language prevents downstream confusion.
Why Stripe, and how does the mission resonate with your goals?
Stripe wants to see that you buy into its mission to expand the GDP of the internet. This is where you connect your personal story to Stripe’s global ambition.
Sample answer: I’ve always been fascinated by how infrastructure can unlock opportunity. Early in my career, I helped small online sellers set up payment gateways, and I saw firsthand how access to reliable tools changed their reach. Stripe’s mission to expand the GDP of the internet captures that idea perfectly. I want to contribute to building systems that make entrepreneurship borderless and frictionless, and Stripe’s culture of rigor and ownership is exactly the kind of environment where I can do my best work.
Tip: Keep answers concise and written-culture friendly. Use STAR, but spend most of your time on Action and Result, then add one sentence on what you changed going forward (your learning loop). Prioritize stories that show ownership under ambiguity, clear documentation (design docs, PRDs, post-mortems), and measurable impact. Name the trade-offs you faced and how you aligned stakeholders asynchronously—very Stripe.
Technical depth prompts
Engineers and data candidates almost always face coding or problem-solving exercises that test efficiency, trade-offs, and clarity. The goal is not just to produce a working answer, but to show that you can reason through edge cases and explain your approach clearly.
Implement full-text justification with even space distribution.
This is a common algorithm problem where you scan words line by line, calculate spaces, and balance them across the row. Strong candidates explain time complexity, handle single-word lines, and show how they think about formatting edge cases. During the interview, you don’t need a perfect implementation, but walking through an approach like this shows you can balance correctness, readability, and real-world trade-offs.
Compute a three-day rolling average of deposits in SQL
This checks your understanding of window functions. A strong answer partitions by user, orders by date, and frames with
ROWS BETWEEN 2 PRECEDING AND CURRENT ROW. Interviewers also expect you to explain why this avoids costly self-joins and how indexing keeps queries efficient.Return retention by monthly cohort for the first three renewal periods.
This is about cohort survival analysis. Good answers show how to bucket by start month, flag renewals with a
CASEstatement, and chain CTEs to keep the query readable. Bonus points if you explain why precomputing cohorts upstream reduces complexity.Detect ATM withdrawals that occur in exact 10-second gaps with no intervening transactions.
This is a fraud detection-style problem. The typical solution uses a self-join on
user_id, compares timestamps withTIMESTAMPDIFF, and wraps it with aNOT EXISTSclause to ensure no valid rows sit in between. The key is explaining how you avoid false positives.Design a
justify()unit-test suite that traps off-by-one errors.Testing questions are about completeness. Candidates usually mention table-driven tests that cover empty input, exact-width lines, and uneven space distributions. Bringing up CI integration or fuzzing Unicode edge cases shows you’re thinking beyond the basics.
Tip: Think like a production engineer. Say your plan before coding, implement in small testable steps, and narrate edge cases as you go. After presenting a solution, explain time/space complexity, failure modes, and one improvement you’d make for readability, observability, or performance at scale (e.g., indexing, batching, idempotency). Clarity > cleverness.
SQL & data scenarios
If you’re interviewing for a data role—or even product—expect to tackle real-world data sets and metrics. Stripe SQL interview questions might ask you to join tables related to payments, customers, or charges. Optimization follow-ups are common, as well as questions that ask you to interpret results or suggest business decisions. Practicing Stripe SQL logic with a realistic schema is key here.
Return each day’s final bank transaction (ID, timestamp, amount).
This checks whether you know how to partition by date, order transactions correctly, and handle ties. A solid answer explains the use of
ROW_NUMBER()orRANK()with proper ordering, then filters to the last transaction of the day.Calculate a three-day rolling average of positive transaction values
This is a classic window function problem. The interviewer wants to see that you know how to use frames instead of self-joins, and that you can justify why this scales better in production. Explaining why you grouped by
DATE(created_at)upfront and how window frames avoid re-scanning rows will show the interviewer that you’re thinking about both correctness and performance.Build month-by-month cohort retention for every plan ID.
This focuses on cohort bucketing and survival analysis. Strong answers use a clean chain of CTEs, calculate start cohorts with simple date math, and highlight how to handle NULLs and churned users.
Compute annual retention for a once-per-year SaaS payment table.
Checks This tests whether you can adapt cohort logic to yearly subscriptions. Good answers explain how you’d identify renewals, join across periods, and account for edge cases like leap years or missing payments. joins, renewal detection, and edge-case reasoning.
Identify fraudulent 10-second-gap withdrawals without legitimate rows in between.
This is another fraud analytics example. The solution usually involves self-joining on
user_id, comparing timestamps with a 10-second difference, and confirming viaNOT EXISTSthat no other rows fall in between. The emphasis is on showing how you avoid both false positives and missed cases.
Tip: Structure queries for readability first (CTEs, clear aliases), then discuss performance (partitions, clustering, window frames vs. self-joins). Validate with quick sanity checks (row counts, distinct keys, edge dates, NULL handling) and tie the output to a decision a PM/finance partner would make. Mention how you’d productionize: data contracts, quality checks, and monitoring.
System Design Scenarios
System design questions are common for senior engineers, backend developers, and data platform candidates. The goal is to test whether you can design for scale, reliability, and compliance while still keeping the user in mind.
Architect the back-end schema for Swipe Payment API keys, webhooks, and transactions.
This question tests how you handle security and compliance. A strong answer explains encryption, audit logging, and PCI implications, alongside how you’d shard to prevent bottlenecks.
Model historical customer addresses while preserving move-in/move-out timelines.
This is about working with slowly-changing dimensions. Good candidates explain surrogate keys, insert-versus-update trade-offs, and how to query for “as of” timelines.
Design a real-time sales leaderboard for thousands of fast-food branches.
Here, you need to balance freshness with efficiency. An effective solution might use streaming ingestion, Redis, or materialized views, and API endpoints for sub-second dashboards.
Create a star-schema data warehouse for an online retailer.
This tests fundamentals in analytics engineering. A clear answer defines fact and dimension tables, explains partition keys, and shows how you’d run CDC-based incremental loads.
Build a Yelp-style review system supporting text, images, and one-review-per-pair constraints.
This is about combining relational constraints with user experience. Strong answers explain composite primary keys, S3 storage with signed URLs, and a moderation queue to handle unsafe content.
Tip: Start broad, then drill down. State requirements and constraints, list assumptions, and outline an inputs → processing → storage/serving → observability flow. Discuss explicit trade-offs (consistency vs. latency, cost vs. throughput), call out reliability tools (queues, retries, idempotency keys, backpressure), and finish with ops: metrics, alerts, dashboards, rollout/rollback, and data retention/compliance.
For a deeper dive into system design, check out our Stripe Software Engineer Interview Guide, which breaks down the most common architecture and backend challenges Stripe candidates face.
Watch Stripe engineers in action
To see how Stripe builds and scales systems in real life, watch this Stripe Sessions talk: Financial infrastructure to grow the GDP of the internet. It offers insight into architectural trade-offs, reliability, and what real-Stripe engineers face on the job.
Tips when preparing for a Stripe interview
Preparing for Stripe means going beyond practicing questions; it’s about learning to think and communicate with the same clarity and rigor Stripe values internally. The following strategies will help you approach each round with structure, confidence, and an understanding of how Stripe evaluates candidates.
Review Stripe’s Documentation and Launches
Stripe expects candidates to understand its ecosystem at a product and technical level. Before your interview, spend time reading the API reference and browsing recent posts on the Stripe engineering blog. This will help you speak fluently about real product challenges such as payment reliability, API versioning, or global expansion.
Tip: Pick one product or feature that interests you, for example, Stripe Atlas or Billing, and think about how you would measure its success or improve it. Using a specific example makes your answers stand out and shows that you’ve done your homework.
Simulate a Take-home Assignment
Stripe’s assignments are designed to mirror real work, where clarity and reasoning matter more than polish. Time yourself for one to three hours and practice writing code, SQL, or a short memo that explains your decisions. The ability to communicate your assumptions is often more important than achieving a perfect technical solution.
Tip: After finishing, review your work from a reviewer’s perspective. Ask: “Would a teammate understand my logic without extra context?” Practice documenting trade-offs and next steps to build the Stripe-style habit of written clarity.
Drill with a Peer or Mentor
Mock interviews help you spot blind spots that solo practice misses. Pair up with a friend or coach who can challenge your assumptions, ask clarifying questions, and simulate real interview pacing. Practicing out loud improves how you structure your reasoning, a skill Stripe interviewers actively assess.
Tip: Record one of your mock sessions and listen back. Pay attention to filler words, unclear explanations, or over-complicated logic. Refining these areas can make your delivery sharper and more confident.
Rehearse System Design and Product Thinking
Stripe interviewers love structured thinking and pragmatic design. Whether you are designing a data pipeline or an API for developers, they want to see how you balance scalability, user needs, and engineering simplicity.
Tip: Start every design question by outlining goals and constraints before diving into solutions. Use frameworks like “users, data, systems, failure modes” to keep your thinking organized. Practicing this method will make your answers sound more intentional and Stripe-like.
Strengthen Your Coding and SQL Foundations
Stripe’s coding and data rounds focus on problem-solving with real-world constraints. Practice LeetCode medium-level problems for algorithms, and Stripe-style SQL challenges that require window functions, cohort logic, and edge-case handling.
Tip: As you practice, explain your reasoning out loud. Stripe’s interviewers care about how you arrive at a solution, not just the syntax. Pair correctness with clarity — both are equally weighted in evaluation.
Build Story-Driven Behavioral Examples
Behavioral interviews at Stripe assess ownership, communication, and resilience. Prepare three to four STAR (Situation, Task, Action, Result) stories that showcase how you delivered impact, fixed a failure, or drove alignment across teams.
Tip: After each story, add one line reflecting on what you learned. This shows humility and growth — two qualities Stripe values highly in every hire.
Learn from Feedback and Iterate
Stripe values continuous improvement. After every practice session, review what worked, what didn’t, and how you can refine your next attempt. This habit not only improves performance but also mirrors the iteration Stripe expects from its engineers and analysts.
Tip: Use a prep tracker or feedback log to capture notes after each round of practice. Over time, you’ll spot patterns in your performance and see measurable improvement.
Salaries at Stripe
Most data roles at Stripe fall under different titles such as Data Analyst, Data Scientist, Machine Learning Engineer, and Software Engineer, but all share the same goal: powering Stripe’s payment intelligence and infrastructure at scale.
Average Base Salary
Average Total Compensation
From recent data, Machine Learning Engineers consistently command the highest pay, averaging around US$405,000 in total annual compensation, while Data Analysts sit on the lower but still impressive end at about US$238,000. Stripe’s compensation packages are equity heavy, rewarding impact and long-term ownership more than short-term bonuses.
- Software Engineer (SWE): Base salary ranges from US$190K to US$300K, with total compensation typically between US$250K and US$930K or more (Levels.fyi). Packages combine a strong base, annual performance bonuses, and significant equity. Senior engineers in San Francisco can cross US$500K when stock refreshers are factored in.
- Data Analyst (DA): Base salary is around US$158K, with total compensation of about US$238K or US$19.8K per month (Levels.fyi). This includes a balanced package of base pay, a US$24K annual bonus, and roughly US$56K in stock. Analysts in San Francisco and Seattle tend to earn more due to cost-of-living adjustments and their roles’ cross-functional impact.
- Data Scientist (DS): Average base pay is around US$178K, with total compensation of US$380K, ranging from US$249K to US$447K (Levels.fyi). Mid-level data scientists typically make in the mid-US$300Ks, while senior roles exceed US$400K once stock refreshes are included. Stripe places heavy emphasis on equity for data scientists whose work contributes to product and revenue optimization.
- Machine Learning Engineer (MLE): Base salary ranges from US$200K to US$318K, with total compensation averaging US$405K per year (Levels.fyi). At the staff level (L4 and above), monthly earnings can surpass US$60K due to large equity packages and long-term incentives. Those who deploy scalable models across payments, fraud prevention, and infrastructure optimization see the largest rewards.
- Product Manager (PM): Base salaries range from US$200K to US$320K, with total compensation from US$250K to over US$550K depending on level and product scope (Levels.fyi, Glassdoor). Senior PMs receive larger equity packages tied to strategic launches and product ownership.
Key Insight: Stripe’s pay philosophy centers on impact and ownership. Employees who build or scale systems that enhance payment reliability, fraud detection, or global reach benefit the most from stock growth. Across roles, long-term vesting and equity refreshers drive real wealth creation, making Stripe one of the most lucrative fintech employers for top technical talent.
FAQs
How long does the Stripe interview process take?
Most candidates move from the recruiter screen to a final offer in about three to five weeks, though timing depends on role and interviewer availability. Stripe aims for fast feedback, and you usually hear back within a few days after each stage.
Is the Stripe interview hard?
Yes, Stripe is considered one of the tougher interview processes in tech. The bar is high for technical skills, problem-solving, and cultural alignment. With focused prep on SQL, system design, and behavioral answers, candidates can make the process much more manageable.
What SQL questions are asked in Stripe interviews?
Expect realistic data scenarios tied to payments, users, and transactions. Common tasks include calculating rolling averages, building retention cohorts, and detecting anomalies. You can practice with our Stripe SQL interview questions to see detailed solutions.
Does every role include a take-home assignment?
Not all roles, but most engineering, analytics, and strategy candidates receive one. Assignments are short (one to three hours) and designed to mimic real Stripe work. Deliverables often include code plus documentation, or a short memo in product and strategy cases.
What skills are needed to succeed at Stripe?
Beyond technical depth, Stripe values rigorous thinking, clear writing, and ownership. Candidates who succeed tend to show that they can explain complex ideas simply, make thoughtful trade-offs, and align their decisions with Stripe’s principles like “users first.”
Ready to Start Your Stripe Interview Prep?
Stripe sets a high bar, but the rewards match the challenge. By practicing real questions, sharpening your communication, and preparing with Stripe’s principles in mind, you can walk into every round with confidence.
The best next step is to get hands-on practice with tools that mirror the real interview experience.
To get even sharper, check out these resources from Interview Query:
- Mock Interviews with Stripe Alums to rehearse under realistic conditions.
- AI-Powered Interview Practice to get instant feedback and track progress.
- Learning Paths for Technical Interviews to follow structured prep based on your role.
- Success Story: Jeffrey Li to see how another candidate used Interview Query to land his next opportunity.
Ready to dive deeper?
Explore role-specific guides tailored to your path:
Discussion & Interview Experiences