
Shopify Business Analyst Interview Guide (2025)


Introduction
In 2024 alone, Shopify processed over USD 235 billion in GMV and supported more than 2 million active merchants worldwide, numbers that continue to grow as the company expands into payments, fulfillment, and AI-driven commerce tools. Behind those metrics are business analysts who turn billions of data points into the insights that power Shopify’s next moves.
If you’re preparing for a Shopify Business Analyst interview, you’re entering one of the most data-mature environments in global commerce. Analysts here don’t just crunch numbers; they shape product strategy, optimize pricing, and surface the signals that guide billion-dollar decisions.
This comprehensive guide will walk you through every stage of the interview process, from recruiter screens and SQL challenges to case presentations and behavioral interviews. You’ll find:
- The skills and tools Shopify prioritizes (SQL, Looker, Python notebooks, data storytelling).
- The types of questions you can expect, including real analytics and business-case examples.
- The mindset and preparation framework that top candidates use to stand out.
By the end, you’ll know exactly how to connect your analytical skills to Shopify’s mission of making commerce better for everyone, and walk into your interviews confident, structured, and ready to make an impact.
Role overview and culture
A Shopify business analyst partners with product, data science, and finance teams to uncover insights from merchant behavior, payment flows, and conversion data. These insights help shape product roadmaps, refine feature launches, and improve the merchant experience at scale.
Shopify’s digital-by-default model empowers analysts with high ownership in asynchronous teams. Analysts often work in autonomous squads, where clarity of thought and effective communication through data matter more than polished presentations.
Why this role at Shopify?
Few analyst roles offer the scale, ownership, and career potential that Shopify provides. Business analysts at Shopify sit at the intersection of data, product, and strategy, shaping how millions of merchants grow across global markets. The company’s open data culture and advanced analytics stack allow analysts to work directly on problems that influence key business metrics such as conversion, retention, and merchant lifetime value.
The career trajectory for a business analyst at Shopify is both flexible and rewarding. Analysts who master data storytelling and business influence often transition into senior analytics leadership, product analytics, or even product management roles. Many experienced analysts evolve into product data leads or strategy managers, working alongside PMs to define roadmap priorities and design experiments that improve merchant outcomes.
Shopify also invests heavily in learning and internal mobility. Analysts are encouraged to move between product areas such as checkout, payments, or logistics, building a broad view of the commerce ecosystem. This exposure helps develop the skills needed to lead cross-functional initiatives or step into analytics-driven product ownership positions.
If you are looking for a role where your insights directly influence how global merchants operate, this is an ideal opportunity. Shopify’s analyst community values curiosity, precision, and impact, rewarding those who combine technical fluency with business clarity and a desire to grow into broader strategic roles over time.
What is the interview process like for a business analyst role at Shopify?
The Shopify business analyst interview process is designed to evaluate how you think, structure problems, and communicate insights with clarity. It focuses on technical skill, business reasoning, and alignment with Shopify’s data-driven yet independent culture. Most candidates move through the process in three to five weeks, though timelines can vary by role and location.
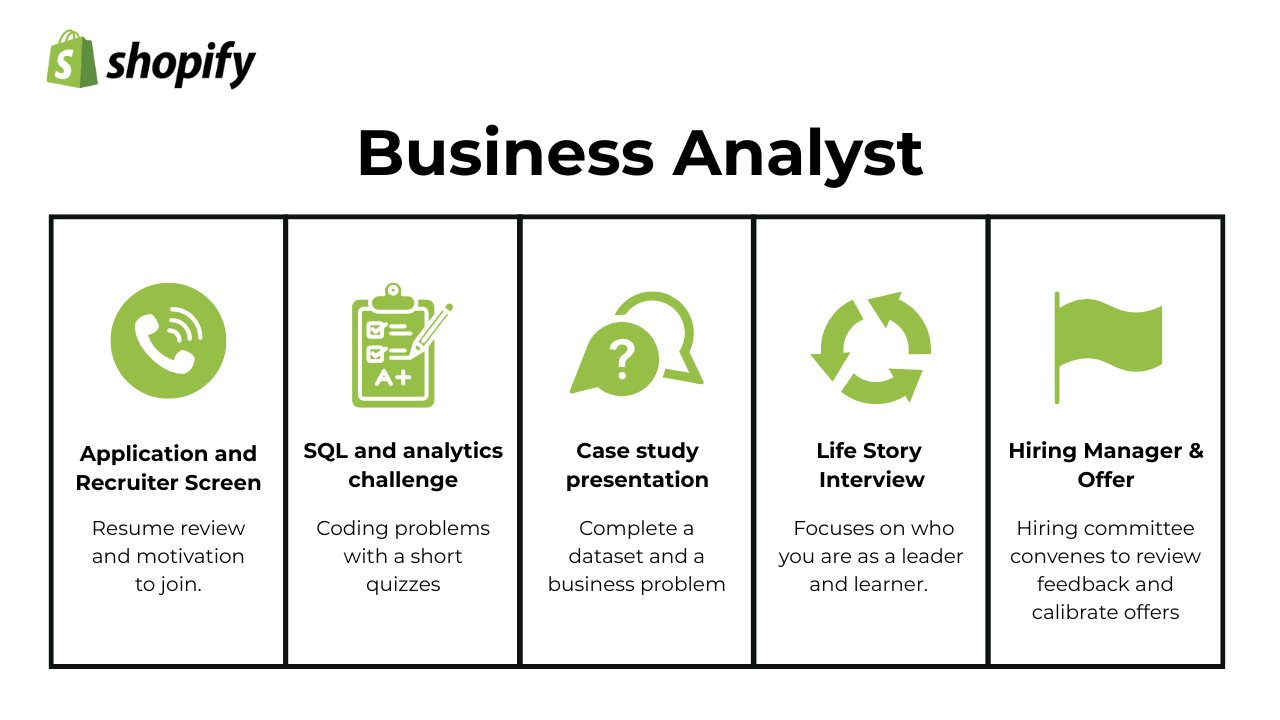
Application and recruiter screen
The process begins with a 30-minute recruiter conversation that typically happens one to two weeks after submitting your application. This stage helps Shopify understand your motivations, your experience with SQL and analytics tools, and how well your background aligns with the company’s mission to make commerce better for everyone.
Recruiters look for candidates who communicate clearly, show curiosity about Shopify’s ecosystem, and demonstrate the ability to think independently. Ideal candidates balance technical fluency with strong business awareness and a merchant-first mindset.
Tip: Treat this as a mini storytelling round. Prepare a short example of an analysis you led that created measurable business impact, such as “helped increase conversion by 10 percent through checkout funnel insights.”
SQL and analytics challenge
If the recruiter screen goes well, you’ll receive a timed SQL and analytics challenge within one to two weeks. This test typically lasts 45 to 60 minutes and includes two to three questions involving filtering, aggregation, and time-window logic. You may also be asked to explain your query or interpret its output.
This stage evaluates your ability to write clean, efficient queries and reason through ambiguous prompts. The best candidates think aloud, explain their assumptions, and write queries that are both correct and readable. Shopify looks for analytical precision and strong data intuition rather than complex syntax for its own sake.
Tip: Before the test, practice writing queries under time constraints and focus on clarity over cleverness. Be ready to discuss trade-offs, such as why you used a CTE instead of nested subqueries.
Case study presentation
The case study is often the heart of the process and takes about a week to complete. You’ll receive a dataset and a business problem, and you’ll be asked to analyze it and present your findings in a short live session, usually lasting 30 to 45 minutes, including discussion.
Shopify uses this round to assess your ability to connect data to decisions. Interviewers look for candidates who can uncover patterns, prioritize insights, and make recommendations that directly support merchant growth or operational efficiency. Ideal candidates present structured narratives that link what they found, why it matters, and what actions they recommend.
Tip: Use a simple three-part structure in your presentation: insight, implication, and action. Keep visuals focused and easy to read, and use numbers to tell a story rather than overwhelm the listener.
Life story behavioral interview
This round often happens within a week of your case study and focuses on how you think, grow, and collaborate. The conversation dives into two or three defining career moments, exploring how you approached challenges and learned from them.
Shopify uses this stage to evaluate self-awareness, reflection, and alignment with its values such as “Act like an owner” and “Thrive on change.” Interviewers want to see authenticity and a sense of purpose in how you describe your journey. Strong candidates use real experiences to demonstrate adaptability, curiosity, and a clear connection between data and business outcomes.
Tip: Choose two stories that showcase ownership and impact. Focus on what you learned, not just what you achieved, and connect your decisions back to results that mattered to the team or customers.
Offer and compensation call
If you advance to this stage, you’ll typically hear back within a few days after the final interview. During the call, Shopify confirms your role level (such as Analyst or Senior Analyst), compensation details, and start date. The recruiter will also discuss equity, benefits, and growth opportunities within the company.
Shopify uses this final step to ensure alignment on expectations and enthusiasm for the role. The strongest candidates approach this conversation professionally, asking thoughtful questions about career paths, mentorship, and performance metrics.
Tip: Research compensation benchmarks for similar roles and prepare to discuss your expectations confidently. Frame negotiation around total value, including equity and growth potential. Express enthusiasm first, then share your considerations for adjustment in a collaborative way.
Challenge
Check your skills...
How prepared are you for working as a Business Analyst at Shopify?
What questions are asked in a Shopify business analyst interview?
Shopify’s interviews test for more than technical execution—they want analysts who can influence strategy, challenge assumptions, and thrive in async environments.
SQL/Technical Analytics Questions
Candidates are often asked to join multiple datasets, apply window functions, or build retention cohorts. You may analyze user behavior or funnel drop-off rates. Evaluation focuses on correctness, speed, and your ability to explain query logic.
-
This question evaluates your ability to sequence customer events and apply precise business logic using window functions. You’ll need to identify each customer’s first purchase date, then determine whether they made additional purchases on later dates — excluding same-day transactions since these don’t qualify as upsells. The key steps involve ranking or finding the minimum purchase date per customer, filtering for subsequent purchases, and counting distinct customers who meet that condition. In practice, you’d also clarify business nuances like whether to exclude refunded or zero-value promotional orders, and how to handle time zone differences across transaction timestamps.
Total item spend by users who registered in 2022.
Join
userstopurchases, filterregistration_dateto 2022, and aggregate spend byitem_id(or item name/SKU) withSUM(price * quantity)if available. Clarify whether to exclude refunds, taxes, and shipping; confirm currency normalization if multi-currency exists. Interviewers want to see clean join filters, correct time predicates, and awareness of finance nuances.Top five product pairs most frequently purchased together (with names).
Perform market-basket co-occurrence: within each order, generate unordered pairs of distinct products, canonicalize the pair (e.g., alphabetical
p2 < p1), count occurrences across all orders, and sort by frequency to return the top five. Join toproductsto show readable names and respect the prompt’s “alphabetical second item” constraint. Discuss scale tactics (Spark, BigQuery, approximate counting, or sampling) for billion-rowtransactions, and mention exclusions (e.g., kit bundles counted once).Determine if a string is a palindrome.
Normalize input (lowercase, optional removal of non-alphanumerics) and compare the string to its reverse or two-pointer from both ends—O(n) time, O(1) extra space. Clarify spec: Should “A man, a plan…” count? How to handle Unicode, emojis, or accented characters? Although simple, this screens for clear assumptions, edge-case thinking, and crisp communication—useful for writing robust data transforms and validations.
Maximize total value of items placed in a fixed-capacity bag (0/1 knapsack).
Frame this as choosing a subset of items (each with
valueandcapacity) to maximize total value without exceedingbag_capacity. The optimal solution uses dynamic programming (O(n·capacity)), while greedy value-density is only optimal for fractional knapsack (not allowed here). For large capacities, discuss memory trade-offs (1D DP), pruning, or approximation. Map the concept to BA work: budget allocation across marketing channels or promo slots under a spend cap.
Tip: Treat each prompt like production analytics: state assumptions first, then write readable SQL (CTEs, clear aliases) before you optimize. Narrate why you chose a join, filter, or window frame; validate with quick sanity checks (row counts, distinct keys, edge dates, NULL handling). Close by tying the query’s output to a decision (e.g., which cohort to target, which funnel step to fix). If asked about scale, mention partitions/clustering, incremental models, or pre-aggregations, not just indexes.
Case Study & Data Storytelling Questions
These questions test how well you connect metrics to product decisions. Examples include designing KPIs, diagnosing revenue drops, or presenting test results. Successful candidates structure their findings, annotate visuals, and link insights directly to business outcomes.
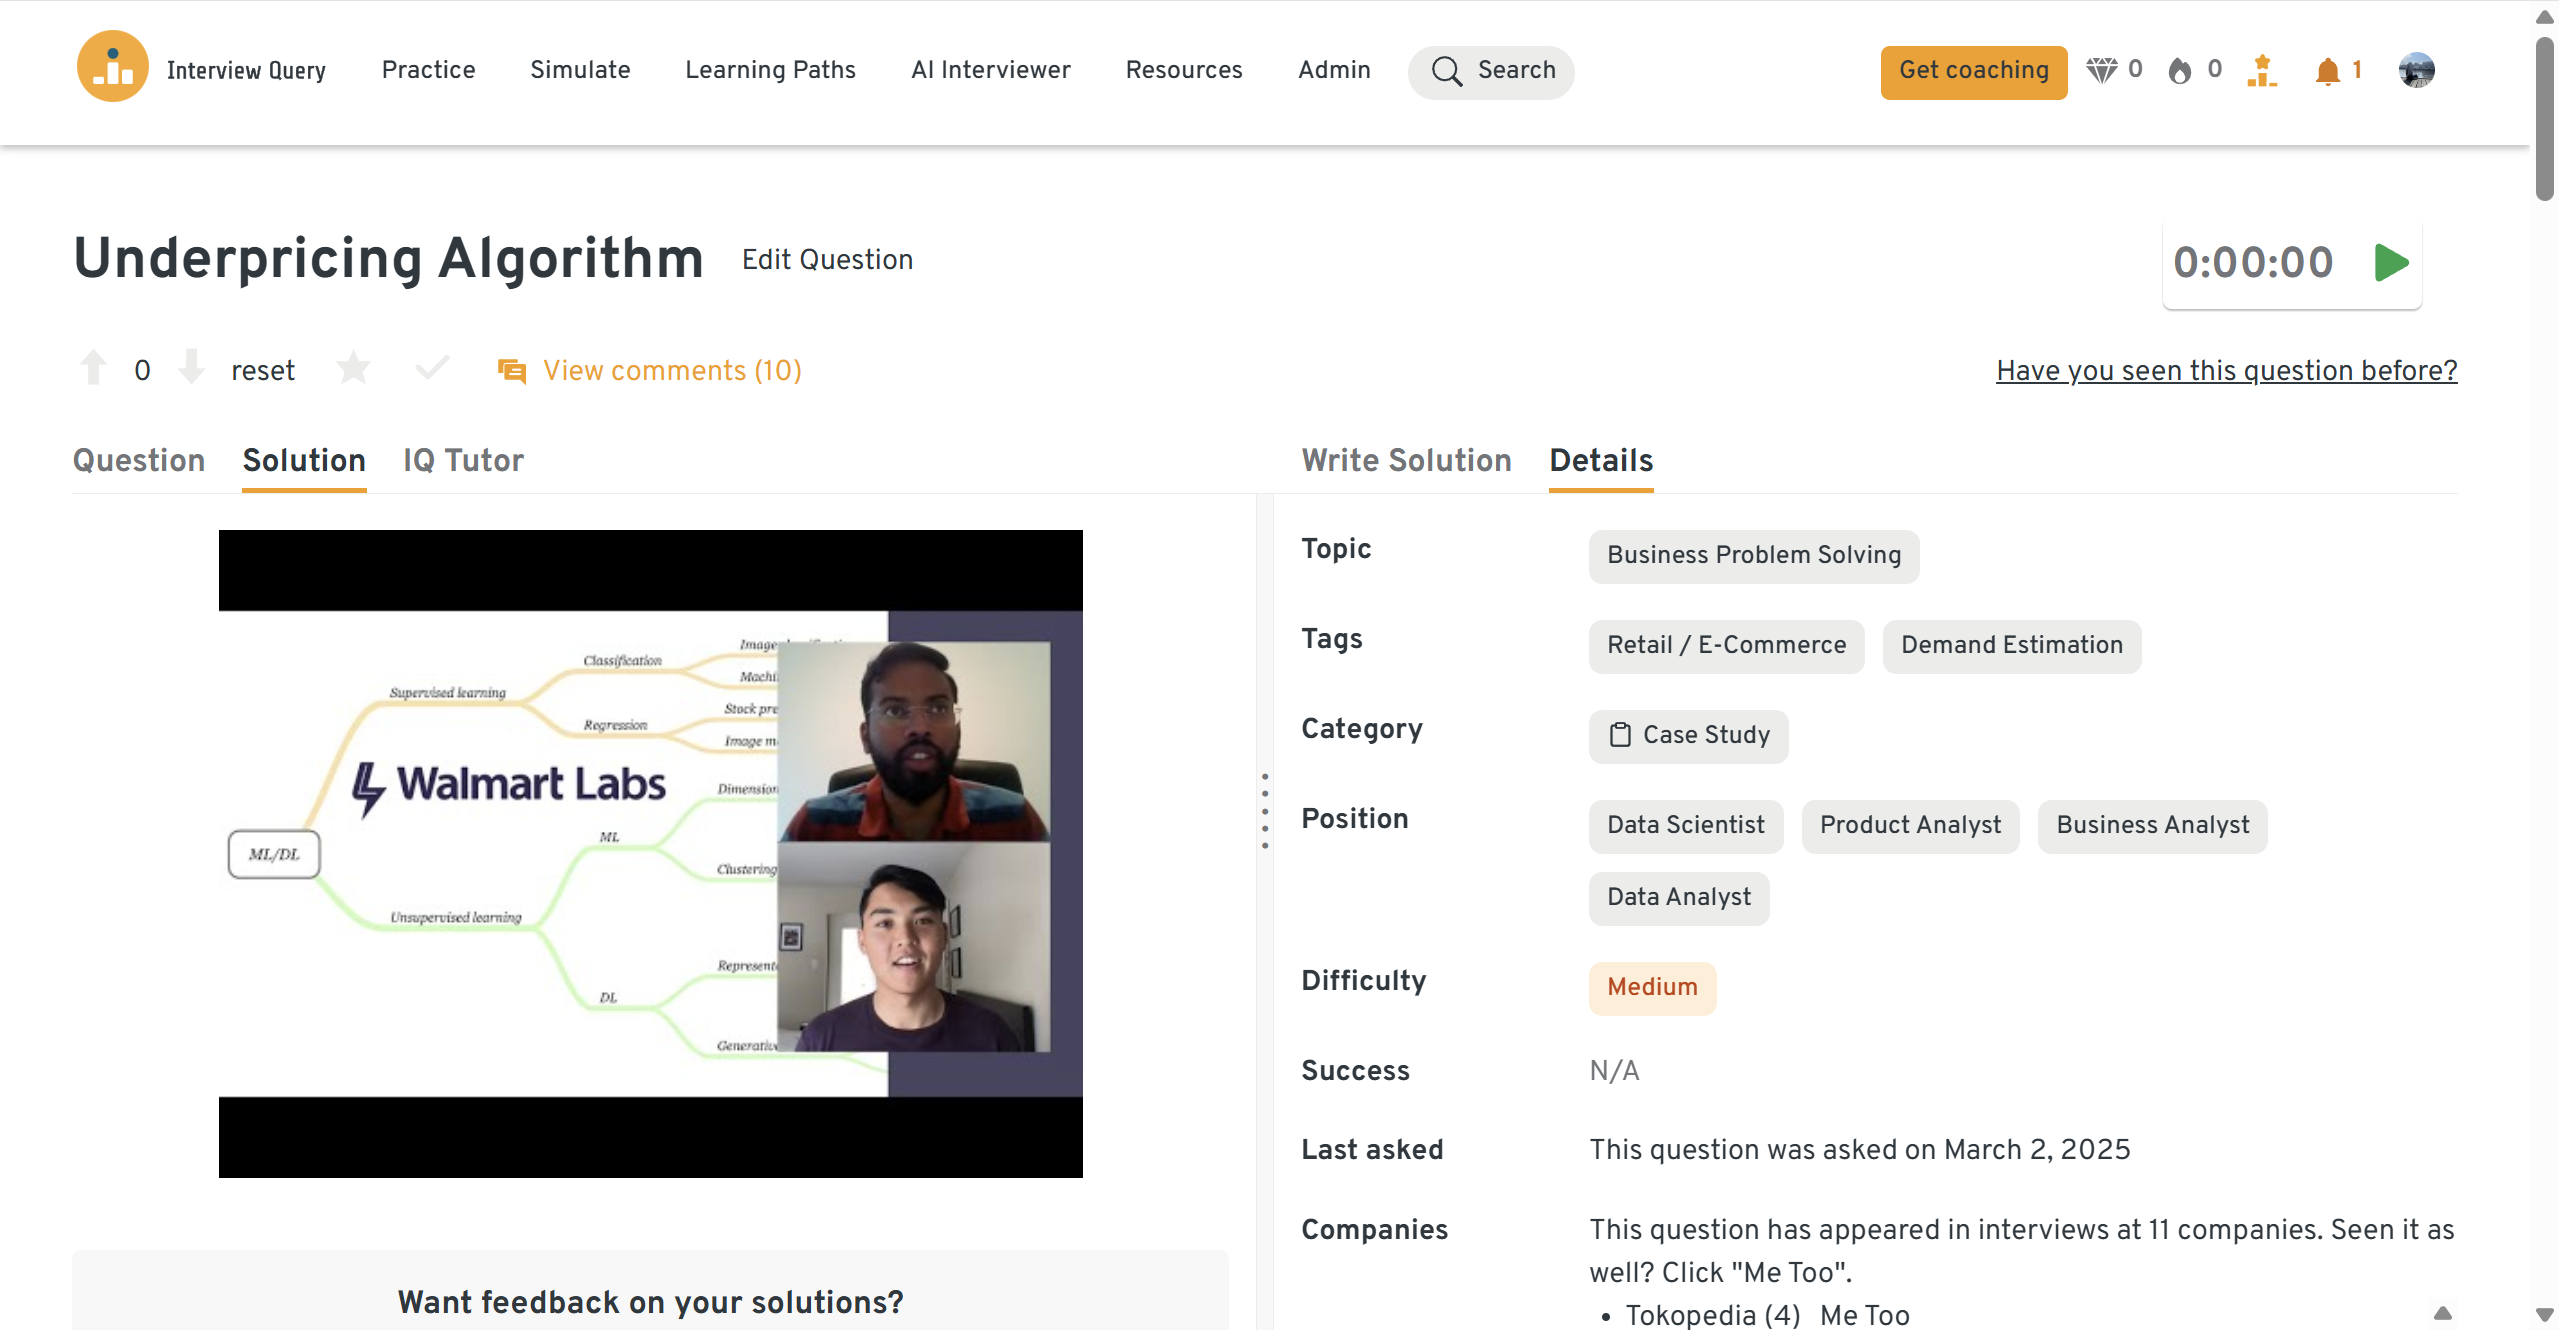
Diagnose why a pricing model is undervaluing a product.
Start by reproducing the price for specific SKUs end-to-end (inputs → feature transforms → model/scoring → business rules). Check data quality (missing/lagged inventory, unit mismatches, stale demand signals, wrong logistics zones), feature scaling/normalization, and recent code or dependency changes. Examine model drift (feature distributions vs. training), elasticity assumptions, and guardrails (min price, cost floors, MAP).
Compare predicted vs. realized margins and competitive benchmarks. Triage fast with a rule-based floor; then fix root causes (refresh features, retrain, adjust constraints), and add monitors (anomaly alerts, canary SKUs, shadow prices).
Cashflow Interest Projection — 90 days at 6% vs. 45 days at 3% fee. Which do you choose?
Both options imply roughly the same annualized cost (~6%/90d ≈ 24% APR; 3%/45d ≈ 24% APR). With equal APRs, decide based on cash-flow strategy: if runway is tight or you can earn positive returns on working capital, prefer the 90-day deferral to hold cash longer; if liquidity is ample and you value lower absolute fees or vendor relationship terms (credit limits, penalties, dispute windows), choose 45 days. Make the call with an NPV comparison using your internal cost of capital and expected reinvestment returns.
Investigate 12 months of falling revenue.
Decompose revenue into drivers (visitors → conversion → orders/user → AOV), then run a waterfall to quantify each component’s contribution. Segment by channel, geo, device, customer cohort, and category mix to detect shifts. Check supply (OOS rates, delivery SLAs), pricing/promotions, refunds/chargebacks, and policy changes. Validate tracking (attribution or tax/shipping inclusion) and seasonality. Close with hypotheses prioritized by impact × confidence, quick diagnostic queries, and a test/roll-back plan.
POS Subscription Retention — compare one-time sale vs. subscription model.
Build a cash-flow model over a six-year horizon: upfront $5,000 sale (with $2,500 margin) vs. $300 month-1 + $100 monthly thereafter. Use retention/churn assumptions to compute expected CLV (discounted) and payback time; create sensitivity tables on churn, discount rate, and price points. Consider upgrade/cross-sell options, contract terms, and revenue recognition. Recommend thresholds (e.g., subscription wins if 12-month retention ≥ X%) and a phased rollout with cohort tracking.
Should we blast all customers to close a 10% quarter gap?
Caution against a blanket blast due to deliverability risk, unsubscribes, and low incremental lift. Propose a segmented approach: target high-propensity audiences with tailored offers, set holdouts for uplift measurement, cap frequency to avoid fatigue, and coordinate across channels (paid/onsite). Model expected incremental revenue vs. LTV harm and prioritize higher-ROI levers (reactivation flows, cart-abandon, account-based outreach) before mass sends.
You’ve analyzed cohort retention and found AOV up but orders/user down. Build a single slide for execs.
Craft a clear headline (“Revenue flat, mix shift hides order frequency decline”), a simple visual (cohort heatmap + mini waterfall), and a crisp call-to-action (e.g., test reorder nudges for cohorts showing week-6 drop-off). Emphasize clarity over jargon and tie insights to owner/next steps.
Recommend a 4% price increase on accessories without hurting conversion.
Frame the ‘why’ (elasticity estimate, margin headroom), the ‘what’ (SKU scope, guardrails, exclusions), and the ‘how’ (A/B ramp, KPI guardrails like CVR/NPS/returns). Use an intuitive chart (price vs. demand curve) and a risk plan (rollback triggers). Translate model confidence into business risk language, not coefficients.
Tip: Anchor on Insight → Implication → Action. Lead with one headline finding, quantify its impact, and propose the smallest high-leverage next step (experiment, rollout, or dashboard alert). Keep visuals simple (one chart per idea), label axes in business terms, and surface trade-offs/assumptions. End with a short risks & follow-ups box (data quality, seasonality, edge cohorts) to signal maturity—and always map recommendations to an owner and timeline.
Behavioral & culture Fit Questions
Shopify emphasizes cultural alignment. Expect prompts about delivering work asynchronously, making trade-offs with limited data, or collaborating across teams. Use examples that reflect Shopify’s values, including build for the long term, thrive on change, and be merchant-obsessed.
-
Use STAR. Set the context (problem, stakeholders, tools), name the toughest blockers (dirty data, shifting requirements, limited tracking), and how you unblocked them (clear metric definitions, data contracts, backfills, proxy metrics, stakeholder alignment). Close with quantified impact and one lesson you’d reuse at Shopify.
Sample answer: At my previous company, I led an analysis to improve our checkout conversion funnel. The challenge was that our tracking had inconsistent session definitions between the marketing and product teams, which made conversion rates unreliable. I first mapped the event discrepancies, proposed a unified metric definition, and built a new funnel dataset with validated joins across tables. Once we had a clean view, we discovered that most drop-offs occurred at the payment stage on mobile. Partnering with engineering, we implemented an in-app wallet integration that increased mobile conversions by 9 percent in the following quarter. The main lesson I took from this was the importance of aligning metric definitions early, a principle I’d carry to Shopify where shared understanding across async teams is critical
How have you made data more accessible to non-technical stakeholders?
Frame the audience and their pain (SQL dependence, metric confusion), then describe your solution: a semantic layer or governed metrics, self-serve dashboards with guardrails, clear documentation, training/office hours, and ownership. Mention governance (definitions, change reviews) and how you measured adoption.
Sample answer: , In my last role, our marketing and operations teams struggled to access performance data without relying on analysts. I partnered with our data engineering team to build a Looker dashboard with role-based access and standardized definitions for core metrics like conversion rate and CAC. I added plain-language annotations to each metric and hosted weekly 20-minute training sessions on how to interpret the visuals. Within two months, the marketing team’s ad-hoc data requests dropped by 35 percent, freeing up analyst time for deeper work. I’d take the same approach at Shopifyensuring analysts build not just dashboards, but scalable, self-serve systems that empower others to make decisions confidently.
What would your manager say about you, and what are your top strengths and weaknesses?
Pick strengths that map to the role (SQL modeling, KPI design, stakeholder facilitation) and back them with examples. Choose a real weakness (e.g., over-polishing, saying yes too often), show the cost, and the system you use to mitigate it (timeboxing, RICE triage, early alignment docs). Show recent improvement.
Sample answer: My manager would say I’m analytical, proactive, and dependable under pressure. I’m known for simplifying complex problems, whether that’s through a clean SQL model or a one-page summary of insights that guides decisions. My main strength is my ability to translate data into business action. For example, I once helped our retention team identify a cohort of users with 3x higher churn risk, leading to a targeted campaign that improved retention by 5 percent. As for weaknesses, I used to spend too much time perfecting visualizations before sharing early drafts. To fix that, I started sending ‘rough cut’ analyses early for feedback, which sped up collaboration significantly. I’ve learned that progress and feedback matter more than polish, especially in async environments like Shopify.
Tell me about a time you struggled to communicate with stakeholders. How did you resolve it?
Describe the misalignment (e.g., attribution debates, conflicting targets), how you mapped incentives, created a shared metric framework, and facilitated trade-offs. Highlight artifacts you produced (pre-reads, decision logs, runbooks) and how you ensured the process stuck.
Sample answer: During a product pricing project, the finance and marketing teams disagreed on how to define ‘average order value’ for reporting. The debate stalled the rollout for two weeks. I realized both teams were optimizing for different goals, finance wanted gross margins, while marketing focused on user spend. I facilitated a short meeting where we aligned on two separate but clearly defined metrics: AOV (marketing) and GMV (finance). I documented both in our data catalog and updated dashboards accordingly. This improved trust between teams and reduced confusion in future reports. At Shopify, I’d apply the same principle, using clear documentation and transparent definitions to align async stakeholders.
Why Shopify? What are you looking for, and why are you a fit?
Connect your experience to Shopify’s mission and specific product areas (e.g., Shop Pay, Markets, Capital). Name a concrete metric problem you’re excited to own (merchant activation, checkout conversion by locale) and outline a focused 90-day approach (instrumentation, KPI health checks, recurring reviews).
Sample answer: I’ve always admired Shopify’s mission to empower entrepreneurs and lower the barriers to commerce. I’m drawn to the scale of impact; millions of merchants rely on data to make smarter decisions, and that’s exactly where I want to contribute. My background in building dashboards and running growth experiments aligns with Shopify’s data-first culture. For example, I recently built a retention forecasting model that helped our team reallocate budget toward high-LTV cohorts, improving ROI by 12 percent. I see myself bringing that mix of analytics and business storytelling to help Shopify teams refine key metrics like merchant activation and checkout conversion. I’m looking for a place where data directly influences strategy, and Shopify is that environment.
Two teams report different GMV numbers. How do you reconcile them and prevent future discrepancies?
Start by auditing metric definitions (gross vs. net, refunds/chargebacks timing, currency conversion), tracing lineage, and reproducing numbers. Propose a single source of truth with versioned definitions, owners, and data tests; add data contracts and alerts; communicate the change and migration plan.
Sample answer: I’d start by checking if both teams are pulling data from the same source and whether their GMV definitions match. Often one includes refunds or chargebacks while the other doesn’t. I’d reproduce both numbers, trace their lineage back to the raw transactions table, and identify where logic diverges. Once the root cause is clear, I’d convene a quick alignment session to agree on a single definition and build a validated Looker explore as the official source of truth. To prevent future discrepancies, I’d create a data contract with versioned metric definitions and ownership tags. That governance ensures consistency even as teams work asynchronously, which is key in a company as distributed as Shopify.
You shipped a new dashboard but adoption is low. How do you drive usage and measure success?
Define target personas and their jobs-to-be-done, then roll out role-based explores, training, and champions. Track adoption (weekly active viewers, saved looks, alert subscriptions, time-to-insight), collect feedback, and iterate. Establish ongoing enablement (office hours, FAQs, telemetry) so usage sustains.
Sample answer: When I launched a financial performance dashboard last year, adoption was initially slow because the team didn’t see how it connected to their goals. I met with end users to understand what decisions they were making daily, then customized the views by role, adding alerts for sales managers and simplifying summaries for executives. I also embedded quick tooltips explaining each metric and hosted a short async Loom walkthrough. Within a month, weekly active users tripled and time spent per session increased by 40 percent. I measured success through engagement metrics like saved views, subscriptions, and feedback scores. For Shopify, I’d apply the same principle, building for usability first and continuously improving based on user feedback and adoption data.
Tip: Use STAR, but keep Situation/Task to one sentence each and spend your time on Action/Result + Reflection. Choose stories that show ownership in async settings: aligning definitions, writing crisp docs, unblocking teams, and measuring outcomes. Quantify results (conversion, GMV, retention) and explain what you’d do differently now. Weave in Shopify values, merchant-obsessed, thrive on change, act like an owner, and reference artifacts (dashboards, data contracts, runbooks) that made your impact durable.
How to prepare for a business analyst role at Shopify
Preparing for a Shopify business analyst interview takes more than strong SQL skills. You need to balance technical fluency, product understanding, and the ability to translate insights into clear business recommendations. Shopify looks for analysts who can think independently, communicate asynchronously, and tie every data point back to merchant impact.
Below are focused strategies and tips to help you navigate each step of preparation effectively.
Master SQL under time pressure
Most interviews begin with a timed SQL challenge, so practice writing queries that combine joins, window functions, and aggregations under tight deadlines. Shopify values both accuracy and clarity, not overly complex code.
Tip: Use platforms like Interview Query or LeetCode Data to simulate 45-minute challenges. After solving, explain your logic out loud or in writing. This mirrors Shopify’s async style, where clear reasoning often matters more than syntax tricks.
Test your skills with real-world analytics challenges from top companies on Interview Query. Great for sharpening your problem-solving before interviews. Start solving challenges →
Refine data storytelling
Shopify interviewers want analysts who can make data drive action. Focus on turning metrics into narratives that highlight the “why” and “so what.” Practice presenting insights with concise slides or one-page summaries rather than dense reports.
Tip: Structure every analysis with three parts: insight, implication, and action. When reviewing past projects, rewrite findings as if you were recommending them to a product manager. This will sharpen your storytelling for the case round.
Study Shopify’s business intelligence stack
Shopify’s analysts use tools such as Looker, Snowflake, and internal Python notebooks. Knowing how these systems interact can help you stand out and show readiness to onboard quickly.
Tip: Watch public Looker tutorials and learn how to model metrics using LookML. Read Shopify’s engineering blog to understand how the company manages data governance and experimentation at scale. Mentioning these in interviews shows initiative and curiosity.
Polish life story narratives
Behavioral rounds test reflection, ownership, and clarity. Prepare two or three detailed stories where you solved ambiguous problems or influenced stakeholders through data. Keep each one tied to business results such as higher activation, improved margins, or reduced churn.
Tip: Record yourself summarizing each story in two minutes. Focus on lessons learned and what you’d do differently. Shopify values humility and growth, so highlight learning over perfection.
Practice mock presentations
Case study rounds often come down to delivery, not analysis. Rehearse summarizing your findings in 10 minutes using simple visuals and crisp language. Be ready to answer follow-up questions that test how well you understand trade-offs.
Tip: Practice in front of a peer or use Interview Query’s mock interview platform for realistic feedback. Ask reviewers whether your recommendations were clear, prioritized, and backed by data.
Want to practice real case studies with expert interviewers? Try Interview Query’s Mock Interviews for hands-on feedback and interview prep. Book a mock interview →
Strengthen product sense and business acumen
Shopify’s analysts are expected to think like product partners, not just data reporters. Understand how commerce products work — checkout, payments, subscriptions — and how metrics like GMV, conversion rate, and LTV connect to business strategy.
Tip: Read Shopify case studies and quarterly reports to learn how the company measures growth. Practice explaining technical metrics in plain language, as if you were presenting to a marketing or design lead.
Need 1:1 guidance on your interview strategy? Interview Query’s Coaching Program pairs you with mentors to refine your prep and build confidence. Explore coaching options →
Practice async communication
Since Shopify is digital-by-default, clear written communication is essential. Analysts frequently summarize insights in Slack threads or Notion docs rather than meetings.
Tip: Practice writing short “executive summaries” for your analyses, highlighting key takeaways in bullet form. This skill helps you shine in written case studies and follow-up rounds where clarity underpins collaboration.
Build comfort with experimentation and metrics design
Shopify runs hundreds of A/B tests across products. Understanding how to design experiments, define north-star metrics, and measure lift gives you an edge.
Tip: Review experiment-design basics like control groups, confidence intervals, and multiple-testing corrections. When studying case questions, outline how you’d test an idea and what success metrics you’d monitor.
Review common Shopify metrics and merchant use cases
Before your interview, familiarize yourself with Shopify’s core business areas — merchant onboarding, checkout optimization, and retention. These themes often appear in SQL queries and case prompts.
Tip: Review metrics such as active merchants, GMV, churn, and attach rate. Create mock dashboards or practice interpreting sample funnel data. This contextual understanding helps you answer both technical and strategic questions confidently.
Turn your preparation into results
Shopify is one of the most rewarding environments for business analysts who enjoy combining product thinking, analytics, and strategic storytelling. Success in the interview process depends on aligning technical fluency, narrative clarity, and business intuition with Shopify’s merchant-obsessed mission.
For guided practice, consider booking a mock interview with a Shopify alum coach or using the AI interview simulator. You can also explore the analytics learning path and read Jeffrey Li’s success story on how Interview Query helped him land a top role in tech.
Shopify Interview Questions
| Question | Topic | Difficulty | ||||||||||||||
|---|---|---|---|---|---|---|---|---|---|---|---|---|---|---|---|---|
SQL | Hard | |||||||||||||||
We’re given a table of bank transactions with three columns, Write a query to get the total three-day rolling average for deposits by day. Note: Please use the format Example: Input:
Output:
| ||||||||||||||||
SQL | Hard | |||||||||||||||
SQL | Medium | |||||||||||||||
SQL | Easy | |
Machine Learning | Medium | |
Statistics | Medium | |
SQL | Hard | |
Machine Learning | Medium | |
Python | Easy | |
Deep Learning | Hard | |
SQL | Medium | |
Statistics | Easy | |
Machine Learning | Hard |
Discussion & Interview Experiences