
Business Intelligence Interview Questions: Complete Guide with Examples & Answers


Introduction
Preparing for business intelligence interview questions can feel overwhelming, especially when roles blend analytics, SQL, reporting tools, and stakeholder communication. Business intelligence (BI) roles are projected to grow significantly, with some sources citing growth rates as high as 20-23% through 2028-2032, driven by the increasing importance of data-driven decision-making across all industries. Whether you’re interviewing for a BI analyst, BI developer, or BI engineer position, companies want to see how you turn raw data into clear insights that drive decisions.
In this guide, you’ll find the most asked business intelligence interview questions, examples of strong answers, SQL problems to practice, and a breakdown of the interview process across different BI roles. You’ll also learn how to prepare effectively, highlight your analytical thinking, and showcase the communication skills teams rely on. By the end, you’ll have a clear roadmap for standing out in every stage of the BI interview.
What Does a Business Intelligence Professional Do?
Business intelligence professionals help teams make smarter decisions by transforming raw data into clear insights, dashboards, and metrics. Whether you work as a BI analyst, BI developer, or BI engineer, your role sits at the intersection of data analysis, reporting, and stakeholder collaboration. On any team, from finance and operations to product and marketing, you’re responsible for turning business questions into measurable, reliable data solutions.
Core Responsibilities
- Pull, clean, and analyze data using SQL to investigate trends, build metrics, and support decision-making.
- Design dashboards and reports in tools like Power BI, Tableau, or Looker that help stakeholders monitor KPIs.
- Define and validate business metrics, ensuring consistency across teams and data sources.
- Partner with cross-functional teams to gather requirements, understand business goals, and translate them into reporting solutions.
- Troubleshoot data quality issues by identifying broken pipelines, missing fields, or inconsistent logic.
- Build and maintain data models that support recurring analyses and reporting needs.
- Optimize reporting performance, from query tuning to improving data refresh frequency.
- Document logic and data sources clearly, making it easier for teams to interpret and trust the insights.
Tip: As you prepare for interviews, connect your past projects to these responsibilities. Interviewers want to see that you understand not just how to analyze data, but how to support decision-making across an entire organization.
Want to build up your BI interview skills? Practice real hands-on problems on the Interview Query Dashboard and start getting interview ready today.
Business Intelligence Interview Process Overview
The business intelligence interview process usually follows a structured path across most companies, combining technical evaluation, analytical reasoning, and communication skills. While the exact flow varies by role, you can expect a mix of SQL assessments, case studies, dashboard discussions, and behavioral conversations. Understanding each stage helps you prepare strategically and show that you can think clearly with data.
Recruiter Screen
Your first conversation typically focuses on background, role fit, and familiarity with the BI toolset. Recruiters look for experience with SQL and dashboarding tools (Power BI, Tableau, Looker), metrics definition, and working with cross-functional teams. They may also ask about your past projects and which BI responsibilities you’re most comfortable owning.
Tip: Prepare a concise walkthrough of your BI experience and highlight a project where you solved a business problem using SQL and a dashboard.
Technical Assessment (SQL, data modeling, logic)
Most BI roles require a technical test that evaluates your ability to query data, calculate KPIs, and transform messy tables. Expect SQL questions involving joins, aggregations, window functions, data cleaning, and sometimes query optimization. Some companies also include small data modeling exercises or ask you to reason through table structures.
Tip: Practice explaining your approach aloud. Interviewers care just as much about structured thinking as they do about getting the right query.
BI Case Study or Take-Home Assignment
In this stage, you might build a dashboard, analyze a dataset, or interpret trends from provided tables. Case studies test your ability to define metrics, craft a narrative from the data, and clarify assumptions. If you receive a take-home assignment, companies will evaluate clarity, logic, and how well your solution addresses the business problem.
Tip: Don’t jump into the visuals immediately. Start by listing the key questions, relevant metrics, and stakeholders, since it results in stronger, more intentional dashboards.
Behavioral and Stakeholder Communication Round
Because BI roles sit close to business teams, you’ll be asked about handling ambiguity, prioritizing requests, communicating insights, and navigating conflicting requirements. Interviewers want to know how you influence decisions, defend your metrics, and collaborate with non-technical stakeholders.
Tip: Use the STAR method to structure your answers, and choose examples where your work directly impacted a decision or improved a process.
Top Business Intelligence Interview Questions
Business intelligence interviews typically cover four major skill areas: SQL, analytics reasoning, data modeling, and dashboard or reporting best practices. Companies use these questions to understand not just how well you can write queries, but how you think about business problems, define metrics, and communicate insights. Before diving into specific examples, it’s helpful to see how these question types fit together and what they reveal about your problem-solving approach.
Across BI analyst, BI engineer, and BI developer roles, you can expect questions about KPI definitions, data cleaning, stakeholder scenarios, and how you’ve built reporting solutions in past roles. The sections below break down the most common question themes you’ll encounter, along with examples and guidance to help you prepare confidently.
Read more: Business Analyst Interview Questions: A Comprehensive Guide
SQL Interview Questions for Business Intelligence Analysts
SQL is the foundation of almost every BI role. Whether you’re defining KPIs, validating data quality, or building dashboards, you’ll rely on SQL to pull, clean, and transform datasets. Interviewers use SQL questions to understand how you think through problems, handle edge cases, and communicate your logic clearly. Expect a mix of joins, window functions, aggregations, filtering, and scenario-based query tasks that reflect real reporting challenges.
Tip: When answering SQL questions out loud, walk through your logic before writing the query. Interviewers care as much about how you think as they do about the final syntax.
Find the month_over_month change in revenue for the year 2019.
This question tests time-based windowing. To solve this, group revenue by month using
DATE_TRUNC('month', order_date)and useLAG(SUM(revenue)) OVER (ORDER BY month)to compute the difference, then divide by the previous month’s revenue for a percent change.Tip: Clarify that you’d filter out the first month since it has no prior comparison, since such clean handling of edge cases always impresses interviewers.
-
This question evaluates your ability to use window functions for behavioral metrics. You can calculate consecutive visit streaks by comparing event dates with
LAG()and resetting counts when a break occurs, then aggregate by user to find the longest streak. This problem tests analytical thinking, partition logic, and efficient event ordering, all key in product analytics pipelines.Tip: Emphasize handling edge cases where users skip days or have multiple events on the same day since both can break streak logic if not managed properly.
Given a
userstable, write a query to return only its duplicate rows.When an interviewer asks you to return only the duplicate rows from a
userstable, they’re really checking whether you understand grouping, aggregation, and how to isolate repeated values in a dataset. The simplest approach is to group by the columns that define a “duplicate” (often email, username, or whatever uniquely identifies a user) and then filter for those groups where the count is greater than one. Tip: Always clarify what counts as a duplicate—a single column, a combination of columns, or the entire row, because interviewers often leave that part intentionally vague.Find the percentage of users that had at least one seven-day streak of visiting the same URL.
This question checks your ability to define and detect behavioral patterns over time. The logic uses date differences or running sequences to detect consecutive visits, followed by an aggregate to count qualifying users and compute the percentage.
Tip: Mention that you’d validate streak logic using test data first, which demonstrates analytical thoroughness and debugging discipline.
Which SQL logic samples every fourth record from a transaction table ordered by timestamp?
This question tests window functions, row numbering, and ordered sampling logic. It’s about verifying whether you can generate and filter sequential records without relying on randomization. To solve it, order the transactions by date, assign a row number to each record, and then pick only every fourth one by filtering where that row number divides evenly by 4.
Tip: Mention that
ROW_NUMBER()orNTILE()functions keep order intact and prevent uneven distribution, which shows you understand deterministic sampling.Write a query that returns all neighborhoods that have 0 users.
This question tests
LEFT JOINsandNULLhandling. It’s specifically about detecting neighborhoods with no matching user records. To solve this,LEFT JOINneighborhoods to users onneighborhood_idand filter rows where the user side isNULL. In practice, this pattern is used to find coverage gaps, under-served areas, or data integrity issues.Tip: Explain why
LEFT JOINis better thanNOT INhere since it’s faster and handlesNULLvalues more reliably in most SQL engines.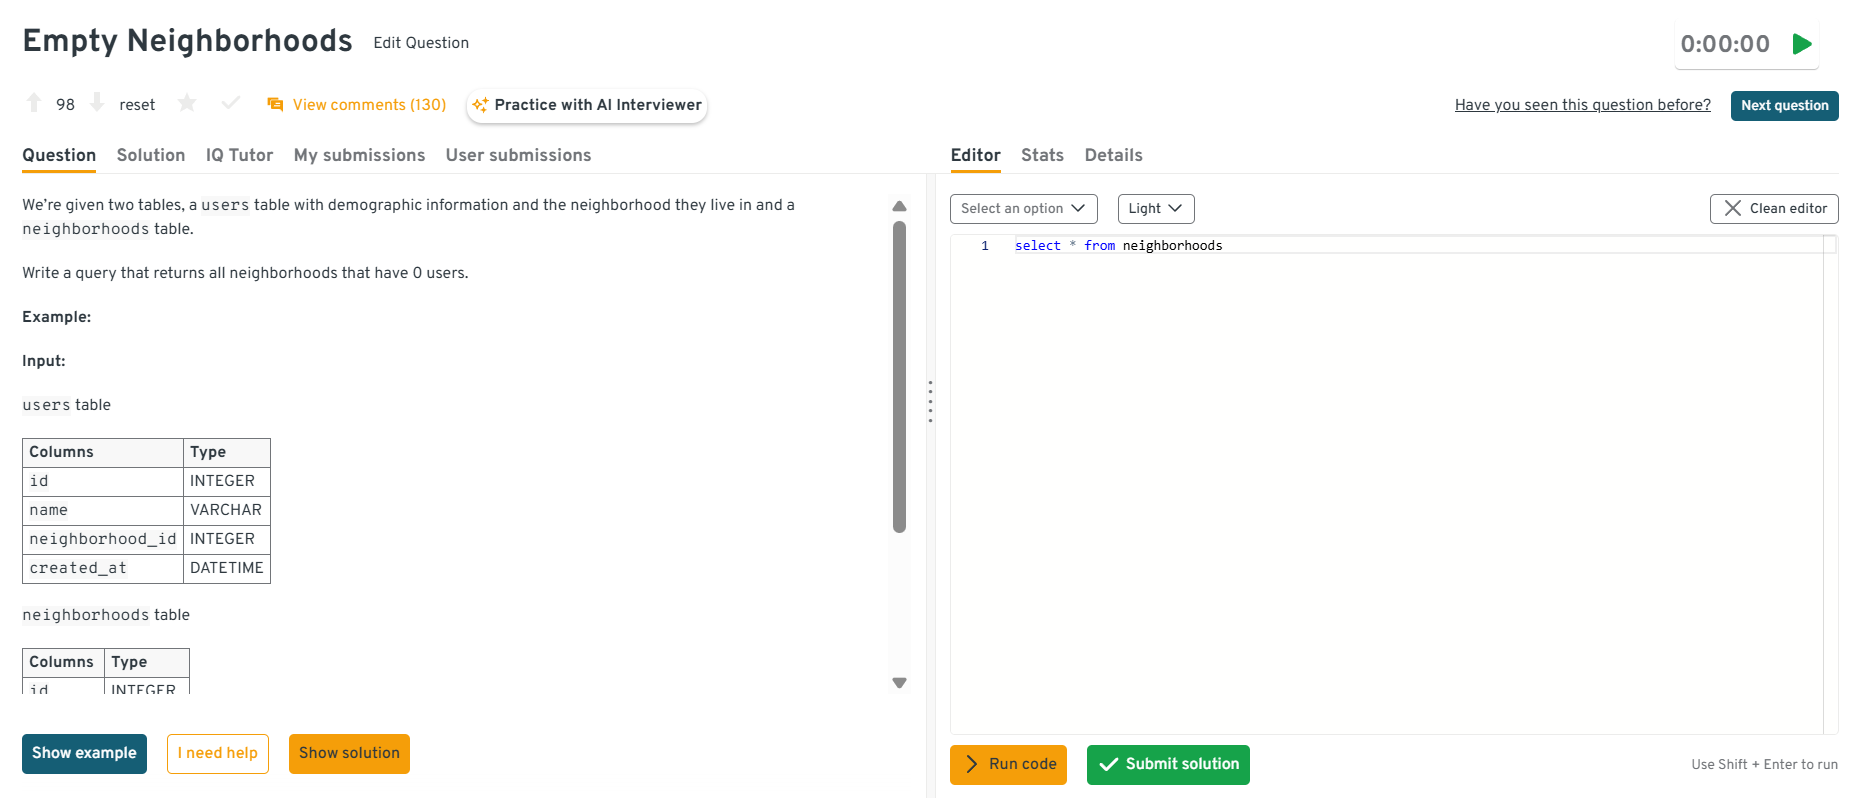
You can explore the Interview Query dashboard to practice real-world business intelligence interview questions in a live environment. You can write, run codes, and submit answers while getting instant feedback, perfect for mastering business intelligence problems across domains.
Select the 2nd highest salary in the engineering department
This question tests basic ranking and de-duplication. It’s specifically about excluding the maximum and retrieving the next highest value within a department filter. To solve this, filter to engineering and use a ranking function (e.g.,
ROW_NUMBER/DENSE_RANK) orORDER BYwithLIMIT/OFFSETto fetch the second highest salary. In real analytics, this helps with compensation benchmarking and percentile-based reporting.Tip: Mention when to prefer
DENSE_RANKoverROW_NUMBER, since the former correctly handles ties in salary values.Write a query to get the average order value by gender.
This question tests aggregation. It’s specifically about computing spend per order and averaging across customers. To solve this, group by
order_id, computeSUM(price*quantity), thenAVGacross orders. In practice, this is a foundational retail metric.Tip: Show awareness of data quality, and mention that you’d handle missing or unknown genders to ensure cleaner analytics.
-
This question tests your ability to apply conditional grouping and use multiple
HAVINGfilters. Start by grouping transactions bycustomer_idandYEAR(order_date), then filter customers meeting the count threshold in both years. It’s a direct example of retention analysis and customer segmentation.Tip: Suggest using a pivot-style CTE or self-join of yearly aggregates, this shows comfort with data restructuring and analytical creativity.
How would you report annual retention rates for a yearly-billed SaaS product?
Determine each customer’s cohort year via their first payment, then for every subsequent year compute
SUM(is_renewed)/COUNT(*)within that cohort to get retention. A self-join or window function retrieves the first year, and a pivot produces a tidy year-by-year grid. Discussing churn definitions, handling partial years, and creating a composite index on(customer_id, payment_year)demonstrates scalable thinking.Tip: Mention that aligning cohorts by first billing date ensures fair comparisons across customers with different signup times. This kind of data hygiene is critical for retention accuracy.
Want to master SQL interview questions? Start with our SQL Question Bank to drill real-world scenario questions used in top interviews.
BI Analyst Interview Questions (Analytics + Reporting)
BI analyst interviews focus on how well you translate business problems into metrics, insights, and dashboards. These questions assess your ability to choose the right KPIs, validate data quality, explain trends, and work with stakeholders. Interviewers want to understand how you think about business context, communicate your decisions, and ensure reports remain accurate and actionable.
How do you define and validate a KPI?
Interviewers ask this to evaluate your understanding of metric design, alignment, and data quality. A strong answer explains how you start with a clear business objective, define the metric formula and grain, validate the source tables, and check for consistency across segments and time. You highlight the importance of confirming that everyone agrees on the definition before using it in dashboards or reports.
Tip: Mention how you document KPI definitions so teams avoid misinterpretation.
Walk through a dashboard you built. What decisions did it support?
This question tests your ability to explain the thinking behind your dashboards. A strong answer describes the business problem, why you chose specific KPIs or charts, how the layout helped users interpret trends, and what decisions or improvements the dashboard enabled. Interviewers want to see that you design dashboards with intent rather than simply visualizing available data.
Tip: Focus on the impact the dashboard created since interviewers care about outcomes.
How do you handle conflicting requirements from stakeholders?
Interviewers use this question to assess communication and prioritization skills. A thoughtful answer explains how you clarify goals, uncover the reasoning behind each request, negotiate timelines, and align everyone on what matters most. You also mention documenting agreed-upon definitions or requirements to prevent confusion later.
Tip: Emphasize transparency since stakeholders value clear expectations.
How do you QA a report before delivering it to leadership?
This question tests your attention to detail and data quality process. A strong answer includes checking for duplicate rows, confirming filter logic, validating joins and time periods, comparing sample outputs with source queries, and reviewing whether the KPIs match documented definitions. You also mention verifying that visualizations match the intended narrative.
Tip: Point out that you re-run critical checks after any pipeline or model update.
Tell me about a time you identified an insight that influenced a business decision.
Interviewers want to see that your analysis leads to real action. A strong answer includes the business problem, the data you analyzed, the insight you uncovered, and the resulting change. You should demonstrate that you can bridge the gap between analysis and recommendation in a clear and persuasive way.
Tip: Choose an example where you collaborated across teams since BI analysts often work cross-functionally.
-
Interviewers ask this to see whether you understand causal inference and can separate correlation from causation. A strong answer explains how you would compare treatment and control groups, ensure users were randomly assigned or matched, rule out seasonal or acquisition-channel differences, and check for consistent lift across segments. You should highlight the importance of isolating the effect of the redesign and validating that no other product or marketing changes drove the increase.
Tip: Mention how you would communicate uncertainty in your findings since causal questions often involve imperfect data.
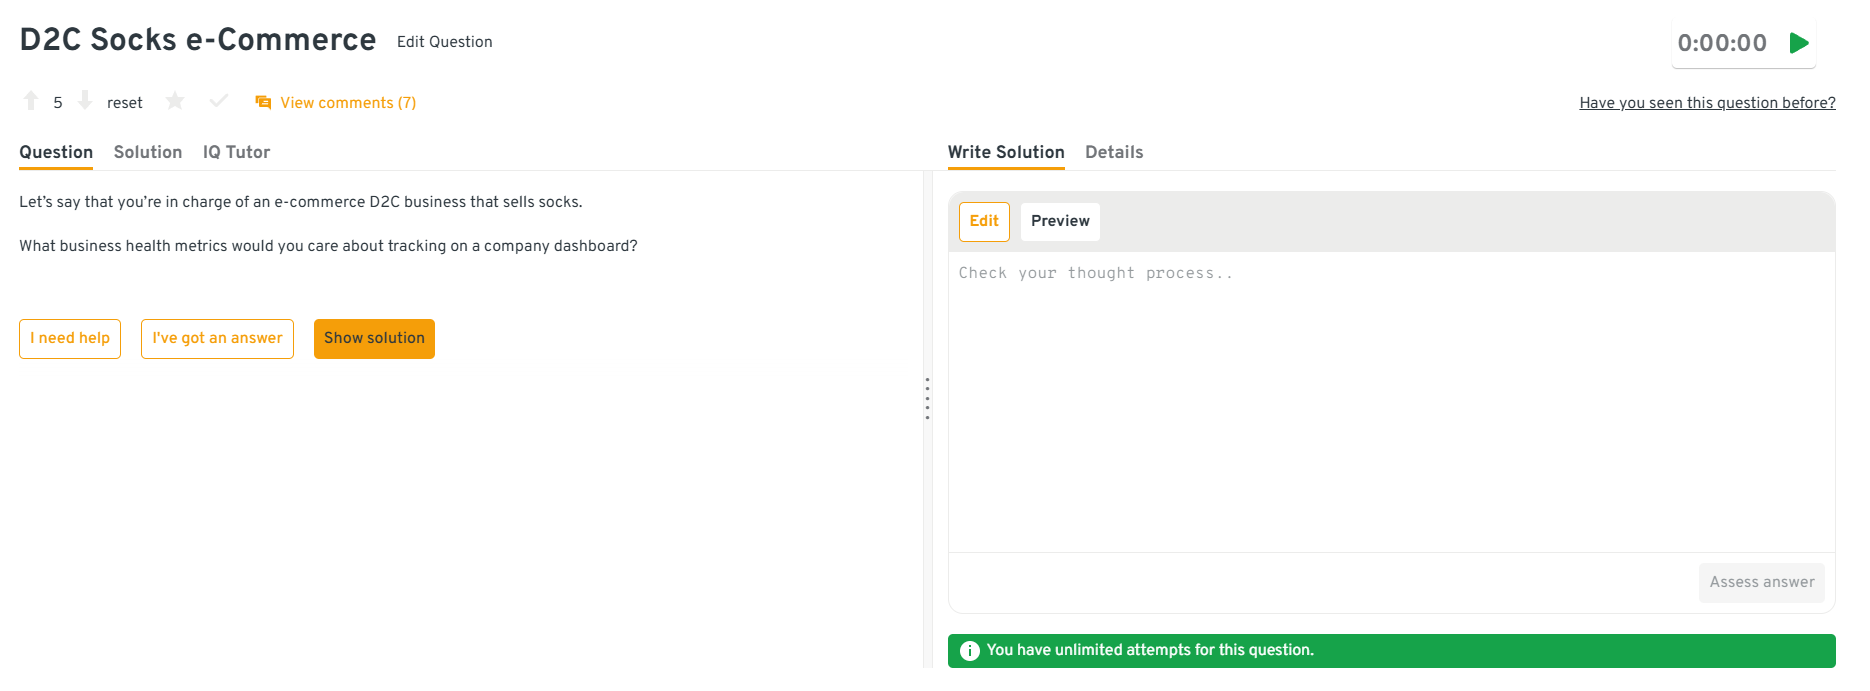
-
This question tests your ability to choose meaningful KPIs and tie them to the company’s goals. A strong answer identifies metrics like conversion rate, average order value, customer acquisition cost, repeat purchase rate, ROAS, return rate, and inventory turnover. You should explain why each metric matters and how it connects to marketing efficiency, customer retention, or supply chain performance. Interviewers want to see that you can prioritize insights and design dashboards that help teams act quickly.
Tip: Group metrics by funnel stage to show structured thinking.
You can explore the Interview Query dashboard to practice real-world business intelligence interview questions in a live environment. You can write, run codes, and submit answers while getting instant feedback, perfect for mastering business intelligence problems across domains.
-
Interviewers use this question to evaluate your approach to diagnosing behavioral shifts. A good answer explains how you would segment users, analyze engagement trends before and after relationship status changes, review interaction types, and identify which features decline most. You might explore whether users spend more time on external apps or whether major life events change digital habits. You then outline how you would propose product experiments to improve engagement.
Tip: Clarify which data you would request if it is not available, which shows good analytical judgment.
-
This question assesses your ability to break down complex behavioral data and produce clear recommendations. A strong answer includes mapping key touchpoints, creating funnel analyses, identifying drop-off points, running cohort analysis, and reviewing click paths or search queries. You should explain how you would connect patterns in event data with usability issues and then propose UI changes that remove friction.
Tip: Mention how you would validate your recommendations with A/B tests or user interviews.
-
Interviewers use this question to see whether you can structure a multi-step analysis. A solid answer includes reviewing trends by segment, channel, product category, price tier, seasonality, and customer type. You explain how you would isolate whether the decline is driven by traffic, conversion rate, average order value, or retention. Once you identify the main drivers, you describe how to dig deeper into specific filters or product attributes to find probable causes.
Tip: Describe how you would present your findings clearly, for example by summarizing the top two or three drivers instead of overwhelming stakeholders.
Looking for hands-on problem-solving? Test your skills with real-world challenges from top companies. Ideal for sharpening your thinking before interviews and showcasing your problem solving ability.
BI Engineer Interview Questions (Data Pipelines + Modeling)
BI engineer interviews focus on how well you understand data warehouse design, ETL pipelines, modeling concepts, and performance optimization. These questions help interviewers see whether you can architect reliable data systems that analysts and business teams depend on. Strong answers show that you think in terms of scalability, data quality, and long-term maintainability.
Explain star schema vs. snowflake schema.
Interviewers ask this to test your understanding of dimensional modeling and how design decisions affect query performance. A strong answer explains that star schemas use denormalized dimensions for faster, simpler queries, while snowflake schemas normalize dimensions to reduce redundancy and improve storage efficiency. You should describe when you’d choose each approach: star for BI dashboards that need low-latency queries and snowflake for complex enterprise models or when you need more granular data relationships. This demonstrates that you can balance performance with maintainability.
Tip: Mention how these schemas affect downstream tools like Power BI or Tableau, it shows full pipeline awareness.
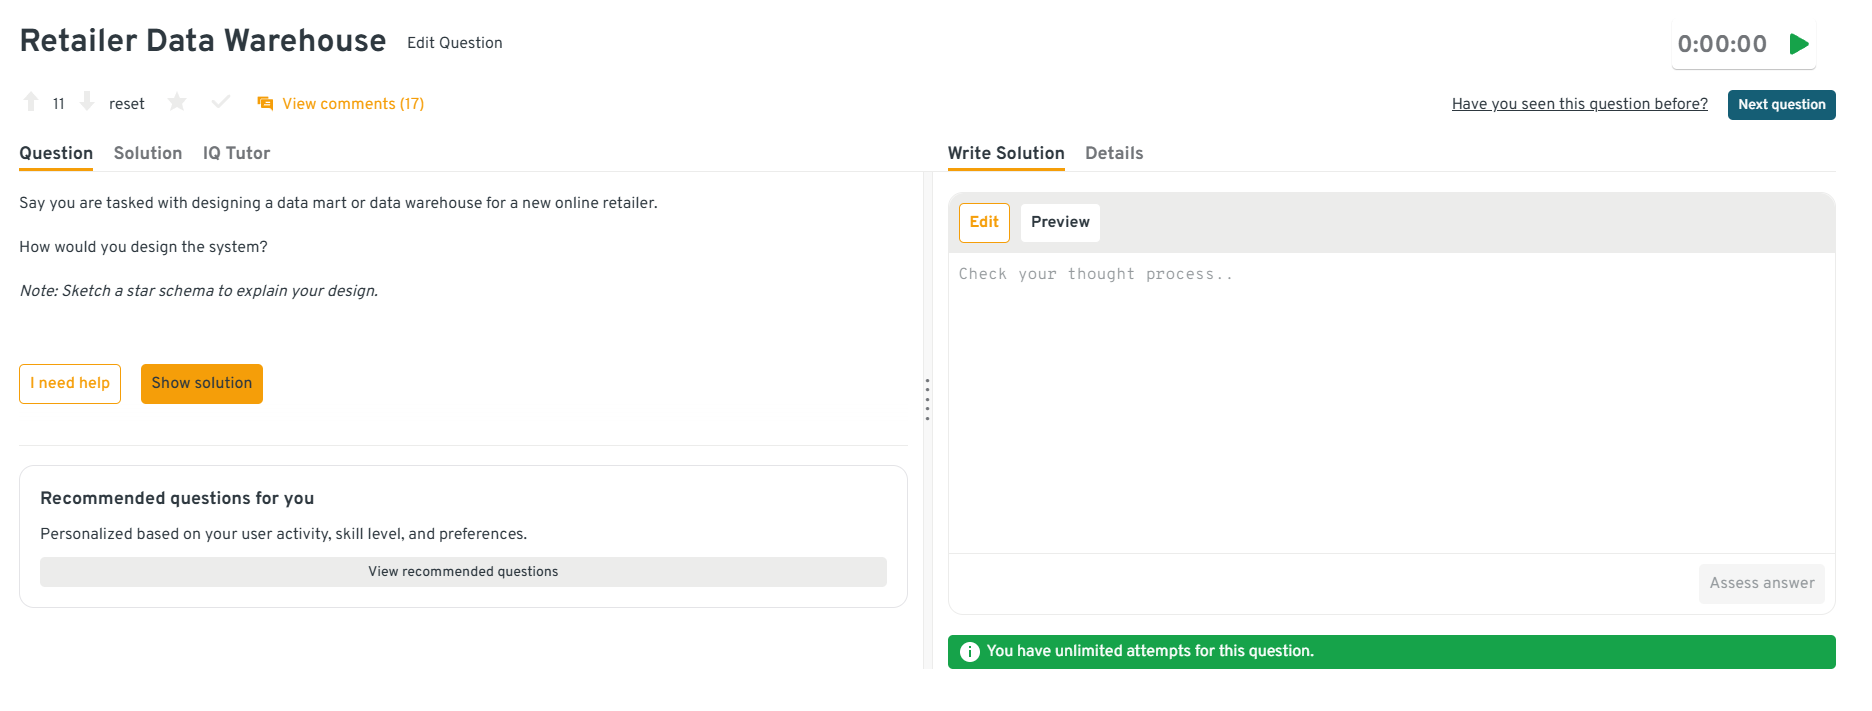
-
Interviewers ask this to evaluate your ability to translate business operations into a clean analytical model. A strong answer explains how you would identify core entities like customers, products, orders, and inventory, then define the grain of the fact table such as one row per order line. You describe building a star schema with a central fact table connected to dimension tables that store descriptive attributes, and you highlight how this structure improves query performance and supports flexible analysis. You also mention partitioning strategies, incremental loads, and how you would validate the design with reporting use cases.
Tip: Point out how your schema supports real downstream needs like cohort analysis, product performance reporting, or marketing attribution.
You can explore the Interview Query dashboard to practice real-world business intelligence interview questions in a live environment. You can write, run codes, and submit answers while getting instant feedback, perfect for mastering business intelligence problems across domains.
How would you design an ETL pipeline for daily sales data?
This question evaluates your ability to structure a reliable data flow from ingestion to transformation. A strong answer outlines a clear pipeline: extracting data from source systems, validating schema and record counts, transforming it into a clean model, and loading it into a warehouse table with proper partitioning. Interviewers want to see that you understand error handling, scheduling, dependency management, and version control. Describing how you’d handle late-arriving data or incremental updates shows a deeper level of engineering maturity.
Tip: Mention monitoring, BI teams value pipelines that detect failures early and avoid silent data errors.
How do you optimize a slow dashboard?
Interviewers ask this to gauge your ability to diagnose performance issues across the full BI stack. A thoughtful answer explains how you’d check the query plan, reduce complex joins, pre-aggregate data, or move calculations upstream into the warehouse. You might also mention optimizing extract refreshes, simplifying visuals, or applying row-level filters. The key is showing that you investigate both the data model and the reporting layer rather than assuming the issue is only in one tool.
Tip: Use a real example of a dashboard you successfully improved, concrete wins stand out.
How do you track data lineage in a BI environment?
This question tests your understanding of governance and maintainability. A strong answer explains that lineage helps teams trace where metrics originate, how they transform across models, and which dashboards depend on each data source. You should describe using tools like dbt documentation, metadata tables, version control, or lineage tracking platforms to map these relationships. Interviewers want to know that you can build systems that remain understandable as teams grow and models evolve.
Tip: Emphasize why lineage reduces risk, stakeholders trust dashboards more when logic is transparent.
Describe a high-impact data model you built.
Interviewers want to see how you identify business needs, translate them into a structured model, and deliver a scalable solution. A strong answer explains the business problem, the entities involved, the grain of the model, and the relationships you designed — including why you chose certain dimensions or fact tables. Highlight how your model improved reporting performance, reduced complexity for analysts, or enabled a new insight. This shows your ability to design systems that create long-term value.
Tip: If possible, quantify the impact, even a rough estimate of time saved or adoption increase strengthens your story.
-
This question tests your ability to handle messy real-world data and design scalable deduplication logic. A solid answer explains how you would start by standardizing text fields, normalizing case, removing special characters, and tokenizing product names. You then describe using similarity techniques like fuzzy matching, trigram comparisons, or embeddings for near-duplicate detection, followed by grouping items by shared attributes such as SKU, category, brand, or price. Finally, you outline how to choose a canonical record and update or merge duplicate listings in a controlled pipeline to avoid disrupting reporting.
Tip: Mention how you would monitor future duplicates through automated checks so the issue does not return.
Need 1:1 guidance on your interview strategy? Explore Interview Query’s Coaching Program that pairs you with mentors to refine your prep and build confidence.
BI Developer Interview Questions (Tools + Dashboarding)
BI developer interviews focus on your ability to design dashboards, implement business logic within BI tools, and translate stakeholder needs into polished, reliable reporting. Interviewers want to see that you understand visualization best practices, performance tuning, data modeling inside BI tools, and how to build reports that support real decision-making.
Walk through your process for building a new dashboard end-to-end.
Interviewers ask this to understand how you convert requirements into a structured reporting solution. A strong answer walks through requirements gathering, drafting metrics, designing the data model, creating visuals that support the decision, and validating the final output with stakeholders. This shows that you treat dashboards as decision tools, not just collections of charts.
Tip: Emphasize collaboration, since mentioning how you confirm requirements or iterate with users signals maturity and adaptability.
How do you optimize performance in Power BI or Tableau?
This question tests your diagnostic skills and knowledge of tool-specific optimization techniques. A strong answer covers pre-aggregating data in the warehouse, reducing row counts, simplifying visuals, limiting cross-filters, or using extracts instead of live connections. Interviewers want to hear that you investigate both the data model and the frontend, showing a holistic approach to performance tuning.
Tip: Reference a real scenario where you reduced load time, concrete examples demonstrate applied expertise.
Explain row-level security and how you’ve implemented it.
Interviewers ask this to confirm that you understand permissioning and data governance within BI tools. A good answer explains how row-level security restricts data visibility based on user attributes and describes how you set it up using roles, filters, or user tables. Mentioning how you test end-user views and monitor for breaks shows a thoughtful approach to protecting sensitive data.
Tip: Connect your answer to stakeholder trust, security features matter because leaders rely on accurate, appropriate visibility.
Describe a complex DAX or calculated field you’ve written.
This question evaluates your ability to implement business logic directly within BI tools. A strong answer describes the business need, the calculation’s purpose, and how you validated the logic with both data and stakeholders. Interviewers want to see that you understand not only how to write formulas, but when to push logic into BI tools versus the data warehouse.
Tip: Call out how you debugged or validated the calculation, it shows rigor and reliability.
How do you design data refresh strategies for dashboards?
This question tests your understanding of pipeline dependencies, refresh frequency, and the trade-offs between real-time and scheduled updates. A thoughtful answer covers assessing stakeholder needs, determining the appropriate refresh cadence, monitoring failures, and optimizing schedules to avoid bottlenecks. This shows that you think about dashboards as both a technical and operational product.
Tip: Mention how you communicate refresh limitations or expectations, managing visibility is a key developer skill.
What are some effective ways to make data more accessible to non-technical people?
Interviewers ask this to see whether you can remove friction between stakeholders and the insights they need. A strong answer explains how you design intuitive dashboards, use clear labeling and tooltips, create guided navigation, build semantic layers or certified datasets, and provide simple self-service options with guardrails. You can also mention training sessions, data dictionaries, and lightweight explanations that help teams interpret charts correctly. This shows that you care about usability and adoption, not just technical accuracy.
Tip: Highlight that you focus on reducing cognitive load by keeping visuals simple and aligning them with real business questions.
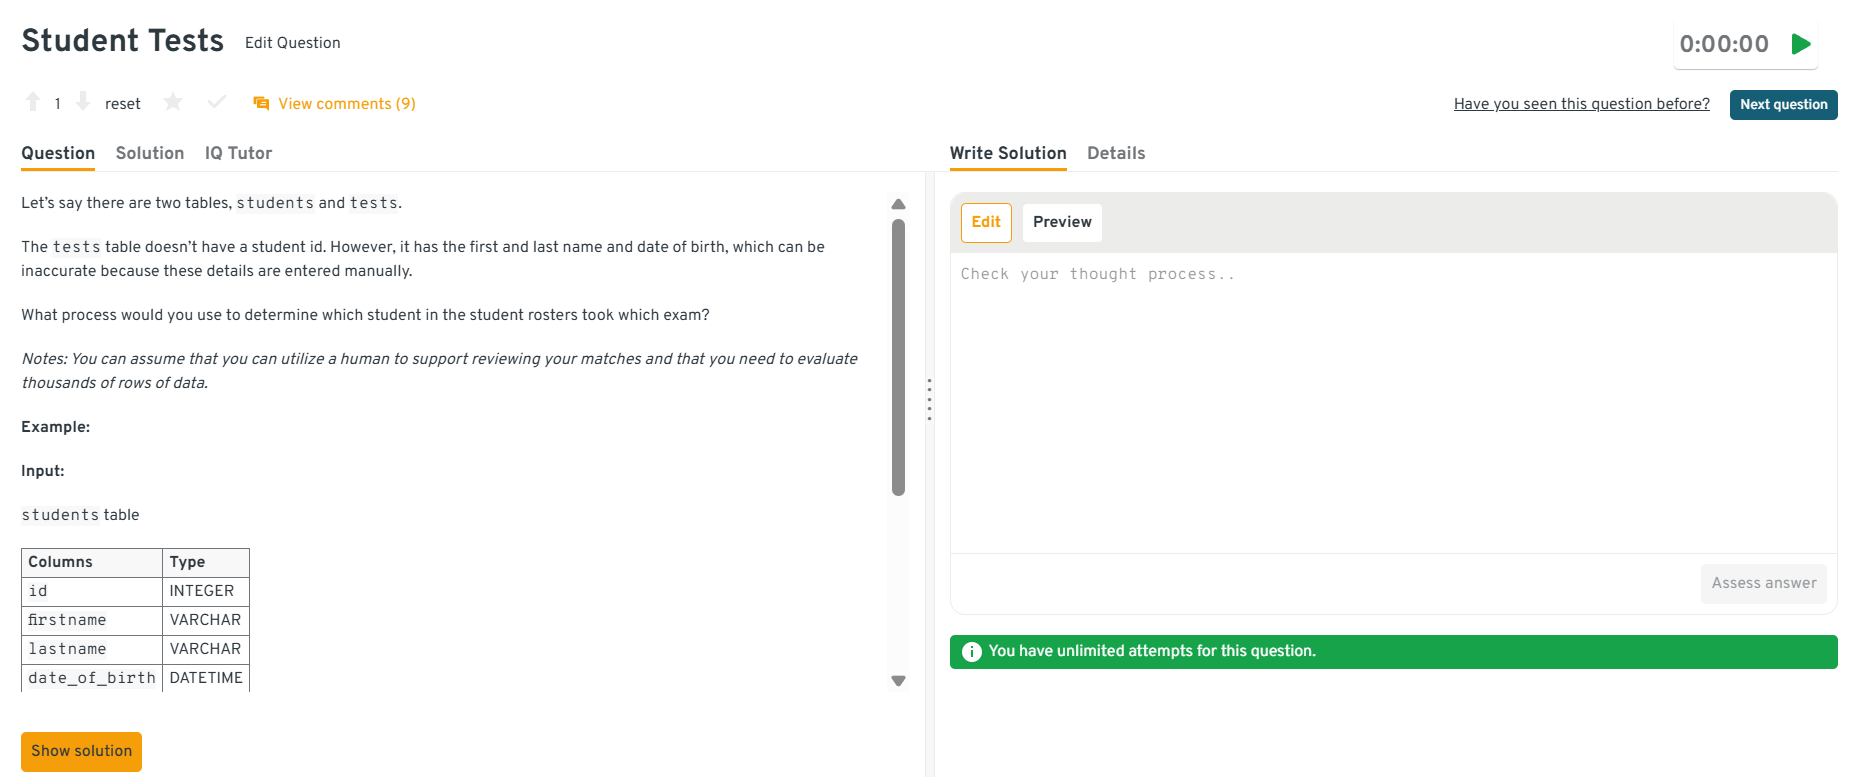
-
This question evaluates your ability to work with imperfect data and design robust matching logic. A strong answer describes cleaning and standardizing fields, handling nicknames and misspellings with fuzzy matching, and creating composite similarity rules using name tokens, phonetic encodings, and date tolerances. You can also mention scoring matches, flagging uncertain pairs for manual review, and building an automated pipeline that continues to update matches over time. This shows that you understand both the technical and operational sides of record matching.
Tip: Mention how you log match confidence and track unresolved cases since this prevents silent errors in downstream reporting.
You can explore the Interview Query dashboard to practice real-world business intelligence interview questions in a live environment. You can write, run codes, and submit answers while getting instant feedback, perfect for mastering business intelligence problems across domains.
-
Interviewers use this question to test your debugging process and your ability to trace issues across the data pipeline. A strong answer includes checking upstream ingestion logic, reviewing default values, comparing recent loads with historical records, and validating marriage status against authoritative sources. You might also investigate joins that duplicate rows, missing dimension data that forces fallback values, or incorrect mapping rules in ETL. Once the root cause is identified, you describe how to correct the data model and repair corrupted records.
Tip: Explain how you would work with the data engineering team to prevent similar mapping issues from reoccurring.
-
This question tests your ability to combine funnel analysis with product intuition. A strong answer explains how you would validate the data first, review each step of the funnel, compare current conversion rates to historical baselines, and segment users by platform, geography, or acquisition source. You then describe generating hypotheses about why the pattern appears, such as a UI bug, pricing page confusion, or a change in trial eligibility. Finally, you outline how you would recommend follow-up analyses or product experiments to confirm the cause.
Tip: Clarify that you always check for data integrity first before assuming the behavior reflects real user intent.
-
Interviewers ask this to see how you separate price sensitivity from other drivers of churn or signup behavior. A strong answer explains how you would analyze user cohorts before and after price changes, segment users by tenure and engagement, and compare churn or conversion rates against control groups who were not exposed to the change. You also describe reviewing survey data, competitor pricing, and A/B tests where price is the only variable. The goal is to confirm whether price has a direct causal impact or whether other factors like content catalog changes, economic shifts, or device experience play a stronger role.
Tip: Mention how triangulating behavioral data, pricing experiments, and user research gives a more reliable conclusion than relying on a single data source.
See a step-by-step solution for this question and how you would think through determining and testing what the deciding factors on final purchase are for customers:
In this mock interview session, Ying, a data scientist, walks through how to answer a Netflix Business Product case question. She goes over how to interact with the interviewer, why we should ask clarifying questions and provides helpful tips throughout the entire process, which can get you one step closer to your BI interview prep!
Business Intelligence Behavioral Interview Questions
Behavioral questions help interviewers understand how you operate in real BI environments, such as how you communicate, influence decisions, resolve data issues, and prioritize stakeholders. Strong answers combine clear reasoning with concrete examples that show your impact.
Tell me about a time your analysis changed a business decision.
Interviewers ask this to see whether your work drives outcomes, not just dashboards. They want to understand how you identify insights, communicate them clearly, and influence cross-functional teams. A strong answer frames the business problem, the analysis you performed, the insight you uncovered, and what action resulted from it, showing that you can bridge the gap between data and decision-making.
Example answer: “In my previous role, our marketing team planned to double budget for a campaign that looked successful on the surface. I dug into the data and found that most conversions came from existing customers, not new acquisition. After presenting a breakdown by customer segment and showing a declining marginal return, the team shifted budget toward channels with stronger new-user conversion. That change helped increase first-time customers by 18% the next quarter.”
Tip: Choose examples with a clear before-and-after impact, even directional improvements show strong analytical judgment.
Describe a time you dealt with conflicting data sources.
This tests your approach to data quality, root-cause investigation, and communication. BI analysts frequently encounter inconsistent metrics, broken pipelines, and mismatched definitions, so interviewers want to see your methodical process: identifying the discrepancy, validating assumptions, tracing lineage, and working with engineering or stakeholders to resolve it.
Example answer: “Our revenue dashboard didn’t match finance’s numbers during a QBR prep. I pulled queries for both reports and noticed that finance was using transaction timestamps in UTC, while our warehouse used localized timestamps. After tracing lineage and confirming the logic with engineering, I aligned the time zones and updated the transformation code. I documented the change and notified both teams so future reports stayed consistent.”
Tip: Highlight how you communicated the issue, surfacing discrepancies early builds trust in BI work.
How do you handle changing requirements or last-minute requests?
Interviewers ask this to evaluate your prioritization, communication, and ability to stay calm under shifting expectations. BI work is often reactive, and a strong answer shows that you gather context, understand urgency, clarify trade-offs, and propose timelines that protect quality while supporting business needs.
Example answer: “A sales leader once requested a new deal forecast dashboard the day before an executive meeting. Instead of rushing, I clarified which decisions the dashboard needed to support and learned they only needed two KPIs and a visual trend. I delivered a simplified but accurate version that met their needs and scheduled time the next week to build a more robust version. This avoided errors while still meeting the deadline.”
Tip: Show that you don’t blindly say yes, effective BI professionals negotiate scope to protect data accuracy.
Tell me about a time you worked with non-technical stakeholders.
This question tests your communication skills and ability to explain technical concepts clearly. Companies want BI professionals who can translate data into actionable insights without overwhelming stakeholders. A strong answer shows you can adjust your language, focus on what matters, and ensure your audience understands the implications of the data.
Example answer: “I partnered with our operations team to reduce delivery delays. They weren’t familiar with SQL or dashboards, so I focused on explaining the problem using simple visuals and clear language. I highlighted which regions had the largest bottlenecks, what was causing them, and what changes would have the biggest impact. They used the insights to adjust staffing plans, and delays dropped by 10% the following month.”
Tip: Emphasize how you ensured understanding, pausing for clarification, simplifying visuals, or validating interpretation.
Describe a difficult stakeholder and how you handled the situation.
This question helps interviewers assess emotional intelligence and resilience. BI professionals often work with stakeholders who feel pressured by deadlines, frustrated by data inconsistencies, or unclear about what they need. A strong answer focuses on understanding their perspective, reframing the conversation around goals, and creating alignment without escalating conflict.
Example answer: “A product manager was upset because the metrics I reported didn’t match what they saw in an older version of a dashboard. Instead of debating the numbers, I asked them to walk me through their workflow so I could understand the gap. We discovered the old dashboard used a deprecated definition of ‘active user.’ I explained the logic behind the new metric, documented the differences, and updated naming conventions to prevent confusion. The PM appreciated the clarity, and the tension dropped.”
Tip: Keep the focus on the problem, not personality, it demonstrates professionalism and maturity.
Give an example of how you’ve prioritized multiple competing requests.
This question evaluates your ability to balance workload and organize stakeholder demands. Strong answers show that you prioritize based on business impact, urgency, data dependencies, and effort. Interviewers want someone who can make thoughtful decisions, communicate timelines clearly, and avoid turning BI work into a backlog of reactive requests.
Example answer: “When I supported both finance and product teams, I often received conflicting requests. I created a simple prioritization framework based on impact and urgency, then reviewed it with both teams weekly. One week, a finance request tied to a board meeting took priority over a product dashboard enhancement. I explained the trade-off, delivered the high-impact work first, and scheduled the remaining task for the following sprint. Stakeholders appreciated the transparency.”
Tip: Mention how you give visibility into your queue, transparency reduces friction and improves trust.
If you want to simulate real interview pressure, use Interview Query’s Mock Interviews to test your skills live in a coding environment with real feedback.
How to Prepare for a Business Intelligence Interview (step-by-step)
Preparing for a BI interview means strengthening both your technical foundations and your ability to communicate insights clearly. BI roles sit at the intersection of SQL, dashboards, data modeling, and stakeholder collaboration, so your preparation should reflect that balance. The strongest candidates practice real SQL problems, rebuild dashboards end-to-end, refine their storytelling skills, and review key business concepts. Below is a step-by-step plan to approach your preparation with structure and confidence.
Master SQL fundamentals and advanced patterns
SQL is the backbone of almost every BI role, so spend time practicing joins, aggregations, window functions, and data cleaning patterns. Focus especially on KPI definitions, time-series analysis, and queries that require multiple steps of logic. Recreating common reporting queries, such as churn calculations, rolling averages, segmentation, will prepare you for both timed assessments and live SQL interviews.
Tip: Practice writing queries out loud. Interviewers care about your reasoning just as much as your final answer.
Rebuild dashboards and visualizations end-to-end
Choose a dataset and build a dashboard from scratch in Power BI, Tableau, or Looker. Practice defining the goal, selecting the right KPIs, designing the visuals, and validating the final output. Interviewers look for candidates who can both build clean dashboards and explain why each metric and chart matters to the business.
Tip: Bring one polished dashboard to the interview, it works as a real portfolio piece and strengthens your storytelling.
Refresh core BI concepts: metrics, data modeling, and ETL
Review concepts like star vs. snowflake schema, fact vs. dimension tables, data grains, and how ETL pipelines transform raw data into analytics-ready models. Even if you’re interviewing for an analyst-focused role, understanding the upstream mechanics helps you reason better about data issues and communicate effectively with data engineers.
Tip: Re-explain modeling concepts in simple terms, behavioral rounds often test how well you explain technical ideas to non-technical partners.
Practice business reasoning and metric interpretation
Many interviews include questions where you interpret trends, diagnose data anomalies, or critique an existing dashboard. Practice breaking down a metric change into potential causes and outlining how you’d validate each hypothesis. This shows that you can think critically about business performance rather than just generating charts.
Tip: Use a structured framework like “baseline → segments → time periods → anomalies” to break down any metric review.
Prepare your behavioral stories ahead of time
Strong BI behavioral answers highlight communication, cross-functional collaboration, and impact. Prepare 5–7 STAR-based stories showcasing how you solved data inconsistencies, influenced decisions, handled ambiguity, or prioritized competing requests. BI hiring managers value clarity and impact, so choose concrete examples where your work changed a process or decision.
Tip: Practice delivering your stories in under 90 seconds, concise storytelling stands out.
Research the company’s data maturity and BI stack
Before the interview, explore job descriptions, engineering blogs, and product pages to understand which tools the company uses. Knowing whether they rely on Snowflake, BigQuery, Looker, Tableau, Power BI, dbt, or Airflow helps you tailor your examples and show immediate alignment with their ecosystem.
Tip: Mention one or two relevant tools early in the conversation, it shows you’re ready to be productive quickly.
Simulate realistic interview practice
Work through SQL assessments, case studies, and dashboard critiques under timed conditions. Replicating the interview environment reduces stress and highlights gaps you can improve before the real conversation.
Tip: Prioritize quality over quantity, reviewing 10 well-understood problems beats rushing through 50.
Want to level up your BI interview prep? Practice hands-on SQL problems and real take-home assignments on Interview Query Dashboard.
Business Intelligence Salary Overview and Career Growth Tips
Mastering BI interviews is only part of the journey. The next step is understanding your market value. Business intelligence professionals who write efficient SQL, build meaningful dashboards, model data effectively, and translate insights into decisions are in high demand across modern organizations. Your ability to influence the business directly shapes your earning potential.
Here is how to understand salary ranges, negotiate confidently, and plan for long-term BI career growth.
Average Base Salary
Average Total Compensation
Understand Typical Salary Ranges
Salary bands for business intelligence roles depend on level, location, industry, and technical specialization. Below are typical U.S. ranges based on data from Glassdoor, Indeed, and Levels.fyi.
- Entry-Level BI Analyst: $70K to $90K
- Mid-Level BI Analyst: $90K to $115K
- Senior BI Analyst: $115K to $145K and above
- BI Developer: $100K to $135K and above
- BI Engineer: $130K to $170K and above
- Senior BI Engineer in top tech companies: $170K to $210K or more in total compensation
Startups may offer lower base salaries with more equity potential. Larger tech companies tend to offer structured compensation bands along with strong bonuses and benefits.
Tip: Use tools like Interview Query Salary Explorer, Levels.fyi, and Glassdoor to benchmark your expected range before negotiating.
Know What Drives Your Value
Your compensation increases when you show that you can connect technical work to business outcomes. BI professionals who combine SQL expertise with data modeling, stakeholder communication, and dashboard development often command higher salaries. Specialists who can optimize data pipelines, implement row-level security, or design scalable BI models tend to stand out.
Tip: Highlight measurable improvements. For example, “I optimized a Power BI report and reduced refresh time by 50 percent.” This helps interviewers understand your real impact.
Evaluate the Entire Compensation Package
Your base salary is only one part of the offer. Look closely at bonuses, equity, insurance benefits, retirement match, remote flexibility, and training stipends. Some companies also provide budgets for certifications in Tableau, Power BI, or cloud analytics tools.
Tip: Ask about professional development opportunities and internal training programs. BI careers evolve quickly, and access to learning resources can make a long-term difference.
Time Your Negotiation Right
Negotiate only after you receive a formal offer. At that point the company has already decided that you are a strong fit. Thank them for the offer, share your research, and ask whether there is flexibility based on your experience and the benchmarks you have gathered.
Tip: Use a calm and factual line like:
“Based on my BI experience and salary benchmarks from Levels.fyi and Interview Query, I was expecting something closer to $135K. Is there flexibility in the offer?”
Track BI Job Market Trends
Demand for BI professionals continues to grow as companies rely more heavily on data-driven decision-making. The trend is particularly strong in e-commerce, fintech, healthcare, and SaaS. BI roles increasingly overlap with analytics engineering and advanced SQL workflows, which expands earning potential for candidates with modern data skills.
Tip: Follow Interview Query’s job market reports, LinkedIn insights, and company engineering blogs to understand how expectations and salary trends are shifting across BI roles.
Plan for Long-Term Career Growth
Long-term growth in BI often comes from expanding into complementary areas like analytics engineering, cloud modeling, or dashboard automation. Developing depth across tools and systems helps you move into senior or lead roles more quickly and gives you a broader perspective on the data ecosystem.
Keep advancing by:
- Learning cloud warehouses such as Snowflake, BigQuery, and Redshift
- Improving SQL performance techniques and modeling fundamentals
- Building advanced skills in Tableau, Power BI, or Looker
- Gaining familiarity with dbt or basic Python for automation
- Documenting BI logic and contributing to internal knowledge sharing
Tip: Think of your BI career as layered skills. SQL is the foundation, analytics is the interpretation layer, and modeling or automation is the accelerator that separates mid-level talent from senior leadership.
FAQs
What skills do you need for a BI interview?
You should be comfortable with SQL, data analysis, KPI design, dashboard tools like Power BI or Tableau, and basic data modeling concepts. Strong communication skills are also essential since BI roles involve explaining insights and collaborating with stakeholders.
Which tools should BI candidates know?
Most companies expect proficiency in SQL, Excel, and at least one visualization tool such as Power BI, Tableau, or Looker. Knowledge of modern cloud warehouses like Snowflake or BigQuery is a plus, and familiarity with dbt or Python helps for more technical BI roles.
How technical is a BI analyst interview?
BI interviews usually include SQL assessments, data cleaning or modeling questions, and a dashboard or case study review. The goal is to see if you can work with raw data, design reliable metrics, and communicate insights clearly to non-technical teams.
What is the difference between a BI analyst and a BI engineer?
BI analysts focus on analysis, metrics, and dashboards, while BI engineers design the data models, pipelines, and warehouse structures that support reporting. Engineers typically handle more backend architecture, and analysts work closer to business teams.
How should I prepare for BI SQL questions?
Practice writing queries involving joins, aggregations, window functions, and data cleaning patterns. Focus on tasks that support reporting, such as KPI calculations, time-series analysis, and segmentation. Reviewing query plans and optimizing logic is also helpful.
What questions should I ask at the end of a BI interview?
Good questions explore the team’s data maturity, BI stack, upcoming projects, and expectations for the first 90 days. You can also ask how BI collaborates with engineering or product teams and what success looks like in the role.
Do companies expect BI candidates to know Python?
Python is not required for most BI analyst roles, but it is becoming more common in BI engineer, analytics engineering, and hybrid analytics roles. It is helpful for automation, data validation, and working with APIs, but SQL and visualization skills remain the core requirements.
How can I show impact in a BI interview?
Use examples where your analysis led to a decision, improved a metric, reduced data issues, or saved time for stakeholders. Interviewers want to see that your work creates measurable value, not just dashboards.
Conclusion
Preparing for a business intelligence interview is ultimately about showing that you can turn data into clear, reliable insights that help teams make better decisions. By practicing SQL, refining your dashboard skills, understanding core BI concepts, and preparing thoughtful behavioral examples, you can walk into the interview with confidence. The key is to connect your technical work to real business impact and to communicate your reasoning clearly.
If you want to accelerate your preparation, explore Interview Query’s SQL challenges, BI take-home assignments, and mock interviews. These resources can help you sharpen your skills and approach your next BI interview with a strong competitive edge.
Your Next Step
Don’t stop here, take what you’ve learned and put it into practice. Every query you write, every dataset you explore, and every dashboard you ship moves you closer to becoming a standout BI analyst. You can explore recently asked BI interview questions on Interview Query to continue leveling up your prep.
Keep learning. Keep analyzing. And keep turning data into impact.