Top 25 Data Visualization Interview Questions in 2025


Overview
Data visualization questions regularly appear during data analyst interviews. In fact, if you’ve made it to the on-site round, there’s a good chance you’ll face a standalone 45-minute data visualization interview in addition to technical and behavioral rounds.
Various data visualization interview questions can come up, from basics like design philosophy and how you approach creating a visualization to Tableau technical questions. Therefore, to ace a data visualization interview, you should be prepared to:
- Walk an interviewer through your visualization portfolio
- Discuss your approach to data visualization and design philosophy
- Understand advanced functions of visualization tools like Tableau and PowerBI
- Talk through data visualization use cases and case studies
We created this guide to help you practice. It features an overview of the types of data visualization interview questions you can expect and visualization practice questions.
What Types of Data Visualization Interview Questions Get Asked?
| Question | Topic | Difficulty | ||||||||||||||||||||||
|---|---|---|---|---|---|---|---|---|---|---|---|---|---|---|---|---|---|---|---|---|---|---|---|---|
SQL | Easy | |||||||||||||||||||||||
We’re given two tables, a Write a query that returns all neighborhoods that have 0 users. Example: Input:
Output:
| ||||||||||||||||||||||||
SQL | Easy | |||||||||||||||||||||||
SQL | Hard | |||||||||||||||||||||||
SQL | Easy | |
Machine Learning | Medium | |
Statistics | Medium | |
SQL | Hard | |
Machine Learning | Medium | |
Python | Easy | |
Deep Learning | Hard | |
SQL | Medium | |
Statistics | Easy | |
Machine Learning | Hard |
Data visualization interview questions tend to vary depending on the maturity of a company’s data visualization operation.
For example, a company just launching a data visualization team likely hasn’t figured out its design aesthetic or what tools to use and may not have buy-in. Therefore, the interview might focus more on your design approach, the tools you use, and how well you collaborate.
With a more established team, you can expect more technical questions about specific tools, as well as culture fit and behavioral questions to determine if you’re right for the team.
Overall, data visualization interview topics fall into five categories:
- Design approach - These questions assess your approach to creating visualizations, including how you make design choices, how you gather stakeholder input, and your general design philosophy.
- Tableau questions - These questions cover basic-to-intermediate features of Tableau, including concepts like the difference between measures and dimensions.
- Data preparation interview - These questions cover topics like data cleaning, data validation, basic data structures, and database design-type questions. The goal is to assess how experienced you are in working with and processing data.
- Data visualization case studies - These questions propose a scenario and then ask you to choose the best visualization for the scenario. They can range from simple use case questions like, “What type of data is a scatter plot good for?” to business cases specific to the company.
- Portfolio walk-through - A design portfolio is an important tool for landing a data visualization job. You should be prepared to walk interviews through your design approach for each project, your choices, lessons you learned, and how you might improve examples.

Data Visualization Interview Questions: Design
| Question | Topic | Difficulty | ||||||||||||||||||||||
|---|---|---|---|---|---|---|---|---|---|---|---|---|---|---|---|---|---|---|---|---|---|---|---|---|
SQL | Easy | |||||||||||||||||||||||
We’re given two tables, a Write a query that returns all neighborhoods that have 0 users. Example: Input:
Output:
| ||||||||||||||||||||||||
SQL | Easy | |||||||||||||||||||||||
SQL | Hard | |||||||||||||||||||||||
SQL | Easy | |
Machine Learning | Medium | |
Statistics | Medium | |
SQL | Hard | |
Machine Learning | Medium | |
Python | Easy | |
Deep Learning | Hard | |
SQL | Medium | |
Statistics | Easy | |
Machine Learning | Hard |
Design philosophy questions assess your approach to data design, including color theory, types of charts, data positioning, and designing for specific audiences. Here are some sample design philosophy questions:
1. What makes a good data visualization?
You’ll see a variation of this question in every data visualization interview. The question is asked to understand your design philosophy at a basic level and also your ability to design for a specific audience. You can talk about specific characteristics like:
- Color theory and aesthetics
- Matching the visualization to the data/use case
- Ease of deployment and development costs
One key point to make is to always relate your response to the audience. Effective visualizations make data accessible to the target audience.
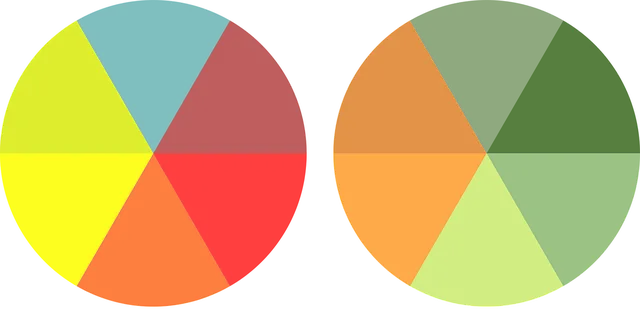
2. How do you use color in your visualizations?
You should expect a color theory question. To prepare, practice talking about your favorite color theory techniques. A few to consider would be:
- Using color to highlight important information
- Using one color to represent continuous data (as well as saturation to represent intensity)
- Avoiding an indistinguishable color palette
- Limiting too many colors
- Accessibility for color-blind viewers
More Design Interview Questions
3. What is depth cueing in visualization?
4. How would you gather dashboard requirements from stakeholders?
5. How do you tune your designs to stakeholder requirements?
6. What’s your data visualization philosophy?
Data Visualization Interview Questions: Tableau
| Question | Topic | Difficulty | ||||||||||||||||||||||
|---|---|---|---|---|---|---|---|---|---|---|---|---|---|---|---|---|---|---|---|---|---|---|---|---|
SQL | Easy | |||||||||||||||||||||||
We’re given two tables, a Write a query that returns all neighborhoods that have 0 users. Example: Input:
Output:
| ||||||||||||||||||||||||
SQL | Easy | |||||||||||||||||||||||
SQL | Hard | |||||||||||||||||||||||
SQL | Easy | |
Machine Learning | Medium | |
Statistics | Medium | |
SQL | Hard | |
Machine Learning | Medium | |
Python | Easy | |
Deep Learning | Hard | |
SQL | Medium | |
Statistics | Easy | |
Machine Learning | Hard |
Tableau is one of the most widely used enterprise data visualization tools. If Tableau is mentioned in the job outreach, you should brush up on Tableau interview questions, and understand basic functions, definitions, and workflows in Tableau.
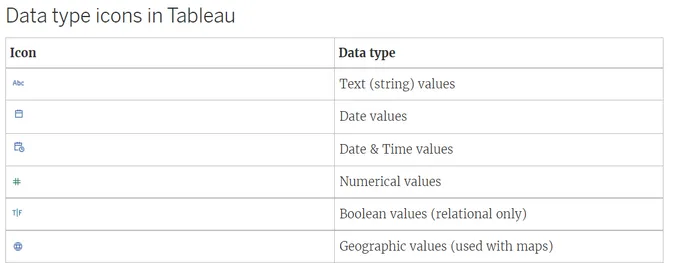
7. What data types does Tableau support?
A basic question like this quickly measures how familiar you are with Tableau. Know and memorize definition-type questions like this. The data types include:
- Boolean
- Date values
- Date & Time values
- Geographic values
- Text string values
- Numerical values
- Cluster groups
8. What are Measures and Dimensions?
Dimensions contain qualitative values, like names, dates, or locational data. Dimensions are used to segment and categorize data. Measures contain numerical quantitative values, which are measurable. Measures can be aggregated.
9. What are the different types of joins in Tableau?
10. What is Tableau Data Server?
11. What is disaggregation and aggregation of data?
12. What happens when you join two tables in Tableau and the values do not match?
13. What is the difference between discrete and continuous in Tableau?
Data Visualization Interview Questions: Data Preparation
| Question | Topic | Difficulty | ||||||||||||||||||||||
|---|---|---|---|---|---|---|---|---|---|---|---|---|---|---|---|---|---|---|---|---|---|---|---|---|
SQL | Easy | |||||||||||||||||||||||
We’re given two tables, a Write a query that returns all neighborhoods that have 0 users. Example: Input:
Output:
| ||||||||||||||||||||||||
SQL | Easy | |||||||||||||||||||||||
SQL | Hard | |||||||||||||||||||||||
SQL | Easy | |
Machine Learning | Medium | |
Statistics | Medium | |
SQL | Hard | |
Machine Learning | Medium | |
Python | Easy | |
Deep Learning | Hard | |
SQL | Medium | |
Statistics | Easy | |
Machine Learning | Hard |
Data preparation and validation questions assess your ability to overcome challenges in data quality and processing.
14. What should be done with suspected or missing data?
Walk the interview through your data validation process. You might include preparing a data validation report, which reveals why the data failed. Next, you might discuss how you would analyze this data and strategies for working with missing data, like deletion, single imputation, mean/median/mode imputation, etc.
15. What process would you use to transform raw data into a visualization?
A question like this quickly assesses your experience working with data processing. Step 1 might involve gathering stakeholder input and understanding the goals of the visualization. Then, you might include steps like:
- Data collection
- Data cleaning (De-dupping, missing values, standardizing)
- Choosing a chart type
- Data preparation (formatting, converting, grouping/aggregating)
16. What is an outlier? How would you address outliers?
17. Name some data validation techniques.
18. What are the characteristics of a good data model?
Data Visualization Case Studies
Prepare for two types of case questions: General access questions and business case studies. General data visualization cases ask why you might choose a particular design given a data type or scenario. More advanced business case study questions propose a business scenario and ask how you would design a visualization for that scenario.
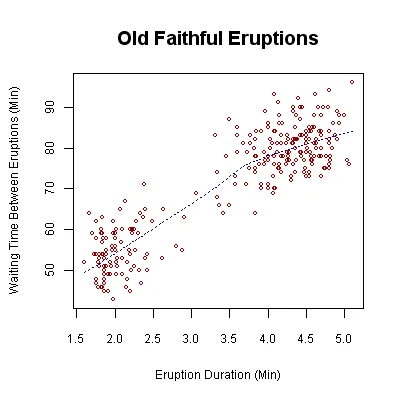
19. What is a scatter plot? What types of data work best in scatter plots?
A scatter plot is a type of chart used to show the correlation between two or more variables. It’s best used when there isn’t a time element and can help show the relationship between the variables, e.g., positive, negative, or no correlation. For example, a scatter plot would effectively show the relationship between height and weight.
20. Create a dashboard that provides sentiment analysis data across pre-defined customer groups.
Many visualization case studies will look like this: You’ll be provided with a scenario and sample data sets, and then you must sketch a dashboard on the fly. With visualization case studies:
- Start by gathering information about stakeholders and the type of data that they want to collect and analyze
- Define user outcomes and outline a process the user can take to identify insights quickly from the dashboard
- Define the data that will be collected and identify potential challenges to displaying that data
After you’ve gathered information, you can move to sketch out dashboard layouts to display the data effectively.
21. Create a dashboard to show sales performance through a marketing channel.
22. When would you use a pie chart vs a line chart? Propose examples for each.
23. Create a dashboard to analyze customer segmentation based on demographics.
24. What chart would you use to analyze website traffic trends over the past year?
25. Design a chart to compare the performance of different product lines across regions.
Data Visualization Portfolio Walkthrough
After answering data visualization interview questions, a common practice is to perform a portfolio walk-through. You might go project by project through the portfolio, or you may be asked to highlight a few of your favorite projects.
To build a really strong visualization portfolio, you should:
- Showcase a broad range of visualization types and charts
- Feature your best work, and leave out projects that don’t stand out
- Include at least one dashboard
During the walkthrough, be prepared to talk about each project in detail. Practice talking about:
- The stakeholders and how you gathered input
- Challenges you faced in data gathering and cleaning
- Why you made certain design choices and included/excluded data
- Results (e.g. sales/marketing lift, faster analysis, etc.)
- Takeaways and lessons learned
One note: Don’t be afraid to talk about things you would do differently. This will show your ability to learn and adapt.
More Data Analyst Interview Resources
Prepare for your data analyst and visualization interview with these resources from Interview Query:
- Top Data Analyst Interview Questions
- How to Prepare for a Data Analyst Interview
- 21 Data Analyst Behavioral Questions