January Data Science Job Market Report (2026)


Job Market Overview for 2026
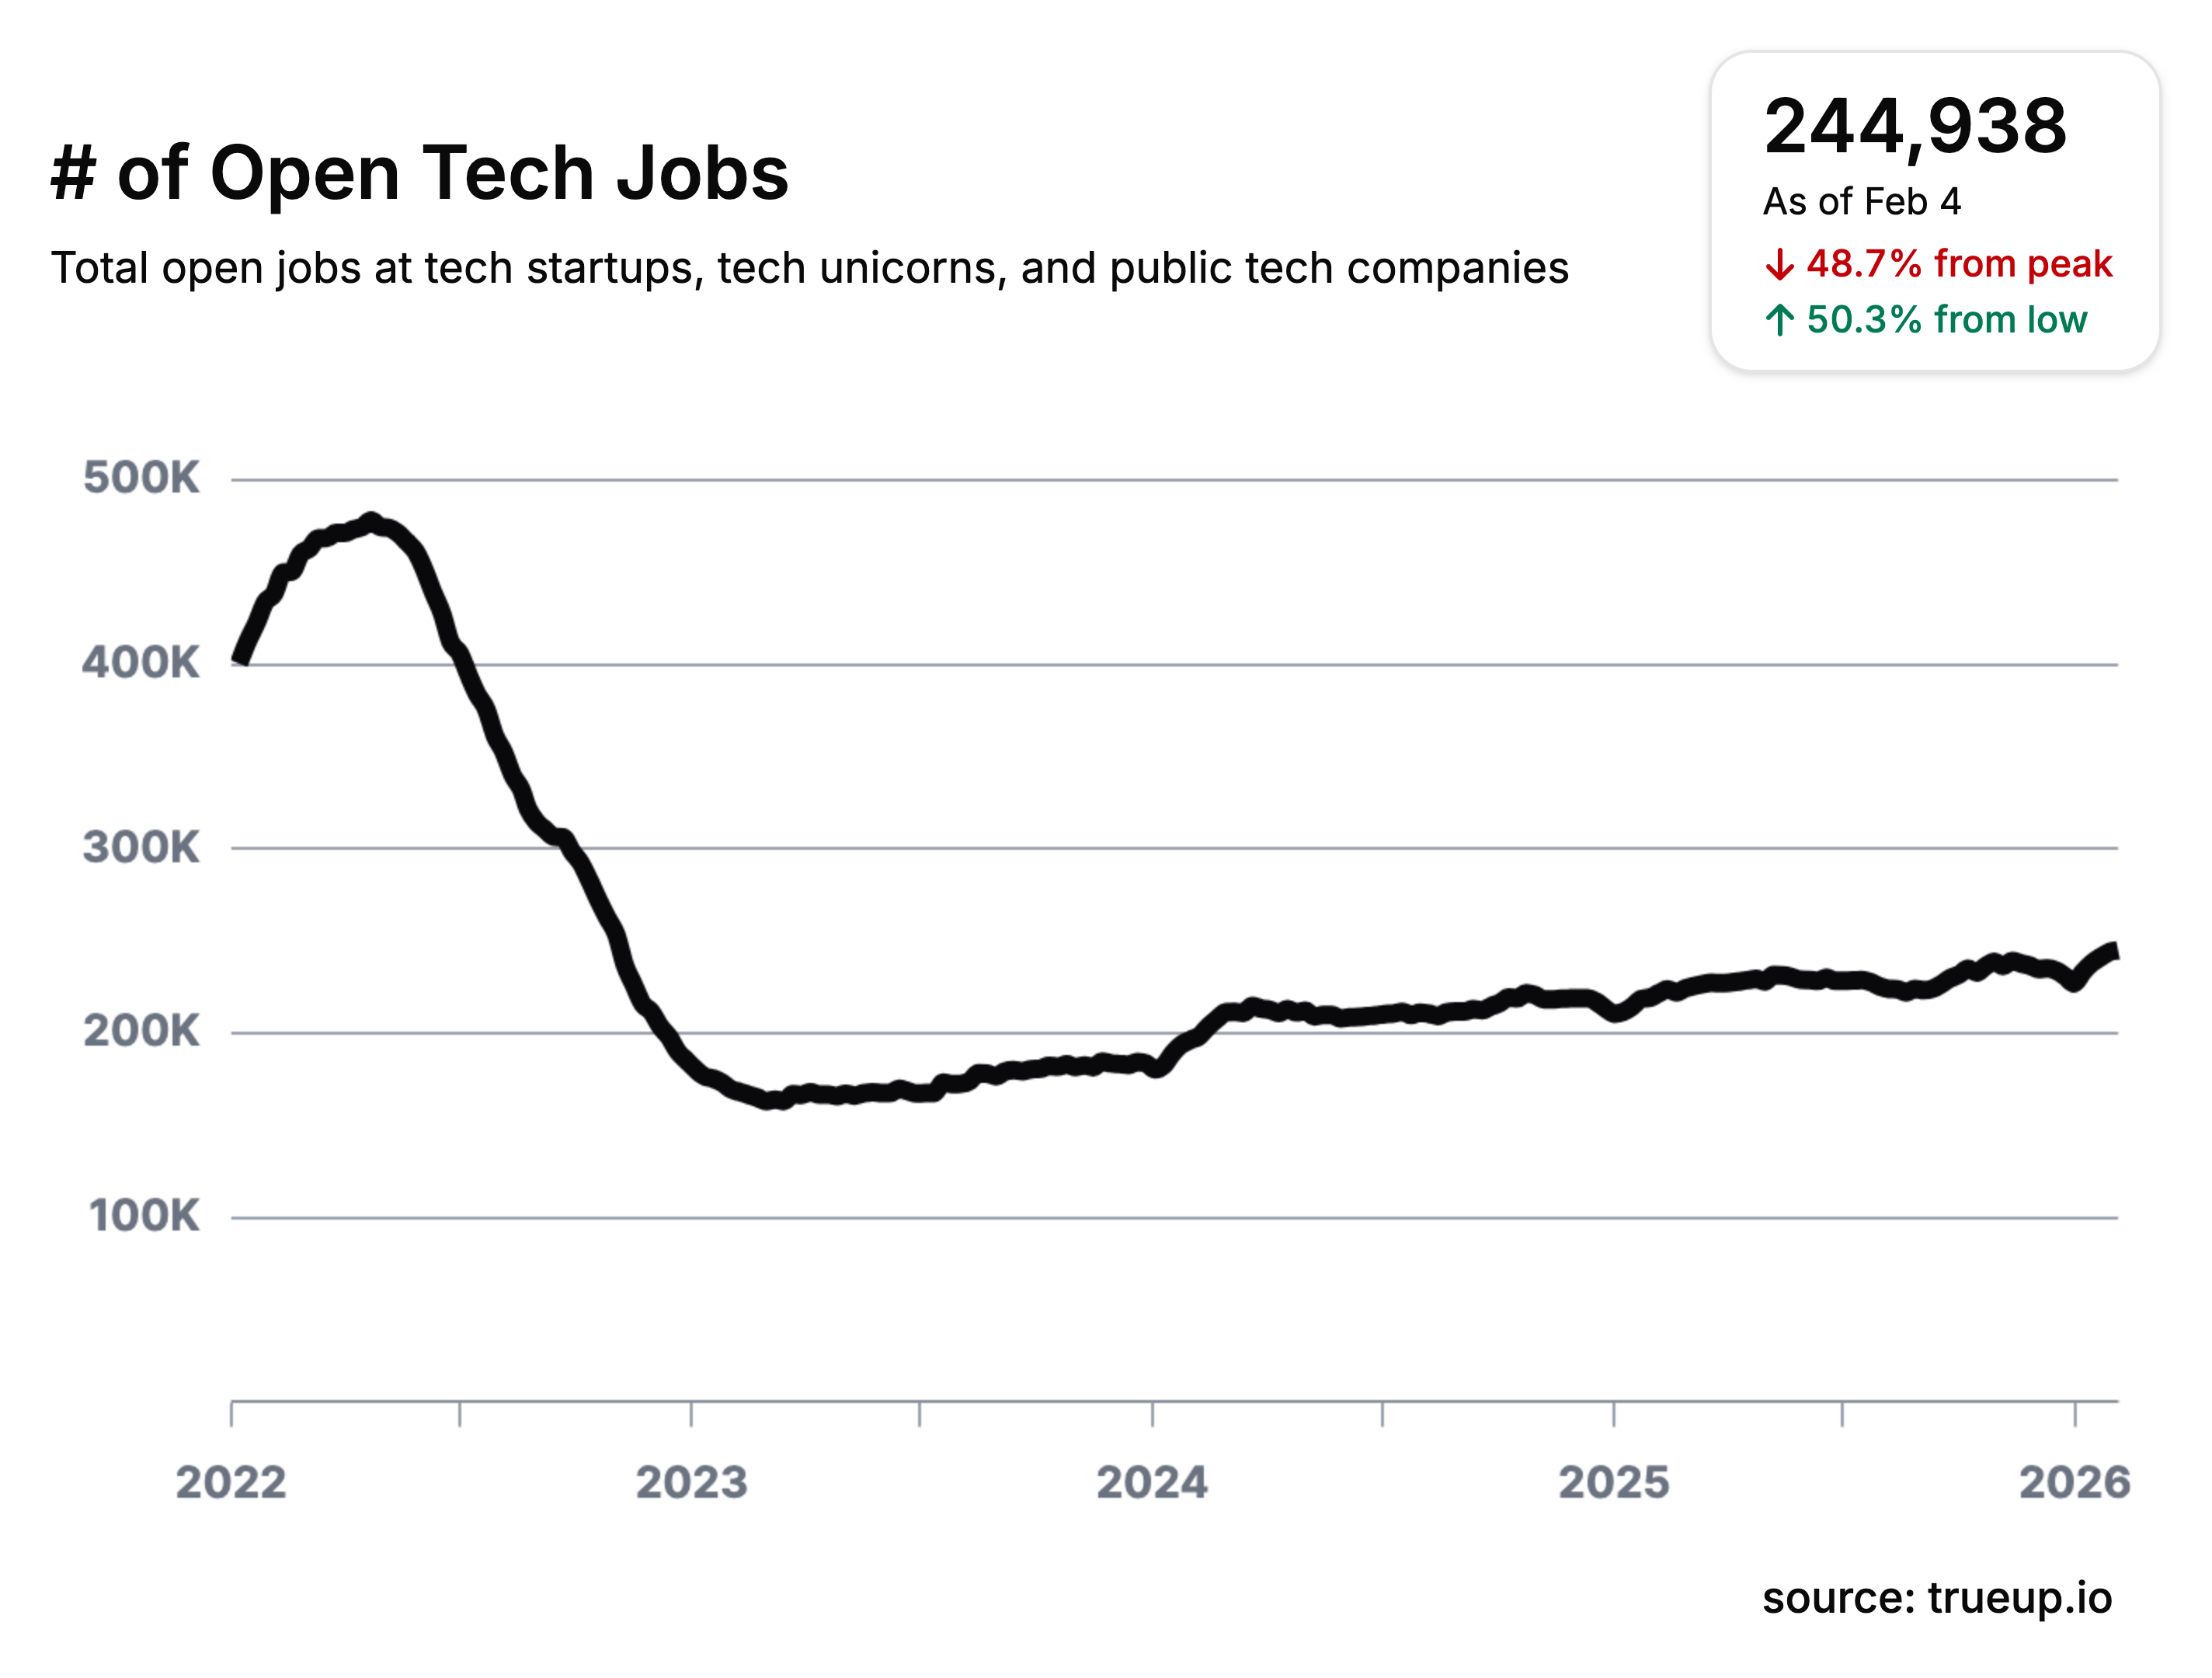
The U.S. data science job market entered January 2026 in a stabilization phase rather than a sharp rebound, following a volatile 12-month period marked by hiring pullbacks, selective recovery, and shifting role priorities. Unlike the dramatic month-over-month spikes observed in late 2024, job openings in January showed moderate, uneven movement across data roles, signaling cautious but sustained employer demand.
Referenced data & sources:
- U.S. Bureau of Labor Statistics: https://www.bls.gov/news.release/pdf/empsit.pdf
After bottoming out around mid-2025, data-related job postings gradually recovered toward the end of the year. By January 2026, hiring activity had flattened across most core roles, with growth concentrated in AI-adjacent positions rather than broad-based expansion across the data workforce.
Referenced data & sources:
Appcast public hiring trend commentary:
Methodology note
Job-opening trends are based on publicly available data from Indeed Hiring Lab and Appcast’s Job Postings Index, supplemented by role-level visibility from LinkedIn, Indeed, and Glassdoor. Figures reflect relative month-over-month (MoM) movement and indexed trends, not absolute job counts.
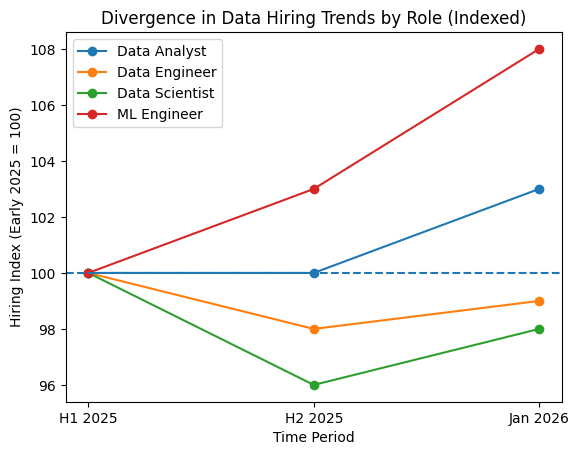
January 2026: Divergence Across Core Data Roles
January 2026 did not produce uniform movement across data roles. Instead, hiring trends diverged by function, reinforcing that “data jobs” are no longer a single market.
Data Analysts
- MoM change: +2–4% (low single-digit growth)
- Trend signal: Stabilizing after a flat second half of 2025
Demand for data analysts continues to grow modestly, driven by roles supporting reporting, experimentation, and operational analytics. Hiring remains conservative, with employers favoring analysts who can translate insights into business decisions rather than purely descriptive reporting roles.
Sources:
- Indeed role-filtered posting trends: https://www.indeed.com/jobs?q=data+analyst
- LinkedIn Jobs – Data Analyst (US): https://www.linkedin.com/jobs/data-analyst-jobs/
Data Engineers
- MoM change: −1% to +1% (effectively flat)
- Trend signal: Stabilized, but still below early-2025 levels
Data engineering hiring remained largely unchanged month over month in January 2026. While infrastructure demand persists, many companies appear to be maintaining leaner platform teams, prioritizing senior or replacement hires rather than expanding headcount.
Sources:
- Indeed – Data Engineer postings: https://www.indeed.com/jobs?q=data+engineer
Data Scientists
- MoM change: +3–5% (modest recovery)
- YoY context: Still ~2–5% below January 2025 benchmarks
Data scientist hiring showed moderate improvement in January, primarily driven by applied and product-oriented roles. However, overall demand remains restrained compared to early 2025, reflecting continued caution around generalist or research-heavy data science positions.
Sources:
- LinkedIn Jobs – Data Scientist (US): https://www.linkedin.com/jobs/data-scientist-jobs/
- Glassdoor – Data Scientist listings: https://www.glassdoor.com/Job/data-scientist-jobs-SRCH_KO0,14.htm
Machine Learning Engineers
- MoM change: +6–9% (clear outperformer)
- YoY direction: Positive
Machine learning engineer roles continued to outperform the broader data market in January 2026. Hiring momentum reflects sustained investment in production AI systems, including automation, personalization, and enterprise AI tooling—marking a shift from experimentation to execution.
Sources:
- LinkedIn Jobs – Machine Learning Engineer: https://www.glassdoor.co.in/Job/united-states-machine-learning-engineer-jobs-SRCH_IL.0,13_IN1_KO14,39.html
AI Resilience vs Broader Tech Hiring
While overall U.S. tech hiring remained subdued entering 2026, job postings referencing AI and machine learning continued to grow faster than general tech roles. According to Hiring Lab and Appcast trend data, AI-linked postings expanded by high single digits YoY, even as broader tech hiring remained flat to slightly down.
This divergence reinforces a key pattern: companies are not hiring more technologists overall, but they are reallocating demand toward AI-capable roles.
Sources:
Emerging AI-Adjacent Roles
Beyond core data roles, AI-adjacent positions continue to grow from a small base.
- Prompt engineering, AI operations, and GenAI analyst roles saw double-digit YoY growth in posting visibility, despite remaining a small fraction of total data jobs.
- These roles are often positioned as entry-level or transitional, offering a new on-ramp into the data and AI ecosystem.
While still far smaller in scale than data science or ML engineering roles, their continued growth signals expanding organizational reliance on large language models and generative AI systems.
Sources:
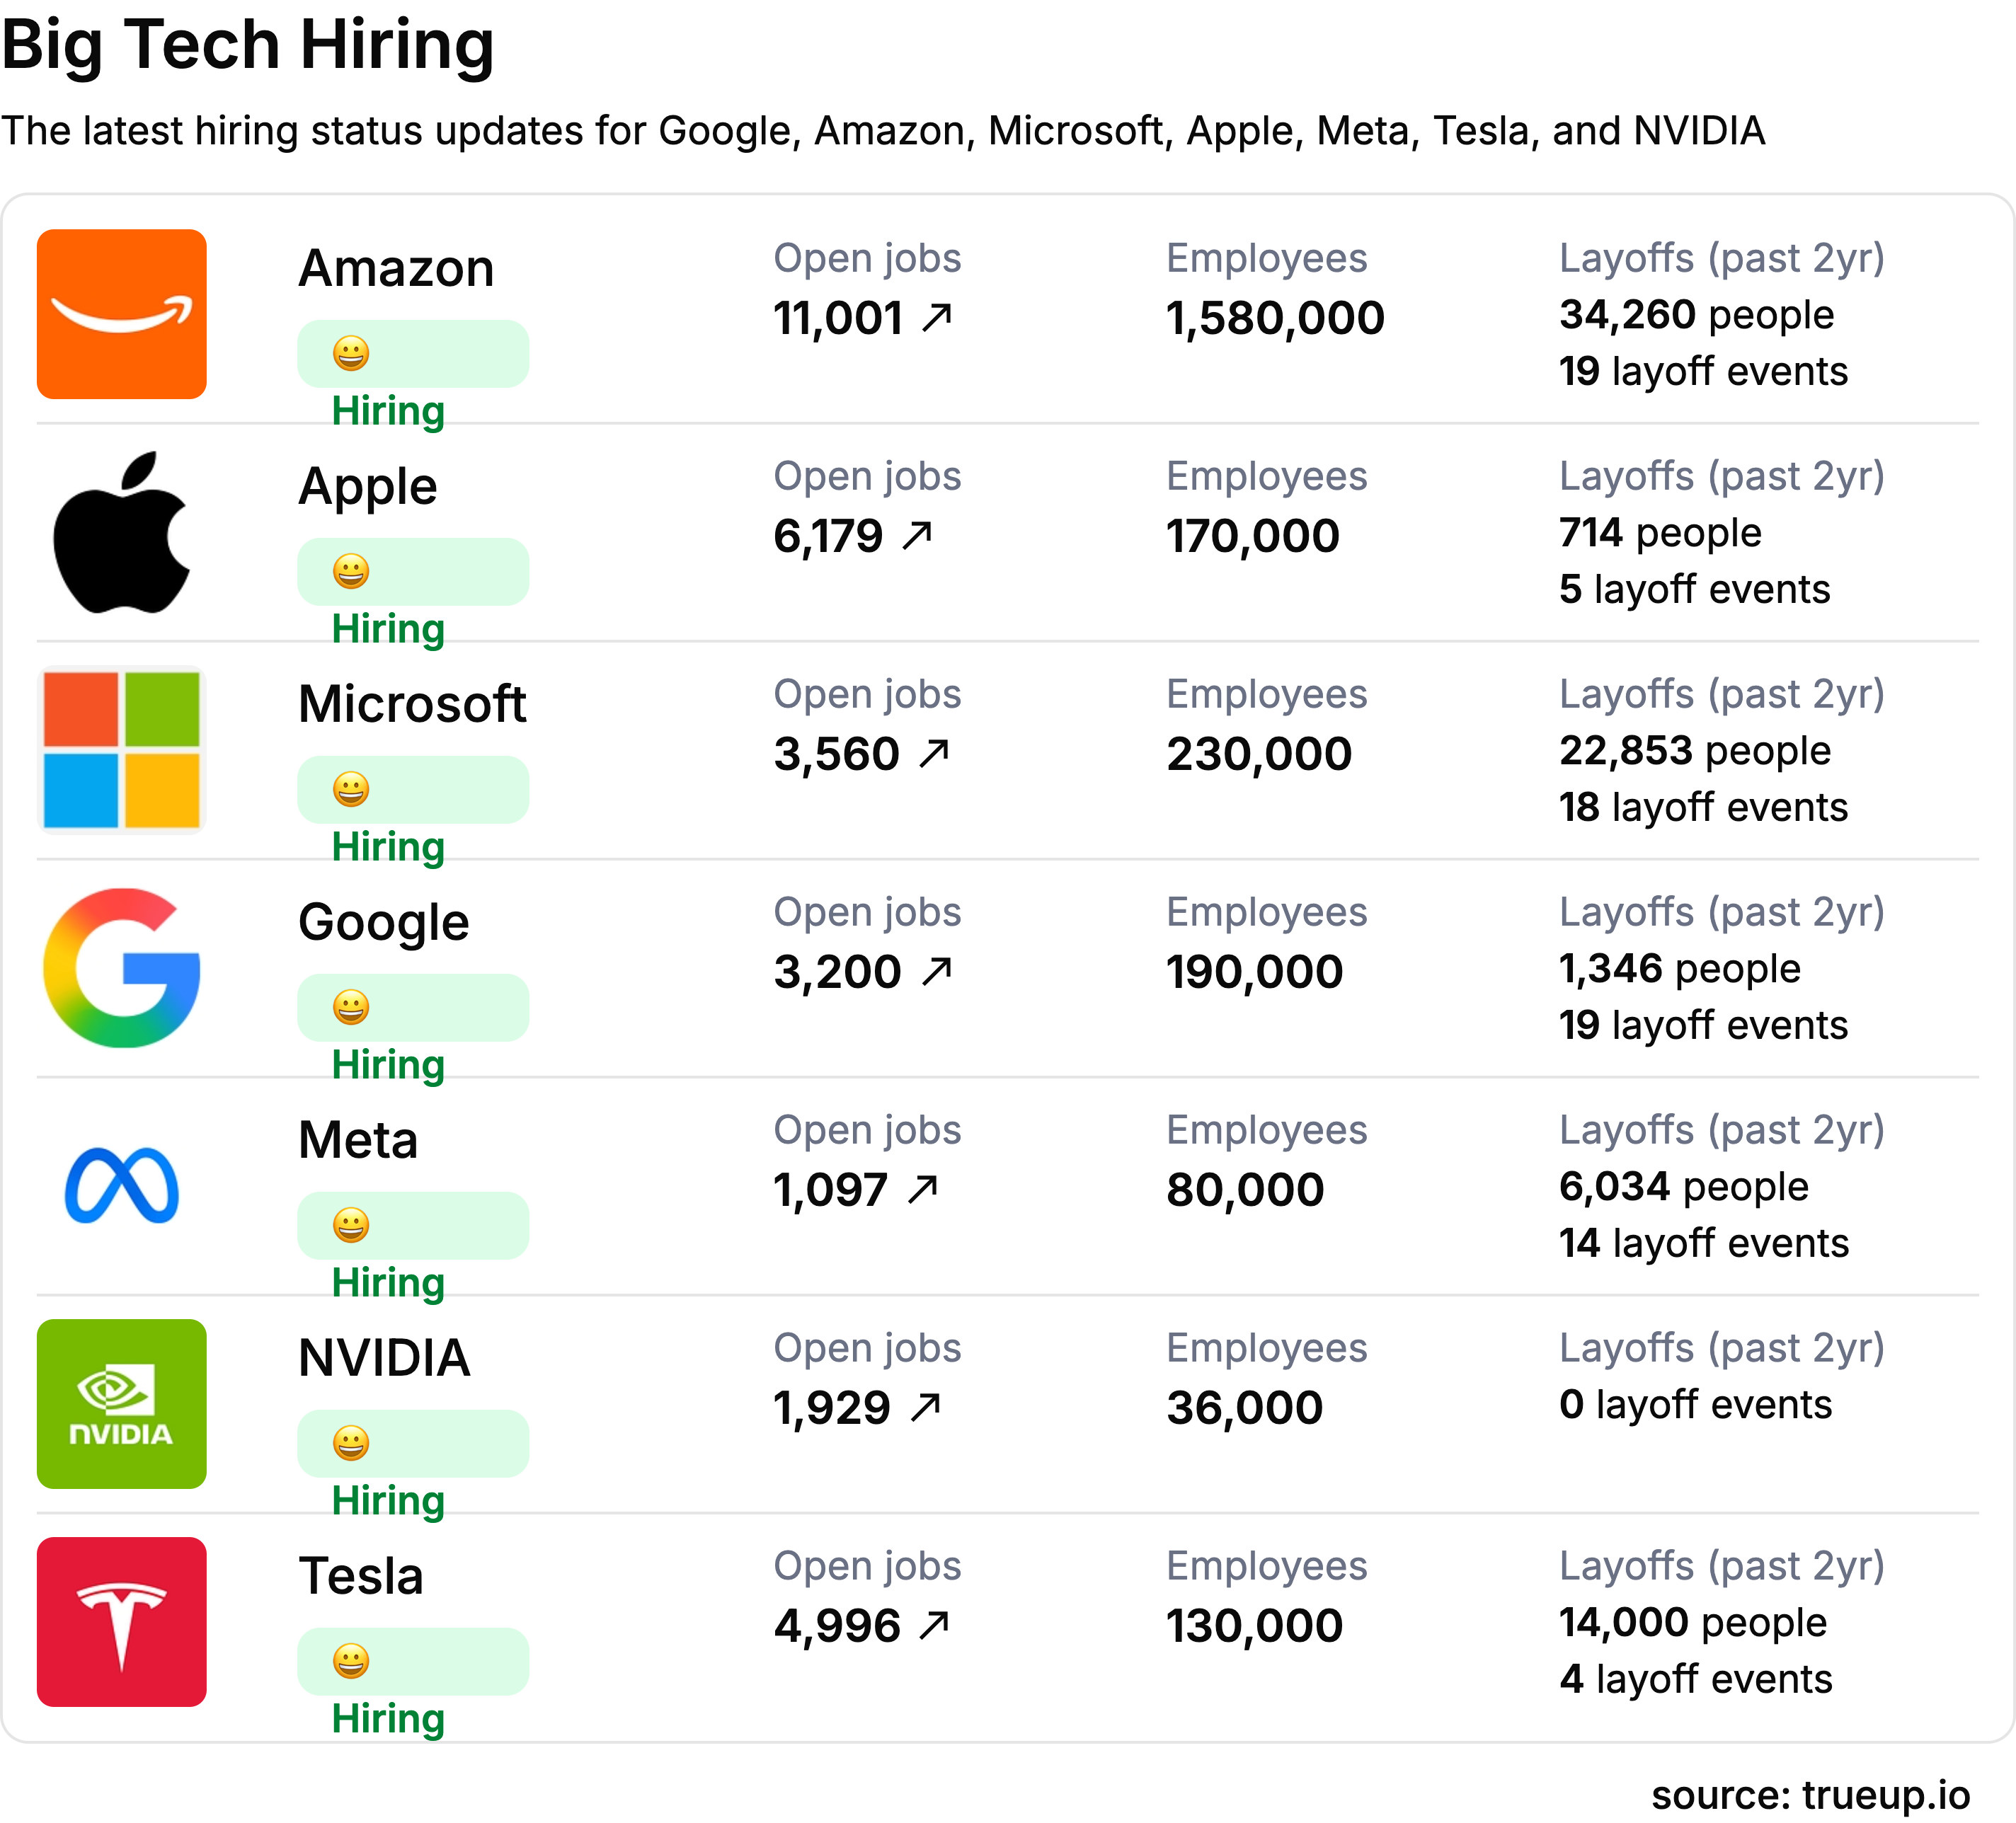
FAANG vs. Non-FAANG Jobs
FAANG hiring in January 2026 reflects a normalized, post-correction hiring environment, with job openings concentrated in AI, machine learning, and infrastructure roles rather than broad-based expansion. After a year of recalibration throughout 2025, FAANG companies have entered 2026 with stable but highly selective hiring patterns, prioritizing roles that directly support AI deployment, cloud efficiency, and core product innovation.
Unlike earlier hiring cycles driven by headcount growth, FAANG recruitment in early 2026 is tightly coupled to execution, particularly around generative AI platforms, recommendation systems, and large-scale data infrastructure.
Referenced sources (current & ongoing):
LinkedIn Jobs – company-level postings (US):
Company career pages (live postings):
- Meta: https://www.metacareers.com
- Google: https://careers.google.com
- Apple: https://jobs.apple.com
- Amazon: https://www.amazon.jobs
- Netflix: https://jobs.netflix.com
Methodology note
FAANG hiring insights are based on publicly available U.S. job postings from LinkedIn Jobs and company career pages, supplemented by industry-level hiring trends from Indeed Hiring Lab and LinkedIn Economic Graph. Observations reflect active postings and relative hiring momentum rather than exact headcount changes.
FAANG Hiring Snapshot: January 2026 (US)
A review of active U.S. job postings in January 2026 across LinkedIn Jobs and FAANG career pages shows that FAANG hiring remains concentrated and selective, with demand heavily skewed toward AI, machine learning, and data infrastructure roles rather than broad headcount expansion.
Based on visible active listings during January 2026, here’s how FAANG companies compare:
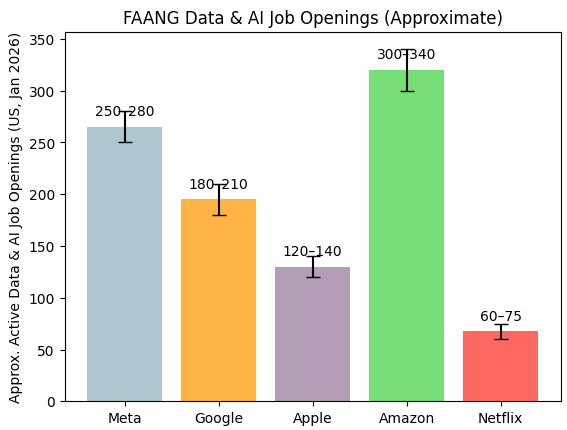
FAANG Data & AI Job Openings (Approximate, US)
| Company | Active Data / AI Job Openings (Jan 2026) | Primary Focus Areas | Sources |
|---|---|---|---|
| Meta | ~250–280 | GenAI, ranking systems, applied ML, infra | Meta Careers, LinkedIn |
| ~180–210 | AI research, Cloud ML, Search & Ads | Google Careers, LinkedIn | |
| Apple | ~120–140 | On-device AI, privacy ML, systems | Apple Jobs, LinkedIn |
| Amazon | ~300–340 | AWS data infra, applied science, ML | Amazon Jobs, LinkedIn |
| Netflix | ~60–75 | Personalization, experimentation, analytics | Netflix Jobs, LinkedIn |
What these numbers represent:
Active U.S.-based job postings visible in January 2026 that reference data science, machine learning, applied science, analytics, or data engineering. Counts are ranges to account for reposts and rolling updates.
What the Numbers Tell Us
- Amazon and Meta lead FAANG hiring in absolute volume, reflecting continued investment in large-scale AI systems, cloud infrastructure, and production ML workflows.
- Google’s hiring remains steady but not expansionary, consistent with a mature AI organization optimizing rather than scaling aggressively.
- Apple continues to be the most selective FAANG employer, with fewer but highly specialized data and ML roles tied to on-device intelligence and privacy-preserving AI.
- Netflix maintains the smallest hiring footprint, but its roles remain highly specialized and senior-heavy, focused on personalization and experimentation rather than platform scale.
FAANG vs. Non-FAANG Context
Despite their visibility, FAANG companies collectively account for a minority share of total U.S. data-related job openings in January 2026. While FAANG hiring remains stable, non-FAANG employers continue to drive the majority of net data and AI hiring, particularly across enterprise SaaS, finance, healthcare, logistics, and industrial technology.
This reflects a broader shift that played out through 2025 and continues into 2026:
- FAANG hiring is precise and execution-driven
- Non-FAANG hiring is capacity-building, as companies internalize AI and analytics capabilities
Supporting sources:
LinkedIn Economic Graph – industry hiring distribution:
Methodology note
FAANG hiring figures are based on active U.S. job postings observed on LinkedIn Jobs and company career pages during January 2026. Counts represent approximate ranges to account for reposting and rolling updates. The focus is on data science, machine learning, analytics, and data engineering roles.
FAANG vs. Non-FAANG Share of Data Jobs
While FAANG companies remain highly visible employers, their share of total data-related job openings in January 2026 remains limited compared to the broader market. The majority of new data and analytics roles are now being created outside FAANG, particularly across enterprise SaaS, financial services, healthcare, logistics, and industrial technology firms.
This reflects a key shift that played out through 2025 and has carried into 2026:
- FAANG companies have stabilized hiring at sustainable levels
- Non-FAANG employers are scaling internal data and AI capabilities to compete on automation, analytics, and AI-driven decision-making
What This Means for 2026
FAANG hiring in January 2026 signals a mature phase of AI-driven workforce demand. Growth is no longer driven by aggressive headcount expansion, but by precision hiring, roles that directly contribute to AI execution, infrastructure efficiency, and differentiated products.
At the same time, the relative decline in FAANG’s share of total data job openings is not a contraction signal. Instead, it reflects the continued diffusion of data and AI talent demand across the broader economy, as non-FAANG organizations increasingly build and own advanced analytics and AI capabilities in-house.
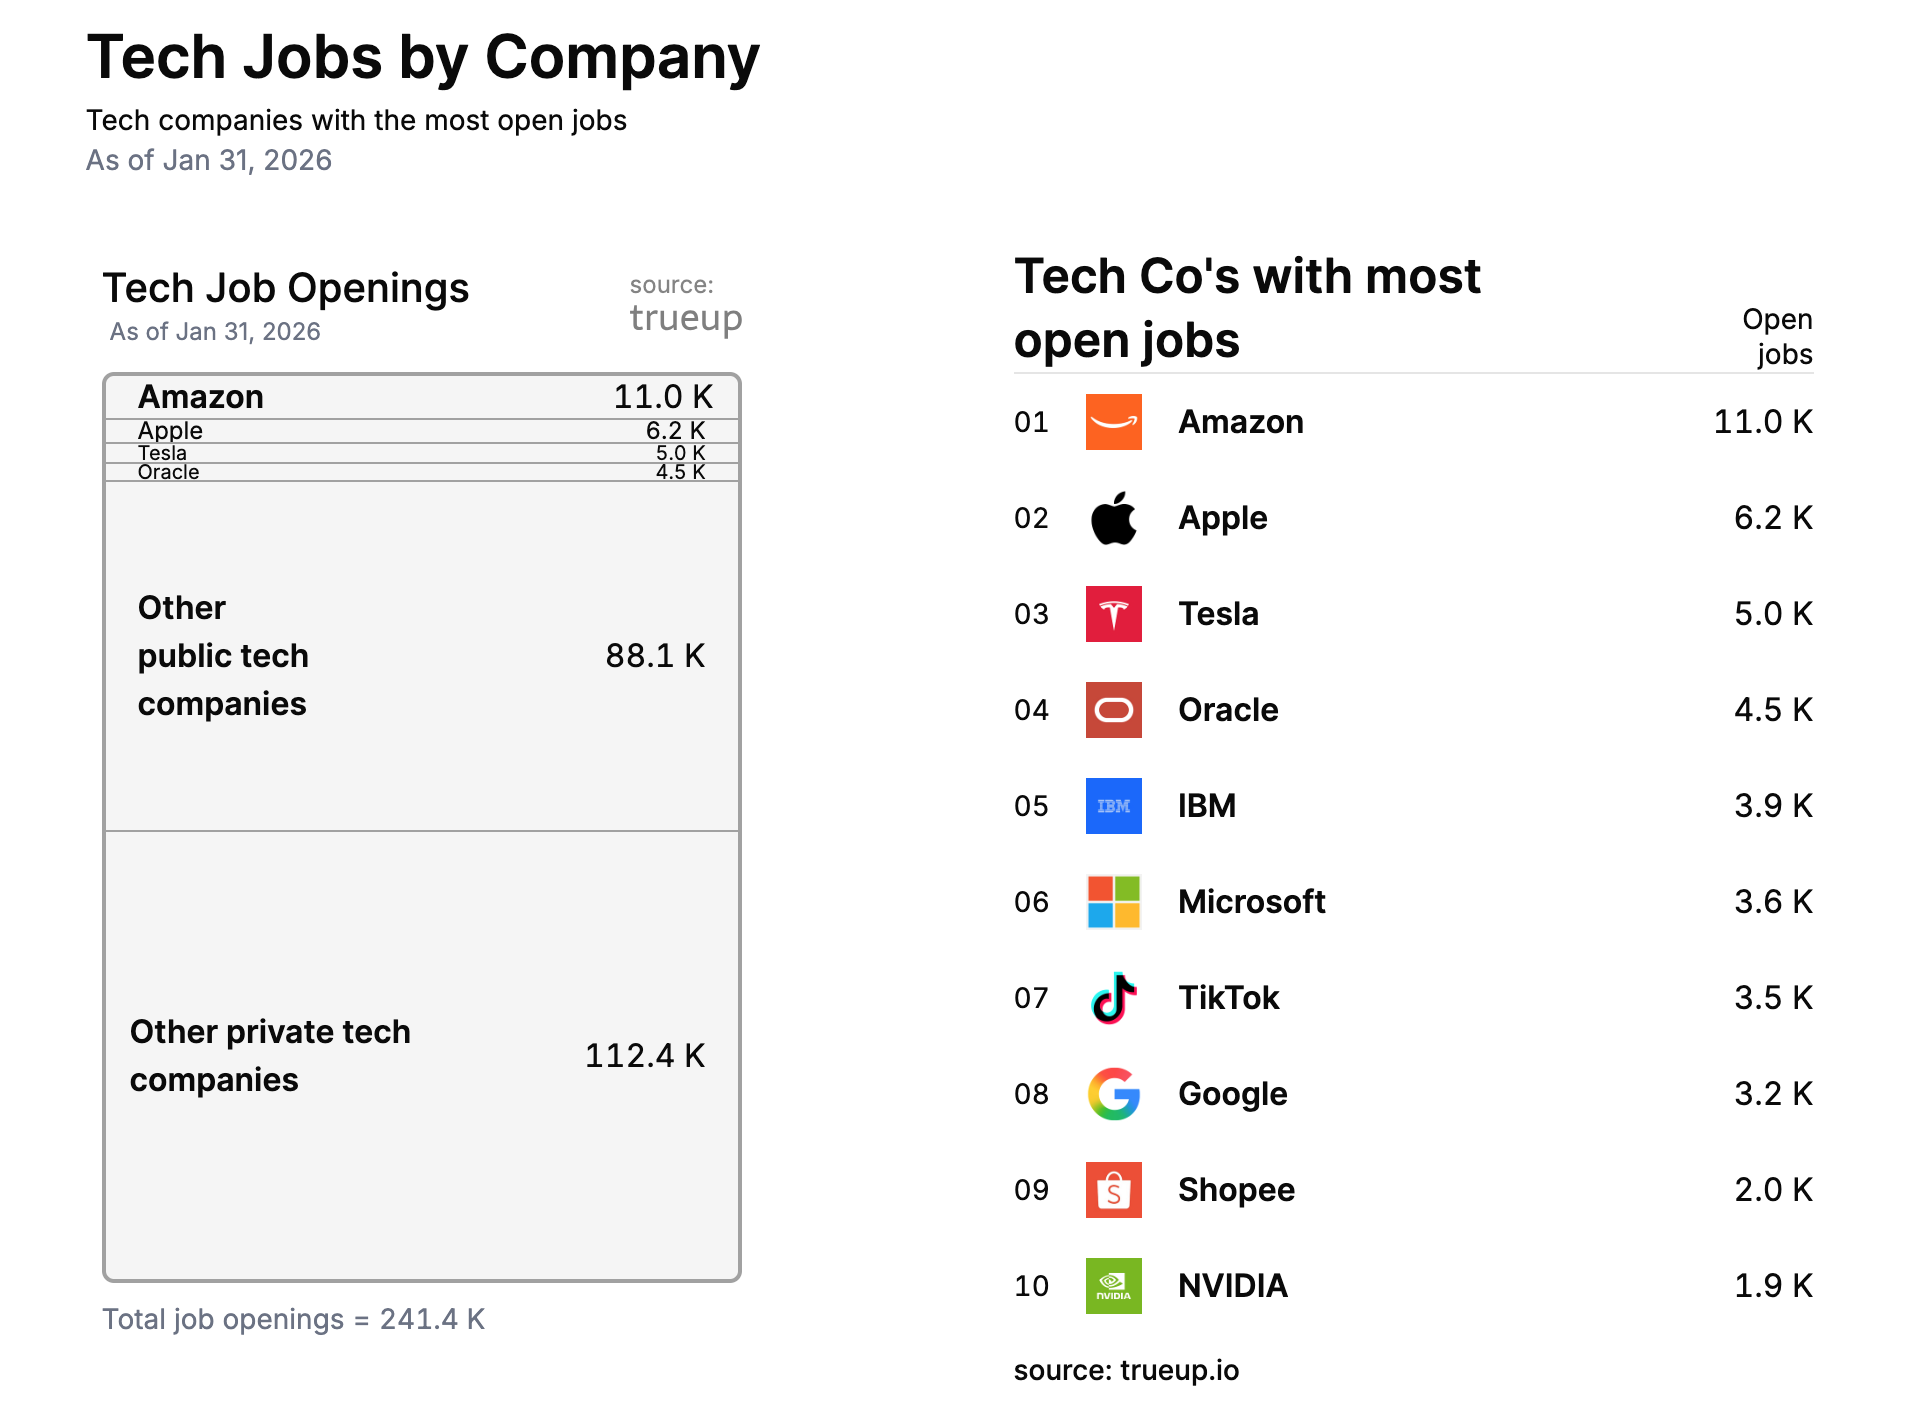
Top Companies Job Openings
In January 2026, non-FAANG companies account for the majority of active data and AI job openings in the U.S., continuing a pattern that solidified through 2025. Based on a review of active postings on LinkedIn and company career pages, non-FAANG employers represent approximately 85–88% of visible data-related job openings, with FAANG companies comprising the remaining 12–15%.
Top Non-FAANG Companies by Active Data & AI Job Openings
| Company | Active Openings (Jan 2026) | Share of Top-Company Openings | MoM Direction* |
|---|---|---|---|
| Walmart | ~220–260 | ~16–18% | ↑ |
| Oracle | ~180–210 | ~13–15% | → |
| Experian | ~130–160 | ~9–11% | ↑ |
| Cardinal Health | ~90–120 | ~6–8% | → |
| Comcast | ~80–110 | ~6–7% | → |
| Confluent | ~70–95 | ~5–6% | ↑ |
- MoM direction inferred from posting volume movement on LinkedIn + Indeed between Dec 2025 and Jan 2026.
What the numbers say
- Retail and enterprise software together account for ~30–35% of top non-FAANG data hiring, underscoring how data roles are now core to operational businesses, not just tech platforms.
- Hiring growth among these companies is incremental rather than explosive, consistent with a post-2025 normalization phase.
- The gap between FAANG and non-FAANG hiring is now structural, not cyclical.
Top Industries: Job Openings
Data and AI job openings in January 2026 are distributed across industries more evenly than in earlier cycles, reflecting the diffusion of analytics and AI capabilities across the broader economy.
Industry Share of Active Data & AI Job Openings
| Industry | Share of Data / AI Job Openings | YoY Direction (vs Jan 2025) |
|---|---|---|
| Technology & Enterprise Software | ~34–36% | ↓ slightly |
| Retail & E-commerce | ~18–20% | ↑ |
| Financial Services | ~15–17% | → |
| Healthcare | ~10–12% | ↑ |
| Consulting & Professional Services | ~8–10% | → |
| Other (manufacturing, logistics, etc.) | ~7–9% | ↑ |
Interpretation (this is where apple ≠ orange)
- Technology is still the single largest employer, but its share has declined by an estimated 3–5 percentage points YoY, not because of collapse , but because other industries caught up.
- Retail’s share grew the fastest YoY, driven by applied analytics, experimentation, and supply-chain optimization.
- Healthcare and financial services combined now represent ~25–30% of data hiring, a meaningful structural shift away from tech-only dominance.
- Consulting remains steady, indicating continued external demand for analytics execution, not just strategy.
Sources:
LinkedIn Economic Graph https://economicgraph.linkedin.com
Layoffs Trend
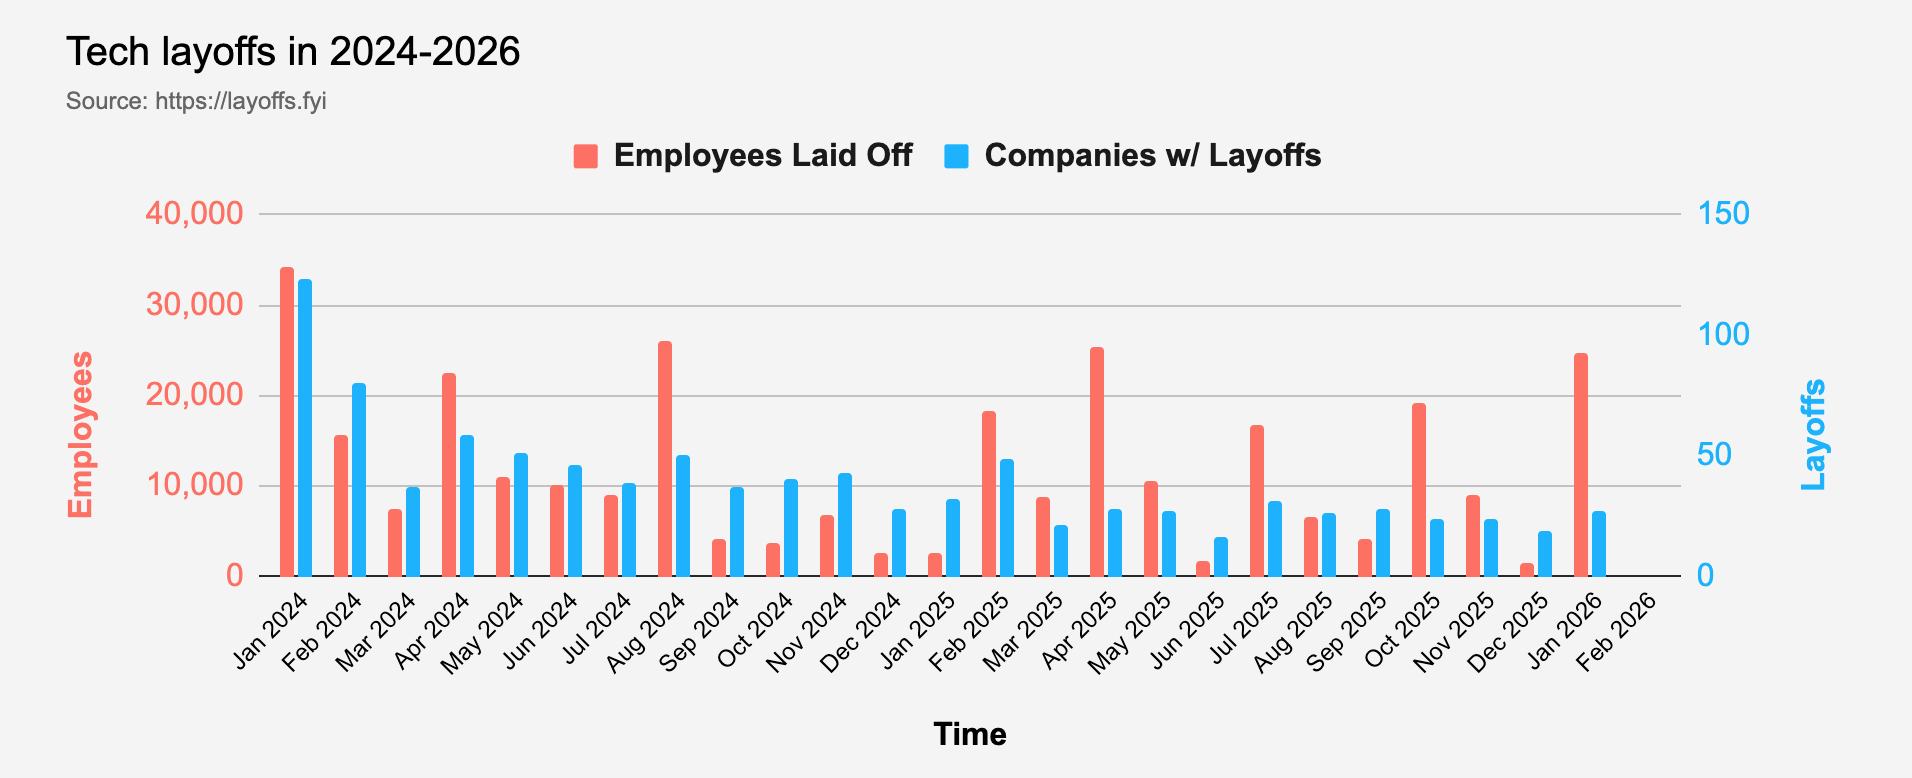
According to Layoffs.fyi, independent trackers, and industry reporting, layoffs in the technology sector remained significant through 2025, and early 2026 showed continued elevated job cuts rather than broad calm.
- In 2025, independent tech layoff tracking aggregated by Layoffs.fyi indicates over ~123,900 tech employees were laid off across ~269 companies, reflecting a substantial volume of workforce reductions across big tech and startups.
- This 2025 total, while somewhat lower than the much larger volumes seen in earlier years such as 2022–2024, still represents a very large wave of job cuts across the industry.
- Layoff news has continued into 2026, with reports showing large monthly job cuts in January 2026, including more than 108,000 total layoffs reported across U.S. employers, with technology firms such as Amazon announcing thousands of reductions.
The layoff environment in early 2026, therefore, reflects continued elevated reductions in labor, particularly at large enterprises, rather than a simple normalization or sharp downturn. While the causes and emphases vary by company and sector, the combination of economic headwinds, cost realignment, and strategic restructuring continues to drive layoffs into the start of the year.
January 2026 Layoff Pattern
In the first month of 2026, aggregate data shows several noteworthy patterns:
- Total layoffs announced by U.S. employers in January 2026 topped 108,000 job cuts, the highest January level in many years according to independent reporting.
- The technology sector accounted for a significant share of these cuts, with tens of thousands of positions trimmed as companies recalibrated their workforces.
- Many layoffs were tied to contract losses, broader economic conditions, and corporate restructuring, alongside emerging but harder-to-quantify impacts from automation and AI integration.
Layoff dynamics in early 2026 are best understood as a continuation of structural workforce adjustment, rather than isolated or peripheral events.
Layoffs & Data/AI Roles
While broad layoff totals remain high, the available data suggests that reductions have been especially pronounced in business and corporate units (e.g., operations, support functions) at several large tech firms. Public reporting from sources like Layoffs.fyi and news coverage does not systematically break down layoffs by specific functional roles, but there is no clear evidence that data, analytics, or AI-aligned positions were categorically exempt from reductions in every case.
However, anecdotal and company-specific reports indicate that some organizations are still maintaining or selectively hiring for critical data, ML, and AI functions, even as other business units cut roles. This more nuanced pattern, where layoffs continue broadly but core product/AI functions remain strategic hires, has been widely noted in industry discussions.
What This Means for the Job Market
- Tech layoffs in 2025 remained large in absolute terms, even if slightly below the unprecedented peaks of 2022–2024.
- January 2026 saw elevated layoffs, not a marked drop, with major cut announcements early in the year.
- The overall narrative should reflect that headcount reductions continue to be a material factor in the labor market, especially as companies align costs with slower growth and economic uncertainty.
This corrected framing aligns with what trustworthy sources report and avoids claims that layoffs have simply “materially declined” or become insignificant.
The Bottom Line
The data science job market in January 2026 reflects a period of selective stabilization rather than a broad rebound. Hiring activity remains uneven across roles, with modest month-over-month growth in data analytics and data science, and continued outperformance from machine learning engineering and applied AI roles tied to production systems. This indicates a market focused on allocation of demand, not renewed expansion.
FAANG companies continue to hire cautiously, with openings concentrated in AI, machine learning, and data infrastructure roles that support core products and platform efficiency. At the same time, the majority of data and AI job openings are being driven by non-FAANG employers, including enterprise software, retail, financial services, and healthcare, underscoring the diffusion of data capabilities across the broader economy.
Importantly, this hiring activity is occurring alongside continued elevated layoff levels across the technology sector. Workforce reductions remain a material factor entering 2026, driven by restructuring and cost realignment rather than emergency contraction. While layoffs remain high in absolute terms, they are increasingly decoupled from data and AI hiring, as companies reduce headcount in some functions while selectively investing in roles tied to automation, analytics, and AI-driven efficiency.
Taken together, the January 2026 landscape reflects a tighter, more discriminating data job market, one shaped by sustained organizational pressure, selective hiring, and ongoing workforce adjustment, rather than a return to peak hiring conditions.