
Thomson Reuters Data Scientist Interview Guide: Questions, Process & Salary


Introduction
Thomson Reuters is a global powerhouse in content-driven technology: its brands like Reuters and Westlaw, deliver trusted news, legal, tax, and risk intelligence to professionals around the world. Lately, the company has doubled down on artificial intelligence, acquiring firms focused on AI-powered document processing and contract intelligence, and investing heavily in “content + tech” to sharpen its competitive edge.
In this environment, a data scientist role at Thomson Reuters isn’t just your standard ML/data job — you’ll be building models and statistical frameworks that feed into real-world legal, financial, and media products, working on proprietary and complex datasets, and helping ensure outcomes that reflect the company’s core values: accuracy, integrity, and independence. The demand and compensation for such roles have been rising sharply: in 2025, mid- and senior-level data scientist positions are commonly commanding base salaries between US$130,000 to over US$200,000, depending on experience, specialization, and industry.
This blog post will walk you through what the role actually involves, what the company culture is like, the interview process you’ll face, and key tips to help you succeed.
Role Overview & Culture
In this role, expect a dynamic mix of applied research and production-level implementation. You’ll work on projects like natural language processing for real-time news classification, predictive analytics for legal risk, or entity disambiguation in massive data lakes. The culture is built around data‑driven decision‑making, cross-functional collaboration, and a strong emphasis on research-backed experimentation. Teams often include a mix of data scientists, engineers, and subject-matter experts, and there’s a high regard for peer review and publishing when applicable. Across the organization, there’s a clear respect for both scientific rigor and engineering execution, supported by open communication and diverse perspectives.
Day-to-Day Responsibilities
- Apply research to production systems, balancing experimentation with deployment.
- Build and refine NLP models for real-time news classification.
- Develop predictive analytics tools for legal risk detection.
- Design entity disambiguation methods in large-scale proprietary data lakes.
Culture
- Driven by data-backed decision-making at every level.
- Encourages research-backed experimentation and innovation.
- High value placed on peer review and publishing contributions.
Team Setting
- Cross-functional groups combining data scientists, engineers, and domain experts.
- Collaboration across legal, financial, and media product teams.
- Open communication fosters diverse perspectives and creative problem-solving.
Expectations
- Uphold scientific rigor while ensuring practical engineering execution.
- Balance short-term product needs with long-term research goals.
- Contribute to both innovation and reliable delivery.
Unique Perks
- Opportunity to work with some of the world’s largest proprietary legal and financial datasets.
- Culture that recognizes both academic-style research and real-world application.
- Visibility and impact across industries — from law and finance to global media.
Why This Role at Thomson Reuters?
This isn’t just another data science job—you’ll have the chance to work with rare, large-scale datasets, including decades of legal, tax, and financial data. Your models won’t just serve ads—they’ll support journalists uncovering fraud, or help legal teams assess litigation risk. The Data Scientist pay at Thomson Reuters is competitive, with generous base, performance bonus, and equity components. Add to that a strong mission-driven culture and flexible remote work policies, and it’s no surprise this role is highly sought after.
To help you prepare, here’s what the interview process looks like:
What Is the Thomson Reuters Data Scientist Interview Process?
The interview process for a Data Scientist role at Thomson Reuters is structured, efficient, and emphasizes both technical depth and business impact. Candidates frequently describe it as fast-moving but fair, typically progressing from initial screenings to a mix of technical assessments, practical case work, and behavioral conversations. Throughout, the company values a candidate’s ability to extract insights from data, communicate clearly, and align with its mission of delivering trusted information at scale. From the first recruiter call to the final hiring committee, the experience tests both modeling skills and product sense—ensuring applicants can thrive in collaborative, data-rich environments.
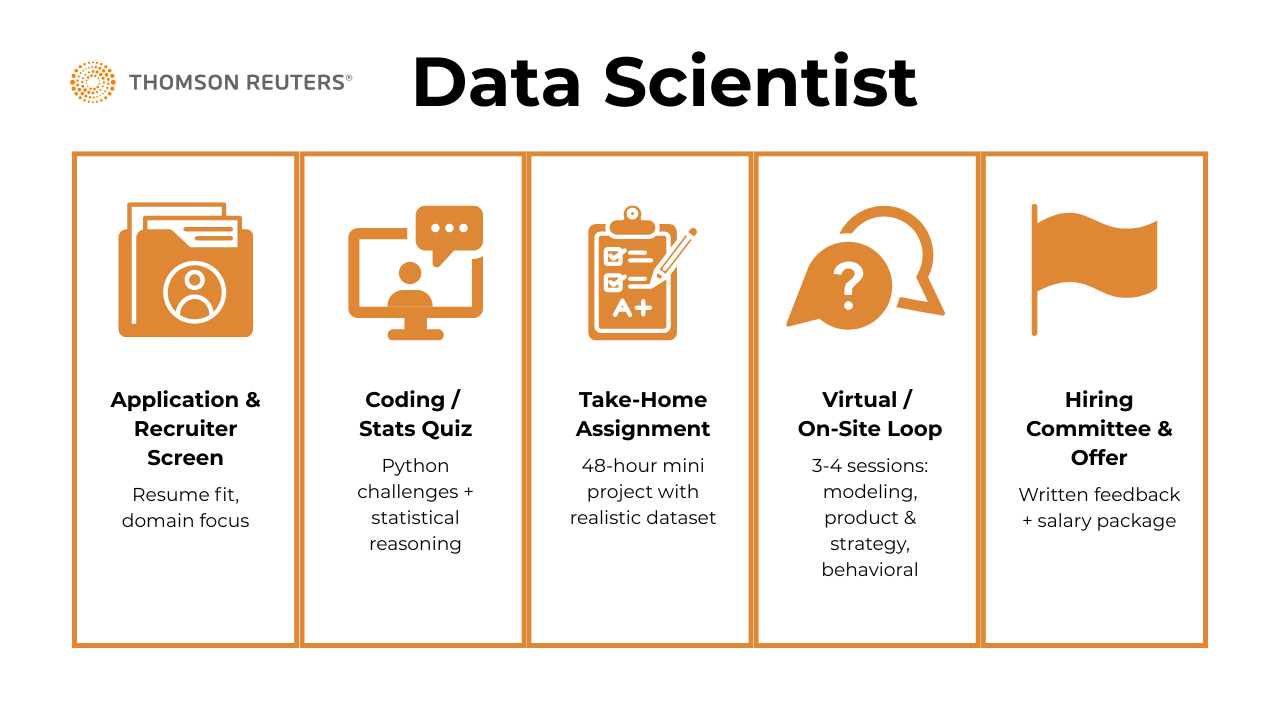
Application & Recruiter Screen
After applying online or via referral, selected candidates are contacted by a recruiter for an initial screening. This stage is primarily used to evaluate résumé alignment, domain interest (such as legal, financial, or news analytics), and general career trajectory. Expect questions on your past projects, motivations for applying, and availability. It typically lasts about 20–30 minutes.
Tips
- Tailor your résumé with keywords that match the job description.
- Be prepared to explain why you’re interested in Thomson Reuters specifically (e.g., AI in legal/financial data).
- Practice a clear 60-second “career story” that highlights relevant experiences.
Online Coding/Stats Quiz
Candidates who pass the recruiter screen are invited to complete a timed online assessment. This consists of a blend of Python coding challenges and statistical reasoning questions. Topics often include basic data manipulation (e.g., groupby operations, filtering, joins), hypothesis testing, and simple functions to calculate distributions or simulate logic. While there are no advanced algorithmic problems, the time constraint requires fluency with pandas and strong problem-solving ability.
Tips
- Brush up on pandas essentials (
groupby,merge,pivot,apply). - Practice hypothesis testing and confidence intervals with simple examples.
- Work under time limits to simulate the real test environment.
Take‑Home Data Science Assignment
This is the most critical stage in the process. Candidates receive a realistic business dataset—often related to customer behavior, pricing optimization, or classification tasks—and are given 48 hours to complete a mini-project. Deliverables usually include a Jupyter notebook or PDF report with EDA, modeling approaches, evaluation metrics, and strategic recommendations. This data science assignment tests end-to-end thinking: not just coding, but also interpretation and storytelling. Strong candidates demonstrate well-structured code, thoughtful feature engineering, clean visualizations, and clear communication of trade-offs in model selection and performance.
Tips
- Start with EDA: visualize distributions and correlations before modeling.
- Focus on clarity—comment your code and explain assumptions.
- Don’t over-engineer; simple, interpretable models often score higher.
- Present actionable insights, not just metrics—recommend what the business should do.
- Use our Take-Home Evaluator to benchmark your project against real hiring standards and get feedback before submitting.
Virtual/On‑Site Loop
Candidates who advance to the final round go through a loop of interviews—typically 3 to 4 sessions—either on-site or virtually. These cover a blend of technical rigor and product sense, reflecting Thomson Reuters’ emphasis on real-world, scalable data solutions.
Modeling Deep Dive
You’ll walk through your take-home project or a previous work sample, with follow-up questions on feature selection, evaluation metrics, and model explainability. Interviewers will often probe your reasoning behind model choices and your ability to handle trade-offs between interpretability and performance. You may be asked to live-code a small adjustment (e.g. reworking a pipeline step, testing an alternative feature) or explain snippets of your own code to assess structure and clarity.
The balance here leans about 60% coding execution and 40% communication/storytelling—they want to see that you can structure pipelines logically, write maintainable code, and clearly articulate results. The emphasis is more on data cleaning, transformation, and model design rather than building ML ops infrastructure or production-level systems. Forecasting tasks may come up, but exploratory data analysis and deriving insights from business-relevant patterns are more central.
Tips
- Be ready to justify why you chose specific models and metrics.
- Practice explaining trade-offs between accuracy and interpretability.
- Show confidence walking through your own code line by line.
Product & Strategy Thinking
In this round, the focus shifts toward applying your technical skills to ambiguous business problems. You may be given a product scenario (e.g., “Churn is rising in a key market—what would you analyze?”) and asked to propose a framework for investigation. This includes identifying relevant data, selecting appropriate metrics, estimating impact, and explaining how you would communicate results to stakeholders.
Here, the balance flips: 70% product thinking, 30% technical fluency. They’re not looking for precise code, but rather for how you frame a problem, break it down, and make informed prioritization decisions. Effective storytelling, business judgment, and clarity of thought take precedence over syntax. Candidates who perform well often blend strategic thinking with practical intuition about timelines, stakeholder needs, and experimentation design.
Tips
- Use a clear framework (e.g., define problem → data needed → metrics → action plan).
- Communicate assumptions transparently—don’t ignore data gaps.
- Show awareness of stakeholder priorities and trade-offs.
Behavioral Interview
Focused on collaboration, communication, and Thomson Reuters’ trust-driven culture. You’ll field questions such as “Tell me about a time you had to influence a decision-maker with data” or “How do you handle pushback from non-technical teams?” These help assess cultural fit and your ability to build consensus across cross-functional teams.
Tips
- Use the STAR method (Situation, Task, Action, Result) for structured answers.
- Prepare 2–3 stories highlighting teamwork, influence, and resilience.
- Tie your examples back to Thomson Reuters’ values: accuracy, independence, integrity.
Hiring Committee & Offer
Following the final round, interviewers submit written feedback within 24 hours. A cross-functional hiring committee reviews all assessments in aggregate—looking for strong technical bar and team fit. If approved, the recruiter will follow up with a verbal offer, often including details on base pay, performance bonus, and RSUs.
Behind the Scenes
Thomson Reuters maintains a tight feedback loop across interviewers, with shared scoring rubrics and panel calibrations to ensure fairness and consistency. The turnaround from final interview to decision is typically quick—often within a week. In post-interview discussions, special attention is given to both technical completeness and clarity of communication.
Differences by Level
Senior-level data scientist candidates go through one additional round focused on product strategy and stakeholder leadership. This may involve a case study or scenario where the candidate must outline a data-driven roadmap, prioritize competing metrics, or respond to a rapidly shifting business environment. Expectations for coding remain practical, but there’s greater emphasis on architecture, experimentation strategy, and cross-team influence.
Challenge
Check your skills...
How prepared are you for working as a Data Scientist at Thomson Reuters?
What Questions Are Asked in a Thomson Reuters Data Scientist Interview?
Thomson Reuters’ data scientist interviews span a well-rounded mix of coding, statistical modeling, business problem-solving, and behavioral evaluation. Candidates are expected to demonstrate fluency in core tools like Python and SQL, sound statistical reasoning, and the ability to communicate data-driven insights clearly. Below are the key question categories and what to expect in each.
Coding/Technical Questions
This round focuses on assessing your practical coding ability—especially when it comes to manipulating real-world datasets. Expect hands-on exercises involving SQL queries, pandas data wrangling, or writing functions to clean, transform, or aggregate data. These are not algorithmic puzzles but rather direct tasks that test how efficiently you can extract insights from structured or messy input. A common challenge involves implementing A/B test metrics—like computing conversion rates, confidence intervals, or lift—within tight time constraints, simulating a real-time analytical support environment.
Group a list of sequential timestamps into weekly lists starting from the first timestamp
Approach this with date arithmetic and slicing in Python. You want to iterate through the list while maintaining buckets that restart every 7 days. Pay attention to edge cases like timezone-aware timestamps or gaps. This is a great way to demonstrate data munging and time-series preparation skills.
Tips
- Use
datetime.timedelta(days=7)to define week boundaries. - Always convert timestamps to a consistent timezone before grouping.
- Test with both small and large gaps to validate edge cases.
- Use
Calculate the first touch attribution channel per customer
Use window functions like
ROW_NUMBER()orMIN()partitioned by user ID to isolate the first channel touch. Ensure proper ordering by timestamp. This type of query often appears in growth or marketing analytics use cases. It’s especially relevant to data scientists supporting customer journey insights.Tips
- Index your timestamp column for faster queries.
- Double-check sorting logic (
ORDER BY event_time ASC). - Practice with sample marketing funnel datasets for context.
Write a function to return the top N frequent words from a string
Use
collections.Counteror a dictionary to count word frequency. Normalize case and remove punctuation for consistency. Sorting the frequency dictionary gives the top N. This kind of text wrangling is helpful in any NLP-related task.Tips
- Pre-clean text with regex to strip punctuation.
- Convert all words to lowercase for consistency.
- Handle ties by defining secondary sort rules (e.g., alphabetical).
Write a Pandas function to calculate cumulative bucketed test scores for students
Use
groupby()andcumsum()to track cumulative scores. You’ll also need binning logic to group test scores into buckets. Keep edge cases like nulls or non-numeric types in mind. A practical scenario when analyzing education or assessment data.Tips
- Use
pd.cut()orpd.qcut()for score binning. - Watch for missing scores and decide how to handle them.
- Validate cumulative sums by checking totals against raw scores.
- Use
Calculate the number of users who made upsell purchases after initial conversion
This SQL query tests your ability to track user behavior over multiple transactions. Use
JOINs orEXISTSclauses to filter users who made sequential purchases. Consider how to define a qualifying upsell. It’s a common behavioral analysis task in SaaS and ecommerce.Tips
- Define “upsell” explicitly (e.g., higher-value plan, add-on purchase).
- Use
DISTINCT user_idto avoid double counting. - Test logic with sample timelines to ensure sequence accuracy.
Stem words in a sentence using the shortest root form from a dictionary
Implement a Trie or efficient string replacement logic. Handle cases where multiple stems might match the same word. Preprocess words carefully to avoid partial matches. An important question for demonstrating text preprocessing in NLP projects.
Tips
- A Trie ensures faster lookup compared to scanning all stems.
- Normalize input words to lowercase before matching.
- Test with ambiguous stems (e.g., “run” vs. “runner”) to avoid errors.
Summarize sales data by showing each customer’s most purchased product
Use
groupby()andidxmax()or similar logic to find the most frequent item. This task shows your grasp of aggregation and filtering in Pandas. A classic example of market basket or retail behavior analysis.Tips
- Check for ties when two products are purchased equally often.
- Use
value_counts()per group as a quick alternative. - Validate results against raw counts to ensure accuracy.
Statistics & Machine‑Learning Case Questions
In this segment, you’ll be tested on your statistical reasoning and ability to apply machine learning techniques to ambiguous or high-impact business scenarios. You may be asked to interpret logistic regression coefficients in the context of risk scoring or fraud detection, explain trade-offs between precision and recall, or recommend appropriate evaluation metrics for imbalanced classification problems (such as identifying critical news alerts). These questions aim to assess your intuition for model behavior and your judgment in aligning statistical tools with real business needs.
Build a fraud detection model and text messaging feature to reduce risk
Begin with data exploration and class imbalance techniques like SMOTE or undersampling. Apply logistic regression or random forest with precision-recall tradeoffs. Explain how model outputs inform actions like sending alerts. This mirrors real-world risk modeling tasks at firms like Thomson Reuters.
Tips
- Always start with class imbalance checks before model selection.
- Optimize for recall when false negatives are costly.
- Walk through how predictions translate into business actions (e.g., flag → SMS → escalation).
Explain why measuring bias is important when predicting delivery times
Address sources of bias like sample selection or omitted variable bias. Use residual analysis or cross-validation to detect prediction skew. Propose mitigation via feature engineering or re-weighting. It’s a typical question for evaluating model reliability in real-time systems.
Tips
- Illustrate bias visually with residual plots.
- Show how biased models erode customer trust in forecasts.
- Reference fairness metrics if the question overlaps with ethical AI.
Decide how to handle missing square footage data in a real-estate pricing model
Discuss options like deletion, mean/mode imputation, or regression imputation. Consider distributional assumptions and downstream model effects. Highlight when to segment missingness by property type or location. A valuable case that shows data cleaning rigor.
Tips
- Don’t default to mean imputation—explain trade-offs clearly.
- Segment missing data by subgroups (e.g., condos vs. houses).
- Validate imputation by comparing post-fill distributions with real values.
Determine if survey responses are random or truly dependent on prior answers
Use chi-square tests or permutation testing to assess independence. Discuss how to validate results with bootstrapping or confidence intervals. Point out implications on survey design or user intent modeling. This question tests your understanding of statistical inference.
Tips
- Know when to use chi-square vs. Fisher’s exact test.
- Explain assumptions behind independence testing.
- Tie results back to business impact (e.g., biased surveys = misleading insights).
Explain what an unbiased estimator is and why it matters
Define bias formally as the expected deviation from the true parameter. Provide examples like the sample mean vs. MLE under small samples. Discuss trade-offs between bias and variance. It’s a foundational concept in understanding model interpretability and risk.
Tips
- Memorize the unbiasedness definition: E[θ̂] = θ.
- Use simple examples like coin tosses or dice rolls.
- Link bias–variance trade-off to practical modeling choices (e.g., regularization).
Determine if 1 million Seattle ride trips sufficiently capture city-wide travel patterns
Evaluate sampling representation, seasonality, and geographic coverage. Suggest exploratory data analysis and statistical diagnostics. Raise concerns around bias from active user subsets. This reflects real decisions when building data-driven policy or business tools.
Tips
- Check representativeness by comparing demographics to census data.
- Explore seasonality: are trips spread across weekdays/weekends, months, weather?
- Highlight risk of “active user bias” where frequent riders dominate the dataset.
Take‑Home Data Science Assignment Discussion
The take-home data science assignment is a core component of the process, and this session is where you defend and dissect your submitted work. You’ll walk interviewers through your deliverables—often a Jupyter notebook, slide deck, or written summary—and explain the assumptions, methodology, and conclusions. Emphasis is placed on reproducibility, code clarity, and your ability to frame insights in a way that speaks to business stakeholders. Strong candidates highlight decision-relevant trade-offs, use stakeholder-ready visuals, and are transparent about limitations in the data or model.
Tips
- Rehearse your walkthrough so it feels structured, not improvised.
- Start with the business problem → your approach → key findings → recommendations.
- Use clear, labeled visuals that a non-technical audience can follow.
- Be upfront about limitations and how you’d address them with more time or data.
- Expect follow-up “what if” questions—practice adjusting assumptions live.
- Use our Take-Home Evaluator to benchmark your work and spot gaps before the interview.
Behavioral or Culture‑Fit Questions
Thomson Reuters places a strong emphasis on collaboration, integrity, and responsible AI. Behavioral questions explore how you handle cross-functional teamwork, global collaboration, and ethical decision-making in data science. You might be asked about a time you advocated for model transparency, managed conflicting priorities with product teams, or resolved communication gaps between technical and business units. Showing empathy, accountability, and alignment with the company’s trust-based culture is key in this round.
Describe a time when you had to advocate for ethical use of data in a project.
Frame your answer around a situation where stakeholder pressure conflicted with responsible data usage. Explain how you communicated the risks and aligned the solution with both business and ethical standards. Emphasize frameworks like GDPR or fairness metrics if relevant. This directly connects to Thomson Reuters’ commitment to data integrity and public trust.
Example:
“In a previous project, a stakeholder suggested using customer location data at a level that would have revealed identifiable patterns. I raised concerns about privacy and compliance with GDPR. I proposed aggregating the data to regional levels, which preserved analytical value while protecting user anonymity. By framing it in terms of both business risk and brand trust, I got alignment and we moved forward responsibly.”
Tell me about a time you collaborated with a team in a different time zone or culture.
Highlight your approach to asynchronous communication, documentation, and inclusive decision-making. Describe any tools or practices that helped overcome barriers (e.g., Slack updates, rotating meeting times). Emphasize adaptability and cross-cultural empathy. This reflects the global nature of Thomson Reuters’ data science teams.
Example:
“While working with a vendor team in Europe, the six-hour time difference made live meetings difficult. I introduced a practice of posting structured updates on Slack and documenting key decisions in a shared space. We also rotated meeting times so the burden wasn’t always on one group. This approach improved clarity and built a stronger sense of inclusion across the team.”
How do you handle disagreements with stakeholders over analytical findings?
Walk through a situation where data told a different story than expected by business users. Detail how you navigated the conversation, clarified assumptions, and presented reproducible evidence. Stress openness to feedback and compromise. Collaboration and clarity are key to working across research and product units.
Example:
“In one case, my analysis showed that a marketing campaign underperformed, but stakeholders expected the opposite. I walked them through the assumptions, shared reproducible queries, and compared the results with alternative metrics they trusted. By focusing on transparency and showing I was open to revisiting the data, the conversation shifted from defensiveness to problem-solving, and we ended up refining campaign targeting together.”
Give an example of when you had to balance model complexity with explainability.
Choose a case where stakeholder understanding or regulatory needs limited your choice of algorithms. Explain how you simplified or supplemented complex models with interpretable metrics or visualizations. Discuss the importance of building trust with non-technical audiences. This shows alignment with Thomson Reuters’ emphasis on transparency in AI.
Example:
“I once worked on a churn prediction project where a gradient boosting model gave strong results but was difficult for business leaders to interpret. I supplemented it with a simpler logistic regression model and SHAP visualizations. While we used the complex model in production, I relied on the interpretable outputs to explain key drivers of churn. This dual approach helped stakeholders trust the solution while still delivering accuracy.”
Tell me about a time you received constructive feedback on your communication or teamwork.
Share how you responded to feedback—perhaps you were too technical in presentations or slow to update collaborators. Describe what you changed and how it improved team dynamics or outcomes. Growth mindset and reflection are critical in a collaborative workplace.
Example:
“Early in my career, a manager pointed out that my reports were too technical for non-analyst audiences. Instead of just showing regression coefficients, I started including plain-language summaries and visuals. The change made meetings more efficient, and I got feedback later that stakeholders finally felt confident applying my recommendations. That experience taught me how much presentation impacts adoption.”
How to Prepare for a Data Scientist Role at Thomson Reuters
Preparation for the Data Scientist interview at Thomson Reuters involves more than brushing up on technical skills—it’s about presenting yourself as a well-rounded analyst who can code, model, and clearly communicate insights that drive decisions. The company values collaboration, ethical data use, and clarity, so your prep should reflect those principles. Below are key tips that will help you stand out at every stage of the process.
Study the Role & Culture
Understand the mission and show ethical alignment
Before diving into problem sets, take time to understand Thomson Reuters’ mission and values—especially their Trust Principles, which emphasize accuracy, independence, and integrity. Even if you haven’t worked on explicitly ethical or regulatory-facing data science projects, you can still demonstrate alignment by highlighting moments where you made responsible choices with data. For instance, showcasing how you managed missing or biased data, clearly communicated a model’s limitations, or chose interpretable models for stakeholder transparency can reflect these values.
Elevate common projects and pivot from academic work
Traditional projects like churn prediction, fraud detection, or pricing models can still stand out if you emphasize how you framed the problem thoughtfully, prioritized fairness or explainability, or collaborated cross-functionally to ensure your outputs were actionable and grounded in context. If you’re pivoting from more academic or competition-based work, consider adding a post-analysis section to your notebooks or presentations that discusses assumptions, limitations, and potential downstream risks—this shows maturity and trustworthiness in your thinking, even if the original project didn’t require it.
Practice Common Question Types
Balance your prep
Based on past candidate reports, the question breakdown typically leans 40% toward coding tasks (Python, SQL, and lightweight scripting), 35% toward statistics and machine learning case questions (like metric selection and model interpretation), and 25% behavioral. You should practice all three types in proportion.
Coding and ML case focus
For coding, focus on writing clean, vectorized Python using pandas and NumPy, along with intermediate SQL for joins, filtering, and aggregations—these are the workhorses of the role. Common tasks include reshaping messy data, calculating A/B test metrics, simulating outcomes, or writing functions for conditional logic.
There’s no need to build machine learning algorithms from scratch—you won’t be asked to implement logistic regression or gradient boosting by hand. Instead, you’ll need to apply libraries like
scikit-learneffectively, understand how to structure pipelines, tune models, and justify your design choices.Statistics prep
Also, refresh your probability fundamentals—expect practical questions involving conditional probability, Bayes’ theorem, expected value, and distributions under uncertainty, especially in A/B testing or model interpretation contexts. Clear reasoning and precise explanations often count more than flashy techniques. Finally, don’t overlook behavioral prep: many technically capable candidates fall short when they can’t connect their analysis to real-world business goals or team collaboration.
Master the data science assignment
Simulate the process
The take-home data science assignment is often the deciding factor in the process. Simulate the experience by doing two-day mini-projects using publicly available datasets (e.g., from Kaggle or Data.gov). Stick to a 48-hour deadline, structure your code for reproducibility, and prepare both a Jupyter notebook and a short slide deck. Explore more data science take-home challenges and start preparing today.
Prioritize communications
Focus not just on model performance, but also on how clearly you can present trade-offs and recommendations to a stakeholder who may not be technical. For your slides, aim for 5–7 concise, visually clean slides: begin with the business problem, follow with key insights from your exploratory analysis, summarize your modeling approach and key results (with one or two charts), and close with actionable recommendations and limitations. Use consistent formatting, label visuals clearly, and avoid code screenshots—prioritize storytelling over technical detail, and frame your choices in terms of business value. A polished, stakeholder-friendly slide deck often makes the difference between a pass and a follow-up.
Think Out Loud & Ask Clarifying Questions
In technical interviews, interviewers are looking as much at how you think as what you answer. Don’t be afraid to verbalize your assumptions, describe alternate paths you considered, or ask clarifying questions when a prompt is vague. This is especially important in modeling deep dives and product case rounds, where ambiguity is intentional. Clear reasoning, even if imperfect, is valued over silent perfection.
Mock Interviews & Feedback – focus on storytelling with complex data.
Finally, rehearse with peers or mentors through mock interviews. Prioritize practicing how you explain messy data projects, defend modeling decisions, and tie analysis back to business goals. Aim for structured storytelling—what was the problem, how did you approach it, what insights did you uncover, and what decisions did it inform? This not only prepares you for behavioral and case interviews but also builds your confidence in the “why” behind your work.
FAQs
What Is the Average Salary for a Data Scientist at Thomson Reuters?
Average Base Salary
Average Total Compensation
The Thomson Reuters data scientist salary typically includes a competitive base salary, annual performance bonuses, and equity in the form of RSUs (restricted stock units). For entry- to mid-level roles, base pay often ranges between $100,000 to $140,000, while senior-level or specialized roles (e.g., working in AI labs or with real-time financial systems) may see total compensation packages exceeding $170,000 to $200,000, especially in hubs like New York or Toronto. Geography plays a major role—salaries tend to be higher in major urban markets or in teams aligned with core product or machine learning R&D.
- Entry to Mid-Level Roles: Base salary typically ranges from $100,000 – $140,000 (Levels.fyi).
- Senior or Specialized Roles: Total compensation can exceed $170,000 – $200,000, especially for positions in AI labs or real-time financial systems (Glassdoor).
- Geographic Variations: Salaries trend higher in major hubs like New York and Toronto, particularly in teams tied to core product development or machine learning R&D (Indeed).
Are There Current Data Scientist Openings at Thomson Reuters on Interview Query?
Yes! Check out the latest Data Scientist job postings at Thomson Reuters via Interview Query’s job board. You’ll find role descriptions, required skills, and application links tailored for analytics, machine learning, and data-driven product teams. Bookmark it to stay updated on new openings.
Conclusion
Mastering the Thomson Reuters Data Scientist interview process takes more than technical knowledge—it requires thoughtful communication, business-aligned modeling, and strong ethical reasoning. Use this guide to structure your prep, from refining your Python and SQL skills to preparing for stakeholder-ready presentations in the data science assignment. Practice walking through your decisions out loud, and reflect on how your work aligns with Thomson Reuters’ values of trust and impact.
For a broader view of the company’s interview process across roles, check out our Thomson Reuters Interview Overview. If you’re also considering adjacent paths, our Machine Learning Engineer guide offers detailed prep strategies for more infrastructure- and model-heavy roles.
Thomson Reuters Interview Questions
| Question | Topic | Difficulty |
|---|---|---|
Product Sense & Metrics | Medium | |
You’re a data scientist at YouTube. Leadership wants to revisit how the platform measures success, not for a specific new feature, but for the product as a whole given its current state. How would you define and measure success for YouTube? Identify your primary and secondary metrics, explain your rationale for each, and discuss how you would choose the right thresholds for any engagement-based metrics you propose. | ||
AI & Agentic Systems | Medium | |
Machine Learning | Medium | |
SQL | Easy | |
Machine Learning | Medium | |
Statistics | Medium | |
SQL | Hard | |
Machine Learning | Medium | |
Python | Easy | |
Deep Learning | Hard | |
SQL | Medium | |
Statistics | Easy | |
Machine Learning | Hard |
Discussion & Interview Experiences