Bentley Systems Data Analyst Interview Questions + Guide in 2025


Overview
Bentley Systems is a leading infrastructure engineering software company dedicated to providing innovative solutions that enhance the design, construction, and operation of vital infrastructure projects across the globe.
The Data Analyst role at Bentley Systems is pivotal in transforming raw data into actionable insights that support infrastructure projects. Key responsibilities include extracting and manipulating data from various sources, such as databases and APIs, using tools like Microsoft SQL and Snowflake. The ideal candidate will have a strong background in data analytics, ensuring data accuracy and consistency through effective cleaning and validation processes. This role also requires proficiency in statistical analysis, machine learning techniques, and data visualization to identify patterns and trends, ultimately communicating these findings effectively through visual representations.
Candidates should possess a Master’s degree in Data Analytics, Data Science, or a related field, along with at least two years of relevant experience in data analysis, SQL, and business intelligence platforms. A great fit for this position will not only excel in technical skills but will also embody Bentley’s commitment to advancing infrastructure sustainability and innovation.
This guide aims to equip you with the necessary insights and knowledge to excel in your job interview, ensuring you present your skills and experiences in alignment with Bentley's values and expectations.
What Bentley Systems Looks for in a Data Analyst
Challenge
Check your skills...
How prepared are you for working as a Data Analyst at Bentley Systems?
Bentley Systems Data Analyst Interview Process
The interview process for a Data Analyst role at Bentley Systems is structured to assess both technical skills and cultural fit within the company. Here’s what you can expect:
1. Initial Screening
The first step in the interview process is an initial screening, typically conducted via a phone call with a recruiter. This conversation lasts about 30 minutes and focuses on your background, experience, and motivation for applying to Bentley Systems. The recruiter will also gauge your understanding of the role and the company culture, ensuring that you align with Bentley's values and mission.
2. Technical Assessment
Following the initial screening, candidates will undergo a technical assessment, which may be conducted through a video call. This assessment is designed to evaluate your proficiency in SQL, data manipulation, and statistical analysis. You may be asked to solve problems related to data extraction, cleaning, and validation, as well as demonstrate your ability to analyze datasets for patterns and insights. Expect to discuss your experience with tools like Snowflake and any relevant analytics platforms.
3. Onsite Interviews
The onsite interview typically consists of multiple rounds, each lasting around 45 minutes. You will meet with various team members, including data analysts and managers. These interviews will cover a mix of technical and behavioral questions. You’ll be expected to showcase your analytical skills, discuss your previous projects, and explain your approach to data visualization and machine learning techniques. Additionally, there will be discussions about how you communicate findings and collaborate with cross-functional teams.
4. Final Interview
The final interview may involve a presentation component, where you will be asked to present a case study or a project you have worked on. This is an opportunity to demonstrate your analytical thinking, problem-solving skills, and ability to convey complex information in an understandable manner. The interviewers will assess not only your technical capabilities but also your communication skills and how well you can engage with stakeholders.
As you prepare for your interviews, it’s essential to familiarize yourself with the types of questions that may arise during the process.
Bentley Systems Data Analyst Interview Tips
Here are some tips to help you excel in your interview.
Understand Bentley's Mission and Values
Familiarize yourself with Bentley Systems' commitment to advancing infrastructure through innovative software solutions. Understanding their mission will not only help you align your answers with their values but also demonstrate your genuine interest in contributing to their goals. Be prepared to discuss how your skills and experiences can support Bentley's vision of sustainable infrastructure.
Highlight Your Technical Proficiency
Given the emphasis on SQL and data analytics in the role, ensure you can confidently discuss your experience with these tools. Brush up on your SQL skills, focusing on complex queries, data manipulation, and integration techniques. Be ready to provide examples of how you've used SQL in past projects to extract and analyze data. Additionally, familiarize yourself with Snowflake and any relevant analytics platforms like Qlik Sense or QlikView, as these are crucial for the role.
Showcase Your Analytical Skills
The role requires a strong foundation in statistics and data analysis. Prepare to discuss your experience with statistical methods, machine learning, and data visualization techniques. Be ready to explain how you've applied these skills to identify patterns and trends in data sets. Use specific examples to illustrate your analytical thinking and problem-solving abilities, as this will resonate well with the interviewers.
Communicate Findings Effectively
Since the role involves communicating insights through visualizations, practice articulating your findings clearly and concisely. Think about how you can present complex data in an understandable way, using visual aids if necessary. Be prepared to discuss past experiences where you successfully communicated data-driven insights to stakeholders, emphasizing the impact of your findings on decision-making.
Embrace the Company Culture
Bentley Systems values collaboration and innovation. During your interview, demonstrate your ability to work well in a team and your enthusiasm for contributing to a collaborative environment. Share examples of how you've successfully collaborated with others in previous roles, and express your eagerness to engage with Bentley's diverse team of professionals.
Prepare for Behavioral Questions
Expect behavioral interview questions that assess your problem-solving skills, adaptability, and teamwork. Use the STAR (Situation, Task, Action, Result) method to structure your responses, ensuring you provide clear and relevant examples. This approach will help you convey your experiences effectively and show how you align with Bentley's expectations for the role.
Ask Insightful Questions
Prepare thoughtful questions to ask your interviewers about the team dynamics, ongoing projects, and Bentley's future initiatives. This not only shows your interest in the role but also gives you valuable insights into the company culture and expectations. Asking about opportunities for professional development can also demonstrate your commitment to growth within the organization.
By following these tips and preparing thoroughly, you'll position yourself as a strong candidate for the Data Analyst role at Bentley Systems. Good luck!
Bentley Systems Data Analyst Interview Questions
Bentley Systems Data Analyst Interview Questions
In this section, we’ll review the various interview questions that might be asked during a Data Analyst interview at Bentley Systems. The interview will focus on your ability to extract and manipulate data, perform statistical analysis, and communicate insights effectively. Be prepared to demonstrate your knowledge of SQL, data visualization techniques, and your analytical mindset.
SQL and Data Manipulation
1. Can you explain the difference between INNER JOIN and LEFT JOIN in SQL?
Understanding SQL joins is crucial for data manipulation and retrieval.
How to Answer
Discuss the definitions of both INNER JOIN and LEFT JOIN, emphasizing how they differ in terms of the data they return.
Example
"An INNER JOIN returns only the rows where there is a match in both tables, while a LEFT JOIN returns all rows from the left table and the matched rows from the right table. If there is no match, NULL values are returned for columns from the right table."
2. How would you optimize a slow-running SQL query?
Performance optimization is key in data analysis roles.
How to Answer
Mention techniques such as indexing, query restructuring, and analyzing execution plans to improve query performance.
Example
"I would start by examining the execution plan to identify bottlenecks. Then, I would consider adding indexes on frequently queried columns and rewriting the query to reduce complexity, ensuring that it retrieves only the necessary data."
3. Describe a scenario where you had to clean and validate data. What steps did you take?
Data quality is essential for accurate analysis.
How to Answer
Outline the steps you took to identify issues, clean the data, and validate its accuracy.
Example
"In a previous project, I noticed discrepancies in sales data. I first identified missing values and outliers, then used techniques like imputation for missing data and removed outliers based on statistical thresholds. Finally, I cross-verified the cleaned data with source records to ensure accuracy."
4. What are window functions in SQL, and when would you use them?
Window functions are powerful tools for data analysis.
How to Answer
Explain what window functions are and provide examples of scenarios where they are useful.
Example
"Window functions perform calculations across a set of table rows related to the current row. I would use them for tasks like calculating running totals or averages over a specific range of data without collapsing the result set."
5. How do you handle missing data in a dataset?
Handling missing data is a common challenge in data analysis.
How to Answer
Discuss various strategies for dealing with missing data, including imputation and removal.
Example
"I typically assess the extent of missing data first. If it's minimal, I might use imputation methods like mean or median substitution. For larger gaps, I may consider removing those records or using algorithms that can handle missing values effectively."
Statistics and Probability
1. Explain the concept of p-value in hypothesis testing.
Understanding statistical concepts is vital for data analysis.
How to Answer
Define p-value and its significance in determining the strength of evidence against the null hypothesis.
Example
"The p-value measures the probability of obtaining results at least as extreme as the observed results, assuming the null hypothesis is true. A low p-value indicates strong evidence against the null hypothesis, leading to its rejection."
2. What is the Central Limit Theorem, and why is it important?
This theorem is foundational in statistics.
How to Answer
Describe the Central Limit Theorem and its implications for sampling distributions.
Example
"The Central Limit Theorem states that the distribution of the sample mean approaches a normal distribution as the sample size increases, regardless of the population's distribution. This is crucial because it allows us to make inferences about population parameters using sample statistics."
3. How do you determine if a dataset is normally distributed?
Normality is an important assumption in many statistical tests.
How to Answer
Discuss methods for assessing normality, such as visual inspections and statistical tests.
Example
"I would use visual methods like Q-Q plots and histograms to assess normality, along with statistical tests like the Shapiro-Wilk test. If the data significantly deviates from normality, I would consider transformations or non-parametric tests."
4. Can you explain the difference between Type I and Type II errors?
Understanding errors in hypothesis testing is crucial.
How to Answer
Define both types of errors and their implications in decision-making.
Example
"A Type I error occurs when we reject a true null hypothesis, while a Type II error happens when we fail to reject a false null hypothesis. Understanding these errors helps in assessing the risks associated with our statistical decisions."
5. What is regression analysis, and how would you use it in your work?
Regression analysis is a key tool for data analysts.
How to Answer
Explain the purpose of regression analysis and its applications in predicting outcomes.
Example
"Regression analysis helps identify relationships between variables and predict outcomes. I would use it to analyze trends in data, such as predicting sales based on marketing spend, allowing for data-driven decision-making."
Data Visualization
1. What tools have you used for data visualization, and which do you prefer?
Familiarity with visualization tools is important for communicating insights.
How to Answer
Mention specific tools you have experience with and explain your preference based on usability and features.
Example
"I have used tools like Tableau and Qlik Sense for data visualization. I prefer Tableau for its user-friendly interface and powerful capabilities in creating interactive dashboards that effectively communicate insights to stakeholders."
2. How do you decide which type of chart or graph to use for your data?
Choosing the right visualization is key to effective communication.
How to Answer
Discuss factors that influence your choice of visualization, such as the data type and the message you want to convey.
Example
"I consider the nature of the data and the story I want to tell. For example, I would use a line chart for trends over time, a bar chart for comparing categories, and a scatter plot to show relationships between two variables."
3. Describe a time when your data visualization led to a significant business decision.
Demonstrating the impact of your work is important.
How to Answer
Share a specific example where your visualization influenced decision-making.
Example
"I created a dashboard that visualized customer churn rates alongside marketing campaign data. This visualization revealed a correlation between specific campaigns and increased churn, prompting the team to adjust our marketing strategy, which ultimately reduced churn by 15%."
4. How do you ensure your visualizations are accessible to all stakeholders?
Accessibility is crucial for effective communication.
How to Answer
Discuss strategies you use to make visualizations understandable for diverse audiences.
Example
"I focus on clarity and simplicity in my visualizations, using clear labels and legends. I also consider colorblind-friendly palettes and provide context through annotations to ensure that all stakeholders can interpret the data accurately."
5. What is your approach to presenting data findings to non-technical stakeholders?
Effective communication is key in data analysis roles.
How to Answer
Explain how you tailor your presentations to suit the audience's level of understanding.
Example
"I simplify complex data findings by focusing on key insights and using relatable analogies. I also encourage questions and discussions to ensure that non-technical stakeholders feel comfortable engaging with the data."
| Question | Topic | Difficulty |
|---|---|---|
Query Optimization | Medium | |
Let’s say you’re a data engineer at Fidelity Investments, and you’re running a SQL query on a cloud-based data warehouse. All cluster resources and network health metrics look normal, but the query is still taking over 10 minutes to complete. How would you go about diagnosing and improving the performance of this query? | ||
SQL | Easy | |
SQL | Easy | |
SQL | Easy | |
Machine Learning | Medium | |
Statistics | Medium | |
SQL | Hard | |
Machine Learning | Medium | |
Python | Easy | |
Deep Learning | Hard | |
SQL | Medium | |
Statistics | Easy | |
Machine Learning | Hard |
-
Write a SQL query to select the 2nd highest salary in the engineering department. Write a SQL query to select the 2nd highest salary in the engineering department. If more than one person shares the highest salary, the query should select the next highest salary.
-
Write a function to merge two sorted lists into one sorted list. Given two sorted lists, write a function to merge them into one sorted list. Bonus: Determine the time complexity.
-
Create a function
missing_numberto find the missing number in an array. You have an array of integers,numsof lengthnspanning0tonwith one missing. Write a functionmissing_numberthat returns the missing number in the array. Complexity of (O(n)) required. -
Develop a function
precision_recallto calculate precision and recall metrics. Given a 2-D matrix P of predicted values and actual values, write a function precision_recall to calculate precision and recall metrics. Return the ordered pair (precision, recall). -
Write a function to search for a target value in a rotated sorted array. Given a rotated sorted array and a target value, write a function to search for the target value. If the value is in the array, return its index; otherwise, return -1. Bonus: The algorithm's runtime complexity should be in the order of (O(\log n)).
-
Would you suspect anything unusual about the A/B test results with 20 variants? Your manager ran an A/B test with 20 different variants and found one significant result. Would you consider this result suspicious?
-
How would you set up an A/B test to optimize button color and position for higher click-through rates? A team wants to A/B test changes in a sign-up funnel, such as changing a button from red to blue and/or moving it from the top to the bottom of the page. How would you design this test?
-
What steps would you take if friend requests on Facebook are down 10%? A product manager at Facebook reports a 10% decrease in friend requests. What actions would you take to investigate and address this issue?
-
Why might the number of job applicants be decreasing despite stable job postings? You observe that the number of job postings per day has remained constant, but the number of applicants has been decreasing. What could be causing this trend?
-
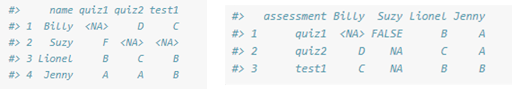
What are the drawbacks of the given student test score datasets, and how would you reformat them for better analysis? You have data on student test scores in two different layouts. What are the drawbacks of these formats, and what changes would you make to improve their usability for analysis? Additionally, describe common issues found in "messy" datasets.
-
Is this a fair coin? You flip a coin 10 times, and it comes up tails 8 times and heads twice. Determine if the coin is fair based on this outcome.
-
Write a function to calculate sample variance from a list of integers. Create a function that outputs the sample variance given a list of integers. Round the result to 2 decimal places. Example: Input:
test_list = [6, 7, 3, 9, 10, 15]Output:get_variance(test_list) -> 13.89 -
Is there anything fishy about the A/B test results with 20 variants? Your manager ran an A/B test with 20 different variants and found one significant result. Evaluate if there is anything suspicious about these results.
-
Write a function to return the median value of a list in O(1) time and space. Given a list of sorted integers where more than 50% of the list is the same repeating integer, write a function to return the median value in O(1) computational time and space. Example: Input:
li = [1,2,2]Output:median(li) -> 2 -
What are the drawbacks of the given student test score data layouts? You have data on student test scores in two different layouts. Identify the drawbacks of these layouts, suggest formatting changes for better analysis, and describe common problems in "messy" datasets.
-
How would you evaluate the suitability and performance of a decision tree model for predicting loan repayment? You are tasked with building a decision tree model to predict if a borrower will repay a personal loan. How would you evaluate whether a decision tree is the correct model for this problem? If you proceed with the decision tree, how would you evaluate its performance before and after deployment?
-
How does random forest generate the forest, and why use it over logistic regression? Explain how a random forest generates its forest of decision trees. Additionally, discuss why you might choose random forest over other algorithms like logistic regression.
-
When would you use a bagging algorithm versus a boosting algorithm? Compare two machine learning algorithms. In which scenarios would you use a bagging algorithm versus a boosting algorithm? Provide examples of the tradeoffs between the two.
-
How would you justify using a neural network model and explain its predictions to non-technical stakeholders? Your manager asks you to build a neural network model to solve a business problem. How would you justify the complexity of this model and explain its predictions to non-technical stakeholders?
-
What metrics would you use to track the accuracy and validity of a spam classifier? You are tasked with building a spam classifier for emails and have completed a V1 of the model. What metrics would you use to track the accuracy and validity of the model?
Conclusion
For those eager to embark on an exciting journey with Bentley Systems, the Data Analyst role offers a thrilling opportunity to work with cutting-edge technologies like SQL and Snowflake to transform data into actionable insights. At Bentley Systems, you’ll be part of a forward-thinking organization that drives innovation in infrastructure engineering software, impacting global projects from roads and bridges to water utilities and industrial facilities. If you’re equipped with a master’s degree in Data Analytics Engineering or Data Science and have hands-on experience in data modeling and business intelligence platforms, this could be your perfect next step.
To dive deeper into what the interview process entails, check out our main Bentley Systems Interview Guide, where we've compiled numerous interview questions and insights specific to Bentley. We've also curated guides for other roles, including data analyst and software engineer positions.
At Interview Query, our mission is to empower you with the knowledge, confidence, and strategic guidance to excel in any Bentley Systems interview. Explore our extensive collection of company interview guides for comprehensive preparation. If you have any questions, don’t hesitate to reach out to us.
Good luck with your interview!
Discussion & Interview Experiences