
12 Best Supply Chain Data Science Projects & Datasets to Learn in 2025


Overview
Global supply chain management is undergoing a significant transformation enabled by Big Data and powered by data science teams using advanced technologies like artificial intelligence, blockchain, and robotics.
These promising advancements promise to make the supply chain more agile, predictable, and cost-efficient for organizations, leading to higher profitability and competitiveness. With more organizations realizing the benefits of applying data science to supply chain management, the industry’s demand for skilled data scientists is rising. The Robert Half Technology (RHT) 2020 Salary Guide recognizes the manufacturing and distribution industries as “hotbeds for hiring” information technology professionals, including data scientists. Want to be part of the supply chain digitization revolution?
Here are 12 supply chain data science projects and datasets to help you start:
1. CleanSpark: Electricity Pricing Model Take-Home

This Python data science challenge is given to junior data scientists and analysts. The task focuses on building a pricing model to estimate the energy and demand charges.
This in-depth Python challenge includes packages you may not be familiar with. Specifically, you’re asked to:
- Process monthly electricity consumption data for a commercial facility in San Diego.
- Then, you must add logic to the two stubbed functions (included with the test) that use electricity consumption data and the pricing scheme to calculate pricing.
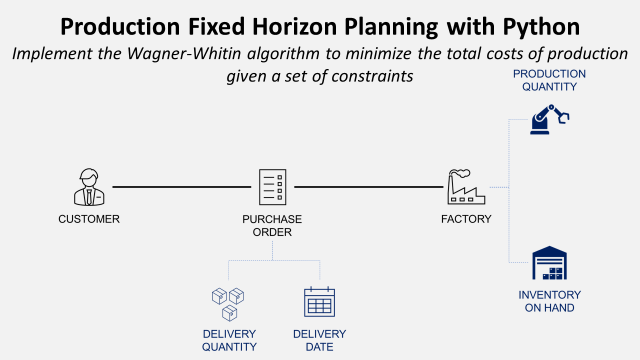
2. Production Fixed Horizon Planning with Python
According to the latest report by Hackett Group, 81% of supply chain managers report that data analytics and Optimization will be crucial when it comes to cost reduction and supply chain management.
This project is a great way to apply optimization algorithms to real-life supply chain scenarios. We assume You are a production planning manager in a small factory producing radio equipment that serves local and international markets.
Your role is to schedule production to deliver on time with a minimum total cost of production while minimizing the storage costs and the production steps. You will learn to implement Wagner-Whitin Optimization with Python to solve that issue.
How you can do it: Follow this explanatory tutorial by Samir Saci that takes you through the solution steps and explains the logic of choosing Optimization and its application. You can find the source code for the project in his GitHub repository.
3. Amazon: Inventory Time Series Take-Home

This Amazon supply chain data science project for take-home asks you to analyze sales data to determine which percentage of customers do not wait for items to become available after being out of stock. Ideally, your model will be able to estimate lost sales due to shortage (which one indicator might be a higher demand on replenishment days).
To help you get started, these assumptions are included:
- Demand has no trend or seasonality
- Customers experiencing shortages who decide to return will only return on the replenishment day.
- Replenishment occurs at the beginning of the day only.
- Each customer buys no more than 1 item
A take-home challenge like this might be given to a supply chain analyst or sales analyst at Amazon or another e-commerce company.
4. Supply Chain Sustainability Reporting with Python
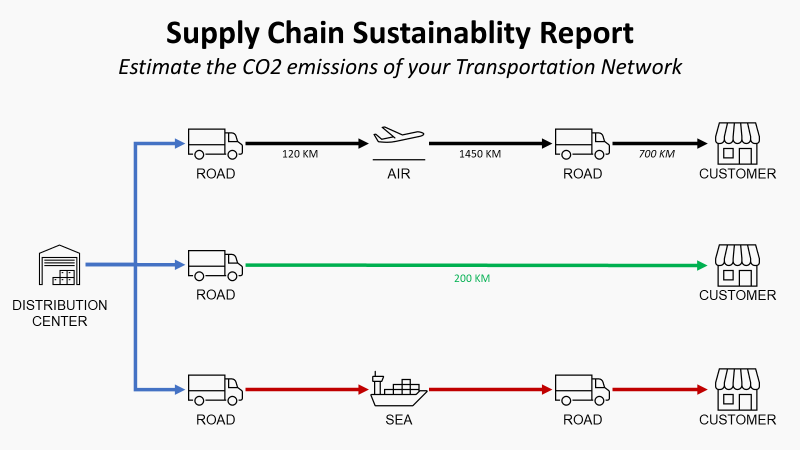
The demand for transparency in sustainable development from investors and customers has grown. Investors have placed an increased emphasis on the business’s sustainability when assessing an organization’s value and resiliency. In this project, we will use a straightforward methodology to report the CO2 emissions of your Distribution Network using Python and PowerBI.
How you can do it: Follow through this detailed tutorial by Samir Saci, which breaks down the project into three steps:
- Step 1: Calculating CO2 Emissions Formula for Transportation using GHG Protocol corporate standard
- Step 2: Processing data with Python
- Step 3: Visualizing the results using PowerBI
You can find the project source code here.
5. Robust Supply Chain Networks with Monte Carlo Simulation
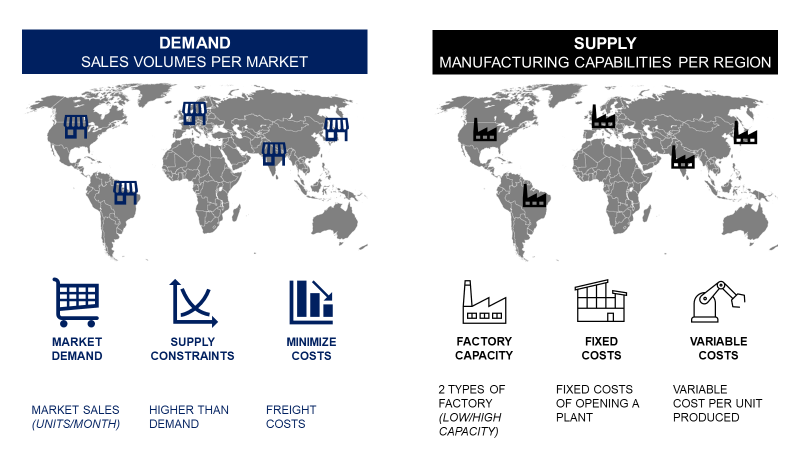
Businesses with optimal supply chains achieve 5-15% lower supply chain costs, 20-50% fewer inventory holdings, and up to 3X cash-to-cash cycle speeds. Supply chain optimization algorithms make the best use of data analytics to help businesses achieve that goal by finding an optimal combination of factories and distribution centers to meet the demands of their customers.
The core structure of many software and solutions in the market is a Linear Programming Model.
But these models mostly assume constant demand. However, if you have a fluctuating market or very high seasonality, using these solutions will affect your network robustness immensely. In this project, we will build a straightforward methodology to design a Robust Supply Chain Network using Monte Carlo simulation with Python to address this problem. We break the process down into three steps:
- Using supply and demand network assumptions, we will start by analyzing the robustness of the initial solution, assuming constant demand,
- Then run 50 simulations based on normal distributions,
- Then analyze the results to select the most robust solution or combination of solutions to increase robustness.
How you can do it: You can find a detailed paper in Science Direct laying out the approach and implementation and an example source code to try it out yourself on GitHub.
6. Improve Warehouse Productivity using Order Batching with Python
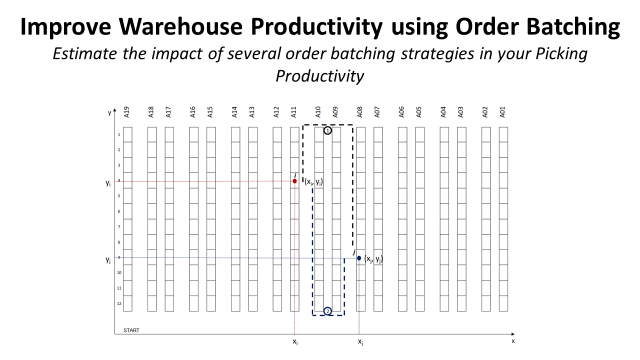
In a Distribution Center (DC), walking time from one location to another during the picking route can account for 50% of the operator’s working time. Reducing this walking time is a very effective way to increase your DC overall productivity.
We will learn how to use the Single Picker Routing Problem (SPRP) to design a model that can be used to find optimal order picking in a two-dimensional warehouse.
We will test numerous optimization algorithms and then run different simulations to choose a winning picking strategy.
How you can do it: You can follow this tutorial by Samir Saci, explaining the steps of the project. To produce more optimal results, you can experiment with another approach to this problem using Spatial Clustering or Pathfinding Algorithm.
7. Production Planning and Resource Management of Manufacturing Systems in Python
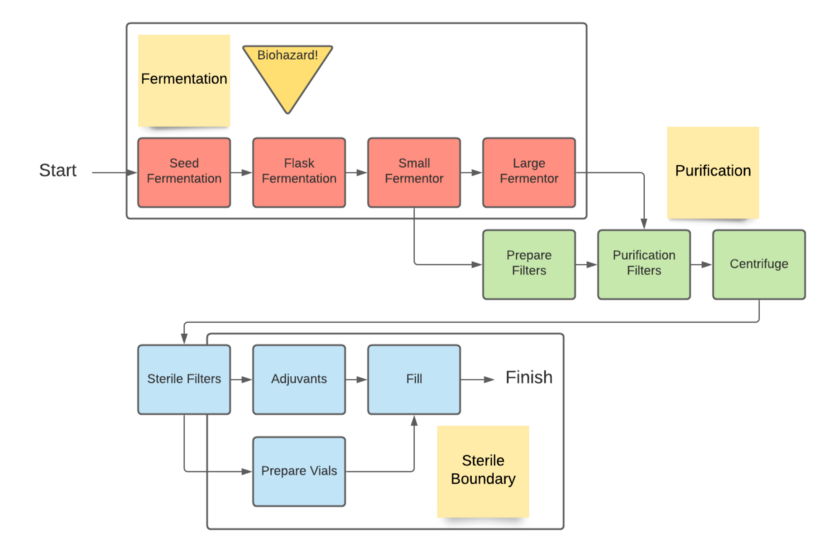
Supply chain management is one of the most significant areas of focus for improvement in today’s global economy, with supply chain management positions and hiring growing faster than current economic averages. Getting goods from A to B is challenging, but manufacturing enough materials is arduous.
Modeling these manufacturing processes requires a well-developed understanding of the constraints and dependencies inherent to the production line. Mixed-integer programming models such as CPLEX or Google’s OR framework derive solutions optimizing functions such as minimizing costs, but it struggles to model continuous systems. In this project, we will develop a rudimentary production plan with resource balancing in a forward-facing heuristic with Python and graphically illustrate an interactive Gantt chart using Plotly. Our program will aim to schedule the batch with the shortest runtime.
How you can do it: Follow the steps of this tutorial by Will Keefe, which explains a case study of biologics manufacturing within pharmaceuticals with clear steps and example code.
8. Multi-modal Transportation Optimization
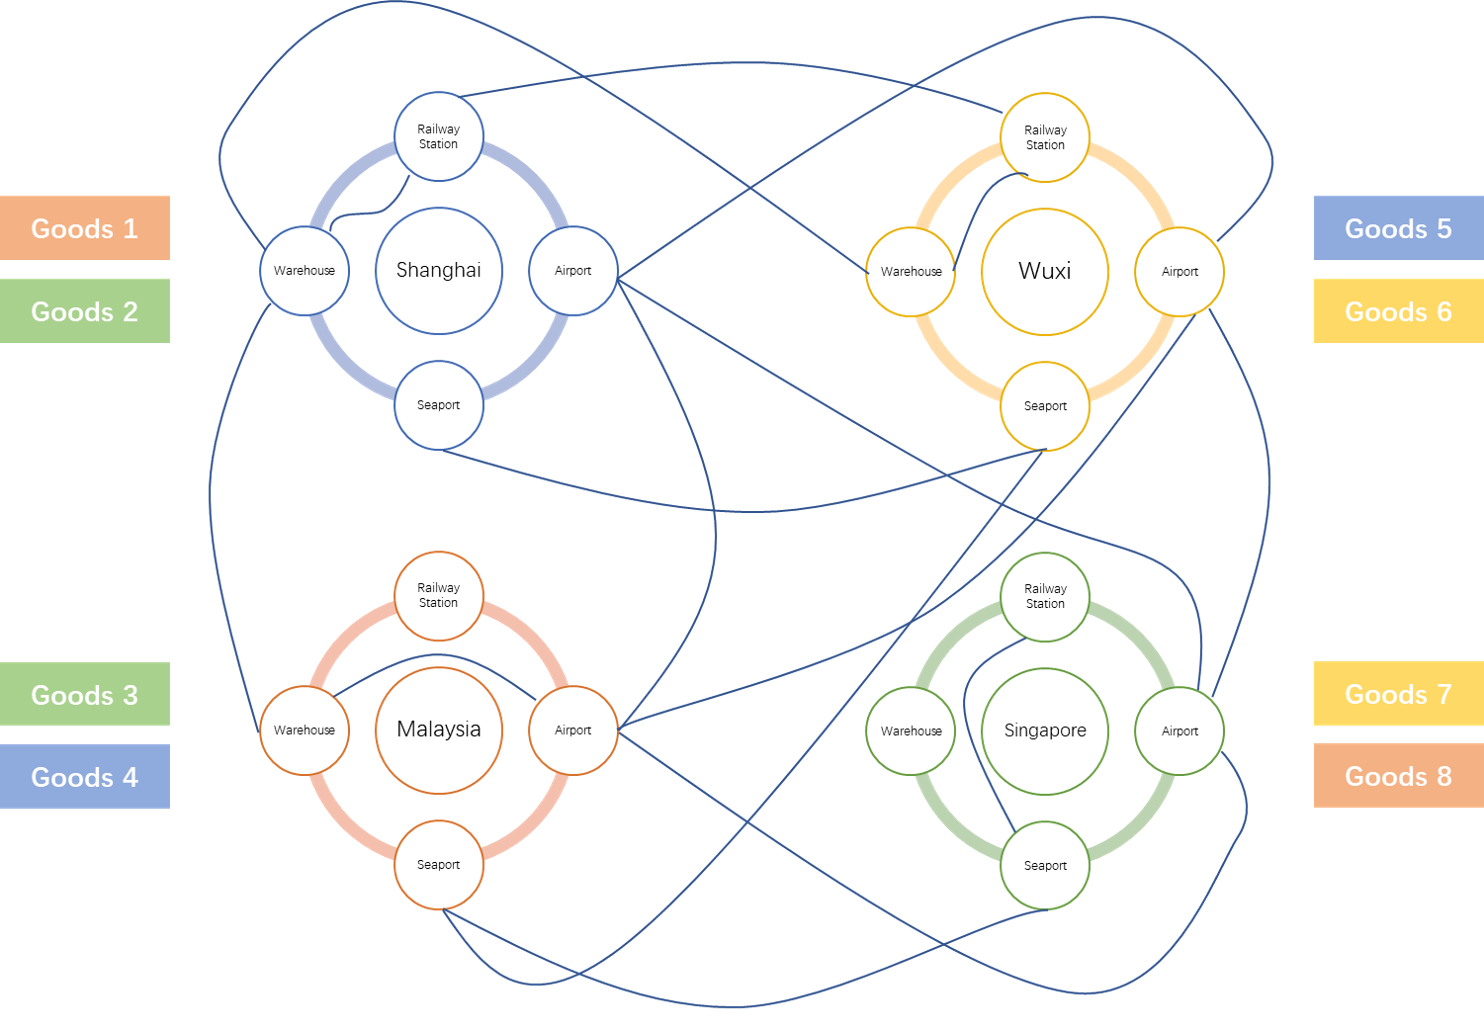
Many transportation tools such as trucks, airplanes, and ships are available in delivery services, and different choices of routes and transportation tools will lead to additional costs.
To minimize cost, we should consider goods consolidation (Occasions when various goods share a journey.), transportation costs and delivery time constraints, etc. Shippers can minimize freight invoice payments by 90-95% if they optimize transportation management. (GlobalTranz, 2018).
This project uses mathematical programming to model such a situation and solve the overall cost-minimization solution. The model construction offers options for two mathematical programming frameworks, DOcplex and CVXPY.
How you can do it: You can follow the instructions in the project source code, which explains how to set up this Optimization by matrixing and choosing dimensions, deciding on parameters and decision variables, and finally running the Optimization and analyzing the results.
9. A Python OR-Tools Model for Seasonal Inventory Planning

Manufacturing facilities may be unable to produce seasonal products within the vital season. Building additional inventory before the season can often be less expensive than buying other tooling and space. When taking this approach, there are a few questions to answer:
- What is the quantity of the product to produce before the season starts?
- Assuming the inventory will build up over time with a smoothed production plan, when does manufacturing need to start producing excess inventory to store for the high season?
In this project, we build a model that provides a scalable framework to build upon for multiple products amid competing capacity constraints. We will use OR tools for Python to implement a multi-period inventory mode.
How you can do it: Follow this tutorial by Sabi Horvat, which explains the details of implementing this optimization modeling problem.
10. Forecasting Retail Sales Using Google Trends and Machine Learning
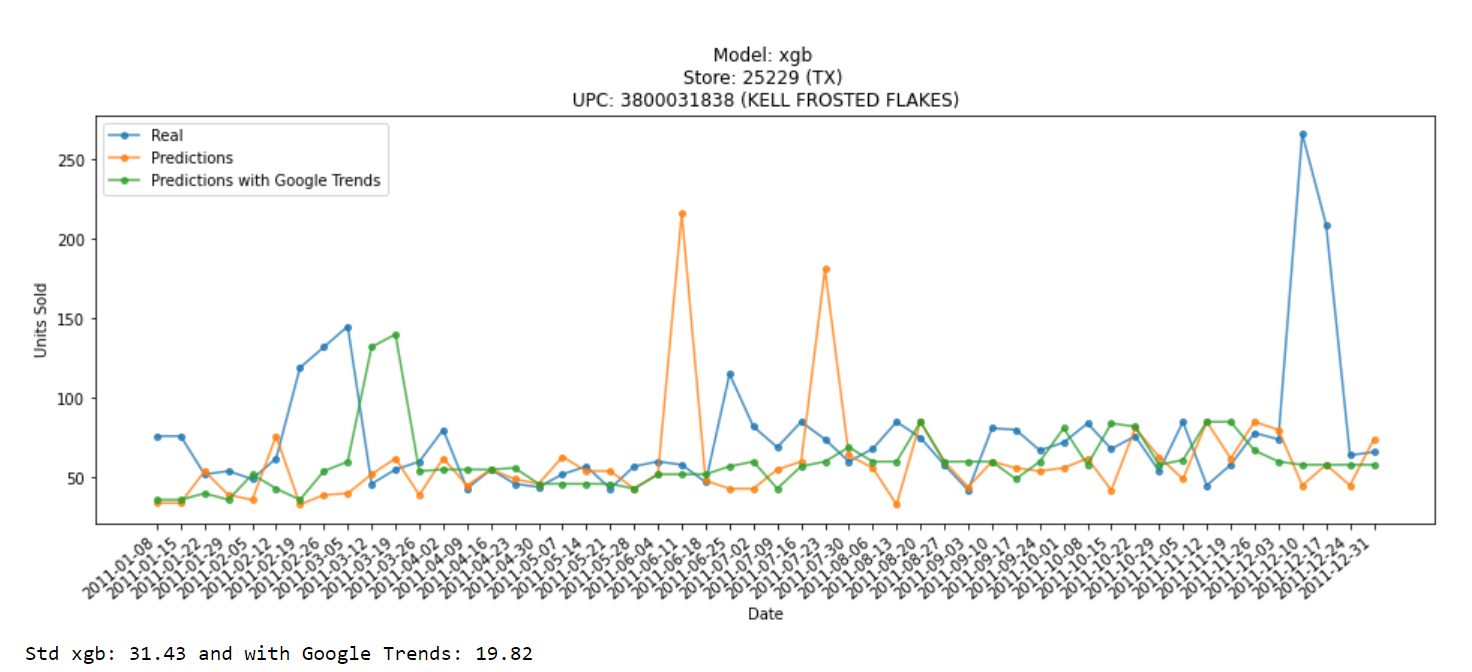
The significant growth in an online e-commerce business, especially during the COVID-19 pandemic, has led to a structural change in the retail industry, presenting novel challenges and opportunities in demand forecasting to provide the right product at the right place and time for the right price.
The primary objective of this experiment is to propose a methodological framework to incorporate external data, particularly from Google Trends, in retail sales forecasting by leveraging modern machine learning techniques.
In this project, we will use the Brazilian e-commerce by Olist as well as the Breakfast at the Frat by dunnhumby public datasets to conduct a quantitative experiment in which we compare the predictive performance of sales forecasts of the following models:
- The Seasonal Autoregressive Integrated Moving Average (SARIMA) model
- The Facebook Prophet tool (FBProphet)
- The Extreme Gradient Boosting algorithm (XGBoost)
- A recurrent neural network with long short-term memory (LSTM)
Various performance metrics are used to measure forecasting accuracy, and the performance of all forecasting models is benchmarked against a naïve model.
How you can do it: You can find the source code with a detailed explanation of the experiment structure on the Feras Al-Basha GitHub repository.
The experiment compares the results of using different input types through forecasting models and checks if it can produce better predictions. It’s a great project to experiment with sales forecasting models and model performance evaluation.
11. Lean Six Sigma with Python — Kruskal Wallis Test
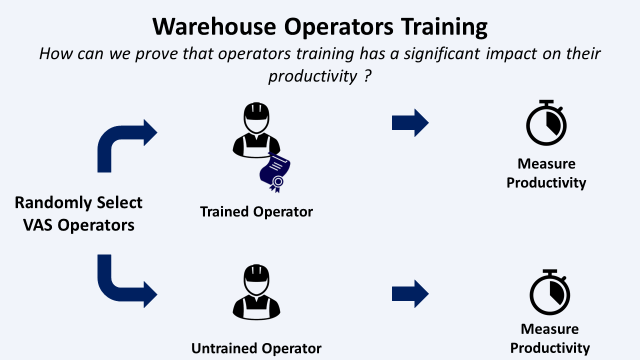
Lean Six Sigma (LSS) is a widely used method for improving supply chain management based on a stepwise approach to process improvements.
In this project, we will explore how, in the analysis step, Python can be used to test hypotheses and understand what could improve the performance metrics of a specific process. We will use the Kruskal-Wallis test to confirm if a particular training positively impacts the operators’ productivity.
The process is broken down into:
- Scenario: Setting up the constraints and the assumptions of the problem
- EDA: exploring the data and coming up with the hypothesis to test
- Analysis of Variance (ANOVA): Calculating the p-value and validating the assumptions of ANOVA
- Kruskal-Wallis test and conclusion: Using the Kruskal-Wallis Test to check if the difference in means is due to random fluctuation and then coming up with final insights and experiment conclusion.
How you can do it: You can follow this tutorial by Samir Saci, which details the process steps and provisioning of the project’s source code. You can also check this video to learn more about the Kruskal-Wallis Test. If you want to experiment with applying other parts of LSS, try using the Chi-squared test or simple logistic regression.
12. Affirm, Inc.: Merchant Application Analysis Take-Home
![]()
This Affirm checkout data take-home challenge requires you to review event data to identify any data integrity issues, calculate conversion rates through the checkout funnel by day, and derive insights that could enhance Affirm’s business model. Your analysis should also explore how the application rate varies across different merchant categories, utilizing the provided datasets.
To guide your analysis, consider the following points:
- Ensure all IDs (merchant_id, user_id, checkout_id) are consistently populated and there are no duplicate entries.
- Identify any discrepancies between events in funnel.csv and completed checkouts in loans.csv.
- Calculate the conversion rates for each stage in the checkout process, segmented by date and merchant category.
A task like this might be assigned to a business analyst or data analyst at Affirm or a similar fintech company.
Additional Supply Chain Datasets
Here are more supply chain datasets that you can use to experiment with different supply chain analytics techniques:
Learn More with Interview Query
You can also check out these helpful resources from Interview Query:
- Classification Machine Learning Projects and Datasets – Great ideas for doing classification machine learning projects.
- Machine Learning Course – See our new machine learning course, which includes modeling, Python, and ML system design sections.
- Interview Questions – 500+ real data science interview questions in product sense, data analytics, machine learning, and more.
- Top 10 Regression Projects & Datasets – Using regression analysis, ideas for more machine learning projects.