
R Interview Questions (2025) – R Programming & Data Science Prep


Introduction
R has become a core language in the data science world, especially in roles that demand strong statistical analysis. R interview questions are now standard in hiring processes at companies like Microsoft, Google, and major pharmaceutical firms. As of 2025, R is used by approximately 45% of data scientists, according to upGrad, highlighting its strong presence across the industry.
You won’t just be asked about syntax—these interviews often test how you use R in real-world data problems. This guide covers practical R programming interview questions to help you prepare for Data Scientist, Research Analyst, or Statistical Analyst roles. From modeling and reporting to wrangling messy datasets, we’ll focus on what actually matters in the job.
What Are R Programming Interview Questions?
R language interview questions don’t just test if you can write a for loop or call ggplot2. They’re designed to check how well you understand data—statistically, structurally, and visually. Interviewers want to know: can you wrangle messy datasets, choose the right model, and explain the results to someone less technical?
R language interview questions don’t just test if you can write a for loop or call ggplot2. They’re designed to check how well you understand data—statistically, structurally, and visually. Interviewers want to know: can you wrangle messy datasets, choose the right model, and explain the results to someone less technical?
Quick R Programming "Cheat Sheet"
You won’t just be asked to write a few lines of R syntax and call it a day. Interviewers want to see how you think—how you break down a data problem, clean messy inputs, and choose the right approach (not just the right function).
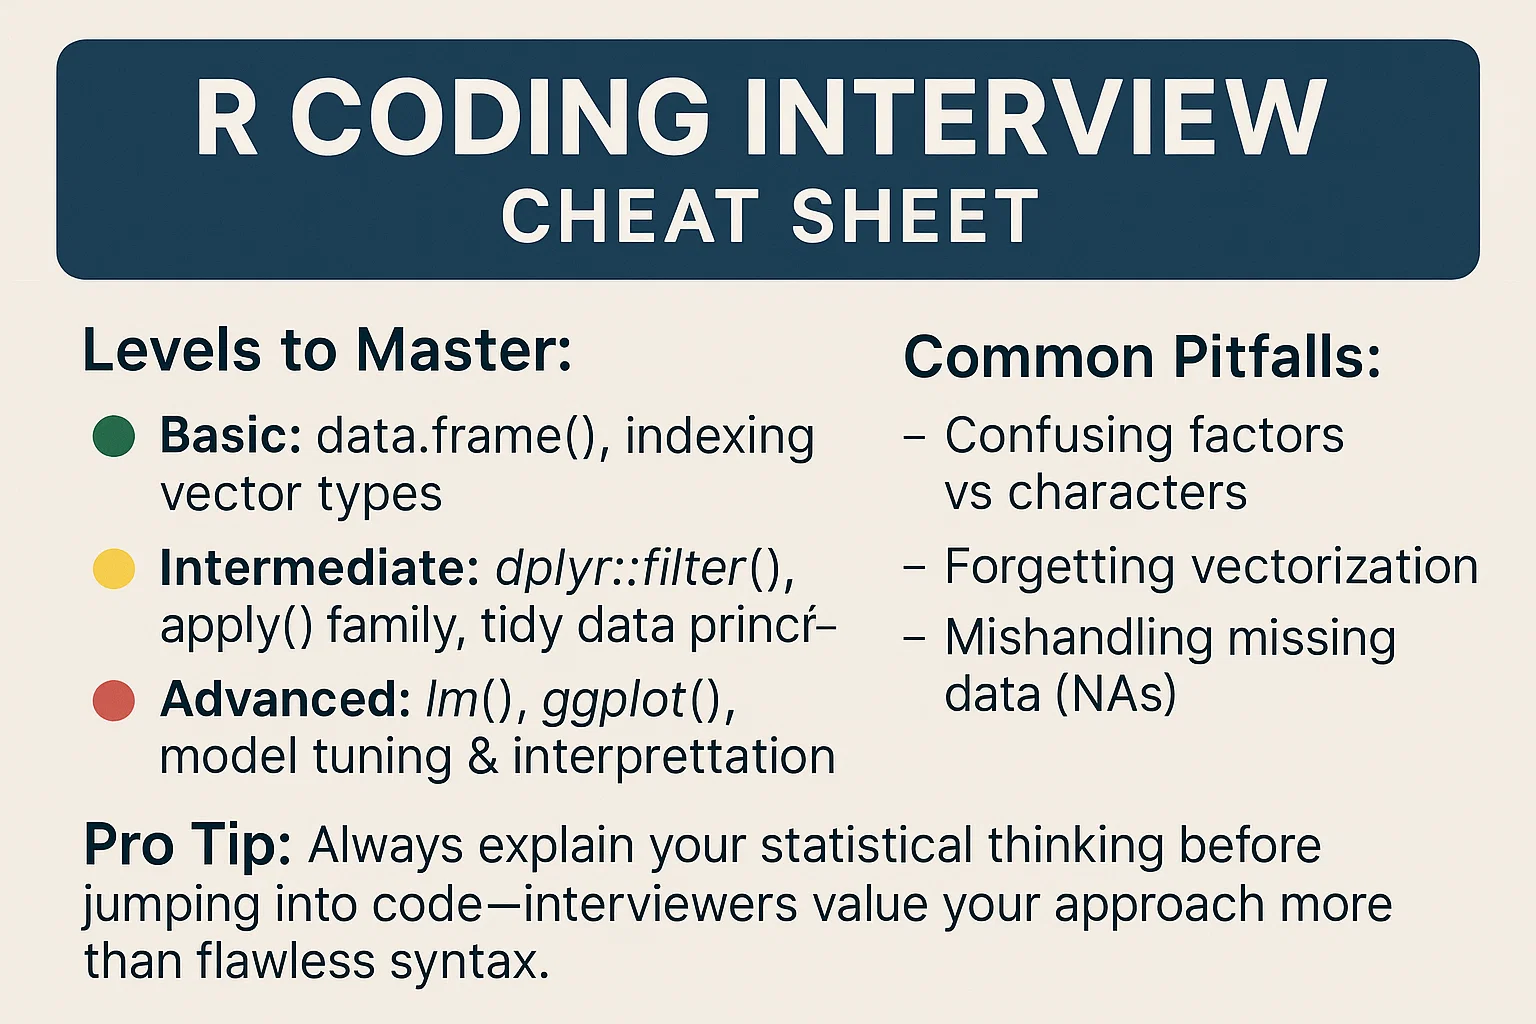
Expect R coding interview questions to cover multiple levels, from creating basic data frames to applying linear models. But don’t overlook what trips most people up: misreading factor variables, misusing NAs, or overcomplicating what could be vectorized.
Want to go deeper? Start practicing real-world R questions that mirror what you’ll face in interviews.
Basic R Interview Questions (0–2 Years Experience)
If you’re applying for entry-level roles, expect R interview questions to focus heavily on the fundamentals. Employers want to know that you understand how R handles data—its types, structures, and quirks—before they test you on modeling or analysis.
If you’re applying for entry-level roles, expect R interview questions to focus heavily on the fundamentals. Employers want to know that you understand how R handles data—its types, structures, and quirks—before they test you on modeling or analysis.
R Fundamentals
These are the bread-and-butter concepts that come up in most R interview questions—data types, vectors, lists, and functions you’ll use daily. Whether you’re manipulating tables or writing your first scripts, these building blocks form the foundation of how R thinks about data.
1. What’s the difference between numeric, integer, and double types in R?
In R, numeric is a broad category that includes both double and integer. By default, numbers like 5 are stored as double unless explicitly cast with as.integer(). This distinction matters for type-checking or memory-sensitive operations.
2. How are vectors and lists different in R?
Vectors in R are homogeneous: they can only contain elements of the same type. Lists, on the other hand, are heterogeneous and can store different types (e.g., a number, a string, and a data frame). This makes lists more flexible but also more complex to manipulate.
3. How do you create and subset a data frame in R?
You can create a data frame using data.frame(). To subset, you can use square brackets: df[1, 2] for the first row, second column, or df["colname"] to extract a column. You can also use dplyr::filter() for cleaner syntax when filtering rows.
4. What’s the difference between apply(), lapply(), and sapply()
apply() works on matrices and arrays; lapply() applies a function over a list and always returns a list; sapply() is a wrapper over lapply() that tries to simplify the output (e.g., return a vector instead of a list).
Data Import & Basic Operations
Once you’re comfortable with the core syntax, you’ll be expected to handle real data and perform operations like moving averages, aggregations, and filtering. These questions test how well you can write practical R functions, deal with input edge cases, and use built-in tools efficiently.
1. How do you compute a moving window average?
This question checks your ability to implement a moving average using a rolling window. Unlike fixed-window functions, this one starts with partial windows before reaching full size.
    moving_window <- function(nums, window_size) {
      sapply(seq_along(nums), function(i) {
        mean(nums[pmax(1, i - window_size + 1):i])
      })
    }

    moving_window(c(1, 2, 3, 4, 5, 6), 4)
    # [1] 1.0 1.5 2.0 2.5 3.5 4.5
The approach uses sapply() to iterate over the list, and pmax() to handle the early cases where a full window doesn’t yet exist.
2. Sum all elements in a given matrix
Use the sum() function along with matrix manipulation tools like as.matrix() to convert and sum over the structure. In R, this could look like sum(as.matrix(my_matrix)). Make sure the input format is compatible (e.g., data frame, list of lists, or matrix). This question is fundamental for ensuring you understand how to traverse and manipulate basic R data structures.
3. Find and return all the prime numbers in an array of integers
Implement a prime-checking helper function, then apply it across the array using sapply() or Filter(). Vectorization improves performance, so avoid loops where possible. Also, consider edge cases like empty arrays or non-integer input. This problem highlights your ability to work with custom logic in combination with R’s functional tools.
4. Find the maximum number in a list
Use R’s built-in max() function for straightforward extraction. Add checks to return NULL or NA when the input is empty to handle edge cases. For lists, ensure proper unwrapping using unlist() before applying aggregation. This checks your awareness of R’s data types and basic condition handling.
Intermediate R Interview Questions (3–5 Years Experience)
If you’ve been working with R for a few years, interviewers will expect more than just clean syntax. These R interview questions for data analysts and mid-level data scientists focus on chaining operations, applying statistical methods, and handling complex data transformations. You’ll be tested on how you think—especially in scenarios involving joins, reshaping, or inference.
Data Manipulation & Analysis
At this stage, the focus shifts to fluency. Can you reshape a dataset without looking it up? Can you join and summarize in a single pipeline? These questions test your ability to write efficient, readable R code to support real-world analytics—often under messy data conditions or tight deadlines.
1. Flatten an N-dimensional array to a 1D array
In R, the most efficient solution uses unlist() to reduce nested lists into a flat vector. You may wrap it in a function for safety and clarity. This is useful in data wrangling when importing complex JSON or hierarchical structures. It shows your flexibility in handling unstructured inputs during ETL tasks.
2. Find the index with equal left and right sum
Loop through each index or use vectorized operations to split the array and compute sum(left) == sum(right). Optimising with cumulative sums can improve performance. This is less about syntax and more about algorithmic thinking in R. It’s a good test of logic required in modeling and segmentation.
3. Perform a join and group_by operation to find average order value per customer
Use dplyr::left_join() to merge customer and orders tables by customer_id. Then apply group_by(customer_id) followed by summarise(avg_order_value = mean(order_amount)). This problem tests your ability to chain together common dplyr verbs for relational analysis. It’s a key task in any analytics role involving customer-level aggregation.
4. Reshape a wide-format dataset of monthly sales into long format using tidyr
Apply pivot_longer() to convert month columns like jan_sales, feb_sales, etc., into a tidy format with month and sales columns. This standardises the structure for further analysis or visualization. It also shows your grasp of tidy data principles. Transforming data shapes is fundamental in daily analytics workflows.
5. Perform a t-test comparing means of two groups from a data frame
Use t.test() with a formula interface, e.g., t.test(score ~ group, data = df), after ensuring your data is grouped appropriately. Confirm assumptions like normality or use wilcox.test() as a non-parametric alternative. This problem showcases your readiness for real analysis where decision-making depends on inferential statistics. Understanding how to apply statistical tests is expected from analysts with 3–5 years of experience.
Data Visualization
Whether it’s ggplot2 or Shiny, mid-level R roles require more than static charts. You’re expected to present data clearly, sometimes interactively, to help teams make decisions. These questions test your ability to turn insights into visuals—while also gauging whether you can build tools for others using R’s reactive frameworks.
1. Customize a ggplot2 chart to show monthly trends with annotated labels and theme changes
Use ggplot2 with geom_line() for trend visualization, then layer geom_text() for annotations and theme_minimal() or theme_classic() to update the look. Modify axis titles, color palettes, and legend placement to suit your narrative. Adding scale_x_date() or scale_y_continuous() allows for fine control over axis formatting. This tests both technical fluency with ggplot2 and your ability to communicate data stories visually.
2. Create an interactive visualization with filtering using Shiny
Build a basic shinyApp() that allows users to select filters (e.g., product category or date range) to dynamically update a plot. Use reactive() inputs to trigger changes in renderPlot() or renderTable(). Pair ggplot2 with plotOutput() and selectInput() for a practical interface. This checks if you understand reactivity, user-driven inputs, and how to turn static R outputs into dynamic tools.
3. Design a data dashboard in R using Shiny and flexdashboard
Structure your dashboard with sections like KPIs, time-series trends, and breakdowns using flexdashboard::valueBox() and renderPlot(). Include tabs or navigation for different business units or metrics. Integrate interactivity via shiny::input selectors to tailor what users see.
Advanced R Interview Questions (5+ Years Experience)
For senior roles, R interview questions move beyond syntax and tidyverse fluency. You’re expected to demonstrate experience with statistical modeling, scalable workflows, and production-level code. These R interview questions and answers for experienced candidates are designed to surface how you architect solutions, not just how you execute them.
Statistical Modeling & Performance
These questions test your ability to build models with business impact, optimize code for performance, and design tools that scale within teams. Whether it’s developing a churn model or speeding up a slow analysis pipeline, your interviewer wants to hear how you handle trade-offs, write reusable code, and think strategically about performance.
1. You have customer subscription data. Walk us through how you’d build and validate a churn model using R. What preprocessing steps, algorithms, and evaluation metrics would you use?
Start by exploring feature importance using techniques like stepwise regression or LASSO (glmnet). Evaluate model performance via caret::train() with cross-validation and appropriate metrics (AUC, accuracy, etc.). Consider alternatives like randomForest, xgboost, or nnet depending on the data structure. This tests your ability to choose and tune models for business-critical outcomes and scale them for real-world datasets.
2. Optimize a slow-running R script working on large data frames
Begin with profiling tools like profvis() or Rprof() to locate bottlenecks. Replace loops with vectorized operations (apply, dplyr::mutate, etc.) and use data.table for large in-memory datasets. Where needed, parallelize tasks using parallel::mclapply() or furrr. This question evaluates your fluency with efficient R code, a necessity for working in production environments.
3. Develop a custom R package to encapsulate internal analytics functions
Use devtools::create() to structure your package, including folders for R/, tests/, and documentation. Write modular functions with clear inputs/outputs, then test using testthat::test_that(). Include a DESCRIPTION file, manual pages with roxygen2, and consider usethis for automating setup. Package development signals advanced proficiency and is often expected from senior R professionals managing reusable codebases.
Platform-Specific R Variations
If you’re switching between R and Python, or prepping for cross-platform questions, expect interviewers to dig into how you adapt your thinking—not just your syntax. Questions that compare R and Python, or how you use Shiny versus notebooks, are common in teams that use both languages. The keyword here is fluency, not loyalty.
Below are a few interview themes where differences show up most.
R vs Python
Expect questions like: “How would you merge two tables in both R and Python?” While data.frame() and pandas.DataFrame() serve similar purposes, operations like joins, filtering, and reshaping often follow different idioms. In R, you’re likely chaining verbs with %>%; in Python, you’re writing method chains like .merge() or .groupby().
R Shiny
Interactive dashboards in R use a server–UI model, where logic and layout are split into reactive components. If you’ve only used Python’s static plots or Plotly Dash, this pattern may feel more modular. Shiny also requires a bit of functional thinking—reactive(), observe(), and render*() functions form the core.
R + SQL
Connecting to databases in R often means reaching for the DBI and dbplyr packages. You write queries as dplyr code, and it gets translated to SQL behind the scenes. Python, by contrast, typically runs raw SQL via connectors like psycopg2 or SQLAlchemy.
RStudio vs Jupyter
You might be asked what environment you prefer and why. RStudio’s strength lies in R Markdown—great for literate programming and reports. Jupyter is more common in mixed-language shops and can feel friendlier for rapid prototyping. Knowing both adds flexibility to how you present and test your work.
R Programming Optimization & Strategy Tips
Most data scientist R interview questions go beyond syntax. You’ll be expected to show how you approach real-world problems—how you structure your analysis, explain trade-offs, and adapt your workflow to different types of data.
Interview Strategy
Start every problem by clarifying the objective. What’s the statistical question behind the task? Is it an A/B test, a churn model, or a pipeline that needs speeding up? Walking through your thinking helps the interviewer see how you’d work on a real team (not just pass a test).
Your R workflow should feel second nature: import, tidy, transform, visualize, model, then communicate. That last step—explaining your output—is often where strong candidates stand out. It’s not enough to generate a result. You need to say what it means, how reliable it is, and what you’d do next.
Interviewers may also ask about your decision-making. When do you reach for tidyverse instead of base R? Would you optimize for speed or interpretability? Having a clear rationale for your choices shows experience, not just fluency.
Technical Preparation Tips
To build confidence, make sure you’re comfortable with vectorization. Most loops in R can be replaced with faster, cleaner alternatives using apply() or mutate(). It’s also worth knowing when each approach works best—vectorized code can be elegant, but not always the most readable.
Practice switching between dplyr and base functions. Some interviewers prefer pure R, while others work in tidyverse-heavy teams. Being fluent in both means you can adapt on the fly.
Finally, focus on interpreting results, not just producing them. Whether it’s a p-value, confidence interval, or feature importance chart, show that you can turn numbers into insights. That’s what makes you valuable beyond the coding test.
Frequently Asked Questions About R Interviews
How often are R programming skills tested in data science interviews?
R appears in around 60% of data science job postings and is commonly tested in roles within academia, pharmaceuticals, and finance. It’s especially expected for quantitative analyst and research-heavy positions.
Do I need to memorize all R functions and syntax?
No. You should know core functions and workflows, but it’s perfectly fine to look up exact syntax. What matters more is how you explain your approach and interpret results.
What’s the hardest type of R interview question?
Questions that ask you to build a full statistical model—starting with cleaning, exploring, fitting, validating, and tying it back to business goals. These test both depth and clarity.
Should I use base R or tidyverse in interviews?
Stick to what you’re comfortable with, but show that you understand both. Tidyverse is often preferred for readability, while base R is still valued in performance-sensitive environments.
How do R interviews differ from Python data science interviews?
R interviews often focus more on statistical workflows and data analysis, while Python interviews may emphasize general programming, scripting, or integration with other systems.
Conclusion
Whether you’re just starting out or applying for senior data science roles, mastering R interview questions comes down to two things: knowing how R works and being able to explain how you think. The best candidates don’t just code—they connect the technical work to the business problem.
If you’re ready to keep practicing, explore our R question bank for real interview problems asked by top companies. For a more structured approach, our learning paths guide you from fundamentals to advanced analytics. And if you’re looking to test yourself in a timed setting, try solving a few data science challenges.
The more you practice explaining your decisions—not just writing the code—the more confident you’ll be when the real interview comes around.