
Top 39 Probability Interview Questions and Answers (Updated for 2025)

Overview
Probability interview questions are often asked in both data science and data analytics fields at FAANG companies and other big tech firms.
Testing your probability knowledge provides companies with a good idea of your analytical reasoning skills and intelligence, and they often take the form of a case study. You will be given a scenario and then asked to compute the probability for that given scenario. Besides case studies, conceptual questions are common too.
To recap, the most common types of data science probability questions are:
- Conceptual Probability Interview Questions - These are definition-based questions that cover basic concepts like distributions, covariance and correlation.
- Events Probability Interview Questions - These are simple case studies where you calculate the probability of an event.
- Combinatorics Probability Interview Questions - These are logic-based questions that assess your knowledge of combinatorics.
- Probability Distributions Interview Questions - These questions are case-based and ask you to calculate probability based on distributions.
Ultimately, to answer probability interview questions, you need a strong basis in probability theory, and therefore it is recommended to brush up on it during your interview prep.
Conceptual Probability Interview Questions

Conceptual questions test your knowledge of probability theory. These are short, quiz-like questions that ask about types of distributions, definitions of concepts like the Central Limit Theorem, or use cases for concepts like Bayes’ Theorem.
To answer this type of probability question successfully, your answer must be accessible to a layperson.
1. How would you explain a probability distribution to a layperson?
Probability distributions represent random variables and associated probabilities of different outcomes. In essence, a distribution maps the probability of various outcomes.
For example, a distribution of test grades might look similar to a normal distribution, AKA bell curve, with the highest number of students receiving Cs and Bs and a smaller percentage of students failing or receiving a perfect score. In this way, the center of the distribution would be the highest, while outcomes at either end of the scale fall lower and lower.
2. What is the difference between the Bernoulli and binomial distribution?
A Bernoulli distribution models the event of conducting one trial of an experiment with only two possible outcomes, like a coin flip (Heads/Tails) or which team will win the Super Bowl in a given year (49ers/Chargers).
Binomial distribution models the event of conducting n number of trials that have two possible outcomes, like tossing a coin 100 times (Heads/Tails) or asking 50 people if they have visited Hong Kong (Yes/No).
3. Explain how a probability distribution could not be normal and give an example scenario.
A probability distribution is not normal if most of its observations do not cluster around the mean, forming the bell curve. An example of a non-normal probability distribution is a uniform distribution, in which all values are equally likely to occur within a given range.
A random number generator set to produce only the numbers 1-5 would create such a non-normal distribution, as each value would be equally represented in your distribution after several hundred iterations.
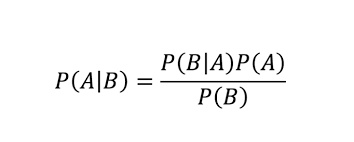
4. What is Bayes’ Theorem?
In probability theory and statistics, Bayes’ Theorem refers to the probability of an event based on conditions that exist. Essentially, the theorem allows us to update our beliefs about a random event based on what we know about the event.
For example, if the risk of customer churn increases the longer a user has been inactive, Bayes’ Theorem allows us to more accurately assess the churn risk for users because we can condition the probability of churn to how long the user has been inactive.
5. What is the difference between covariance and correlation? Provide an example.
Covariance can take on any numeric value, while correlation can only take on values between -1 (strong inverse correlation) and 1 (strong direct correlation).
Note: A zero value for correlation means there is no relationship between the two variables.
Therefore, the relationship between two variables can have a covariance that seems high but only a middling correlation value.
6. What is the difference between the Law of Large Numbers and the Central Limit Theorem?
The Law of Large Numbers says that a sample mean is an unbiased estimator for the population mean and that the error of that mean decreases as the sample size grows.
The average of your sample is predictive of the average of the entire population, becoming more accurate with a larger sample, while the Central Limit Theorem states that as a sample size n becomes larger, its distribution can be approximated by the normal distribution (it will appear more like a normal Bell Curve).
7. How do Probability Mass Functions and Probability Density Functions differ?
Probability mass functions describe discrete distributions. Using probability mass functions, we can determine the probability of an event to be equal to a target value. In other words, we are sure that an event will always equal x.
Density mass functions describe continuous probability distributions. Using density mass functions, we can determine the probability of an event within a range around the target value, which can be found by calculating the area under the interval curve.
8. How would you explain confidence intervals to someone with no data background?
In probability, confidence intervals refer to a range of values that you expect your estimate to fall between if you were to rerun a test. Confidence intervals are a range that is equal to the mean of your estimate plus or minus the variation.
For example, if a presidential popularity poll had a confidence interval of 93%, encompassing a 50%-55% approval, it would be expected that, if you re-polled your sample 100 more times, 93 times the estimate would fall between the upper and lower values of your interval.
Those other seven events would fall outside, which is to say either below 50% or above 55%. More polling would allow you to get closer to the true population average and narrow the interval.
9. What is an unbiased estimator? Give an example for a layperson.
An unbiased estimator is an accurate statistic that is used to approximate a population parameter. An example would be taking a sample of 10,000 voters in a political poll to estimate the total voting population.
There is no such thing as a perfectly unbiased estimator because this would require you to accurately survey the entire population for your sample, impossible amongst what is often millions of eligible respondents.
10. Say you flip a coin 10 times. It comes up tails 8 times and heads twice. Is this a fair coin?
To determine if a coin that lands on tails 8 times out of 10 flips is fair, we use the binomial distribution, which models the probability of outcomes in experiments with two possible results (heads or tails). For a fair coin, the probability of getting exactly 2 heads (and 8 tails) out of 10 flips is quite low, suggesting that the coin might not be fair.
Checking with a different bias, such as a 40% chance of heads, shows a higher probability for this outcome, indicating the coin could be biased towards tails. Advanced statistical methods can further analyze the coin’s fairness.
11. What is the Martingale strategy, and how might it be used in online advertising?
Martingale strategy is a gambling concept that involves doubling one’s bet after each loss with the intention of recovering previous losses and making a profit.
This can be adapted and applied in scenarios involving sequential decision-making or hypothesis testing. One potential application is in the field of online advertising, where advertisers may use a Martingale-like approach to adjust bidding strategies for ad placements based on past performance.
| Question | Topic | Difficulty | ||||||||||||||||||||||
|---|---|---|---|---|---|---|---|---|---|---|---|---|---|---|---|---|---|---|---|---|---|---|---|---|
SQL | Easy | |||||||||||||||||||||||
We’re given two tables, a Write a query that returns all neighborhoods that have 0 users. Example: Input:
Output:
| ||||||||||||||||||||||||
SQL | Easy | |||||||||||||||||||||||
SQL | Hard | |||||||||||||||||||||||
SQL | Easy | |
Machine Learning | Medium | |
Statistics | Medium | |
SQL | Hard | |
Machine Learning | Medium | |
Python | Easy | |
Deep Learning | Hard | |
SQL | Medium | |
Statistics | Easy | |
Machine Learning | Hard |
Events Probability Interview Questions
The main object of study in probability is events. An event is simply an outcome of some experiment, such as flipping a coin. Questions on events typically focus on games of chance and ask you to determine the probability of an event occurring.
These probability interview questions deal with independent and dependent events:
12. What is the difference between independent and dependent events in probability? Provide an example for each.
Independent events do not affect the outcome of another event, while dependent events do affect the other’s outcomes.
For example, if you were asked to toss a coin 100 times, a coin flip would be an independent event because the probability of each successive flip would remain 50-50. Getting heads on the first flip does not influence your chances of either a heads or tails on the second. Drawing a card from a deck (without replacement) would be a dependent event, because with each draw the deck gets smaller, affecting the outcome of each successive draw.
13. A co-worker tells you he has two children, and that at least one is a boy. What is the probability that the co-worker has two boys? (Assume sex is assigned by the hospital at birth).
First, start by listing the possibilities. There are four possible outcomes for this family:
- The first and second are boys (BB).
- First is a boy, and second is a girl (BG).
- First is a girl, and second is a boy (GB).
- The first and second are girls (GG).
We can rule out No. 4 since we know at least one of the children is already a boy. Out of the three remaining, only 1 is right. Therefore, the probability is ⅓.
14. There are two coins. One is fair, and the other is biased (the probability of heads is ¾). You select a coin at random and flip it two times. What is the probability that both flips result in the same side?
First, separate it into two instances. One would be if you grabbed the fair coin, and the second would be for the biased coin. Then, solve the probability of flipping the same side for both. Then, you would account for the probabilities of flipping heads both times and the probability of flipping tails both times. Finally, you would need to account for the probability of selecting the fair or biased coin.
15. What’s the probability that zebras don’t collide on the perimeter of an equal length triangle?
More context: Each of the three zebras is sitting on the corner of an equal-length triangle. Each zebra randomly picks a direction and only runs along the side, never deviating from the triangle’s outline.
To answer this question, think about the scenarios in which the zebras will not collide:
- If all three move clockwise
- If all three move counterclockwise.
Then start calculating how the zebras could interact outside of those scenarios that would result in collisions.
16. You pull two cards, one at a time, from a deck of cards, without replacement. What is the probability that the second card you pick has a different color, or different suit, than the first card?
Break this down into two different cases for the different colors or different shapes:
Case 1: Pulling a card of a different color
Assuming the first card is pulled off a certain color, let’s say red, we now have 26 choices for a card of the other color (black) available from a total of 51 remaining cards. Therefore the probability of pulling a card of different color is equivalent to 26⁄51.
Case 2: Pulling a card of a different suit
Since in a normal deck of playing cards all suits are composed of only two different colors (diamonds and hearts are red, and clubs and spades are black), a different suit doesn’t necessarily mean a different color than the first card we pick. The “or color” part is then redundant.
We removed one card from the 52-card deck, so we will not pull it again. That means if you started with 4 suits of 13 cards each, you would have 13*3 cards left that would be of a different suit from the first in the deck, and 51 remaining cards in the deck.
Therefore, you have a 39⁄51 chance of pulling a card of a different suit or color.
17. You play a game that costs $10 per roll of two fair six-sided dice. If the sum of the two dice equals 7, you win $21. Is the game worth playing?
Hint: First, we consider how many ways we can possibly roll a seven. Let D1 and D2 be the result of the first and second role, respectively. Therefore, there are six ways you can roll a 7.
- D1 (1), D2 (6)
- D1 (2), D2 (5)
- D1 (3), D2 (4)
- D1 (4), D2 (3)
- D1 (5), D2 (2)
- D1 (6), D2 (1)
18. Compute the probability that you will get a pair (two cards of the same rank) from a hand of N cards.
More Context: Let’s say that you are drawing N cards (without replacement) from a standard 52-card poker deck. Each card is unique and part of 4 different suits and 13 different ranks.
19. Compute the probability that red marble, or two consecutively drawn red marbles, originate from Bucket #1.
We have two buckets full of marbles. There are 30 red marbles and 10 black marbles in Bucket #1 and 20 red and 20 Black marbles in Bucket #2. Your friend secretly pulls a marble from one of the two buckets and shows you that the marble is red.
What is the probability that it was pulled from Bucket #1?
| Question | Topic | Difficulty | ||||||||||||||||||||||
|---|---|---|---|---|---|---|---|---|---|---|---|---|---|---|---|---|---|---|---|---|---|---|---|---|
SQL | Easy | |||||||||||||||||||||||
We’re given two tables, a Write a query that returns all neighborhoods that have 0 users. Example: Input:
Output:
| ||||||||||||||||||||||||
SQL | Easy | |||||||||||||||||||||||
SQL | Hard | |||||||||||||||||||||||
SQL | Easy | |
Machine Learning | Medium | |
Statistics | Medium | |
SQL | Hard | |
Machine Learning | Medium | |
Python | Easy | |
Deep Learning | Hard | |
SQL | Medium | |
Statistics | Easy | |
Machine Learning | Hard |
Combinatorics Probability Interview Questions
Combinatorics refers to the study of counting things. Many probability interview questions ask questions related to combinations, in which the order doesn’t matter, and permutations, in which the order does matter.
Combinatorics questions might be “how many ways can you arrange n books?” or “How many ways can you choose a committee of K people from a pool of N?”
| Question | Topic | Difficulty | ||||||||||||||||||||||
|---|---|---|---|---|---|---|---|---|---|---|---|---|---|---|---|---|---|---|---|---|---|---|---|---|
SQL | Easy | |||||||||||||||||||||||
We’re given two tables, a Write a query that returns all neighborhoods that have 0 users. Example: Input:
Output:
| ||||||||||||||||||||||||
SQL | Easy | |||||||||||||||||||||||
SQL | Hard | |||||||||||||||||||||||
SQL | Easy | |
Machine Learning | Medium | |
Statistics | Medium | |
SQL | Hard | |
Machine Learning | Medium | |
Python | Easy | |
Deep Learning | Hard | |
SQL | Medium | |
Statistics | Easy | |
Machine Learning | Hard |
20. What is the difference between a combination and a permutation?
The key difference is whether the order matters or not. In combinations, you would select r elements from a set n (without replacement). In combinations, the **order does not matter are frequently used for group data. An example would be picking 3 items off a restaurant menu for your entrees, and it hardly makes a difference which item you order first or last, all will come out of the kitchen at the same time.
With permutations, you would pick r elements from a set of n (without replacement), but the order does matter. An example would be selecting your 1st, 2nd, or 3rd choices for kickball teammates or choosing the Top 3 favorite movies in order; in both cases, your top choice comes first.
21. What is the difference between discrete and continuous variables? Provide an example for each.
Discrete variables are countable, while continuous variables are measurable. A discrete variable would be the number of faberge eggs created, there are only so many in the world, and no more are being produced. Other examples of discrete variables could be the number of students in a class or the amount of money in your wallet.
A continuous variable, on the other hand, would be something like age because you could continue to count it forever, e.g. I am 33 years old, 9 months, 2 days, 5 hours, 4 seconds…. on and on. The continuous values are infinitely divisible.
You can turn a continuous variable into a discrete variable, by making it countable. For example, you could count a toddler’s age in months.
22. How many coin flips would you expect to need to get two tails in a row?
We can start by thinking about possible outcomes:
- If our first flip is heads, we have used 1 flip, and we will have to do x more flips to satisfy the question. The probability of heads is 1⁄2, and the total flips required now would be x+1.
- If our first flip is tails and the second is heads, we have used 2 flips, and will need x more flips to satisfy the question. The probability of a tails-heads combination is 1⁄4, and the flips required would now be x+2.
- Lastly, we could flip tails-tails. The probability of this happening is 1⁄4, and the total number of flips required is 2.
With this information, we can then calculate how many flips you would expect to get two tails in a row:
x = (1⁄2)(x+1) + (1⁄4)(x+2) + (1⁄4)2
x = 1⁄2 [ (1+x) + 1⁄2(2+x) + 1 ]
x = 1⁄2 [ 1 + x + 1 + x/2 + 1 ]
x / 4 = 3⁄2
x = 6
23. What is the percentage chance the review is actually fake when the algorithm detects it as fake?
More context: Let’s say we’re trying to determine fake reviews on our products. Based on past data, 98% of reviews are legitimate, and 2% are fake.
If a review is fake, there is a 95% chance that the machine learning algorithm identifies it as fake. If a review is legitimate, there is a 90% chance that the machine learning algorithm identifies it as legitimate.
24. Let’s say you have to draw two cards from a shuffled deck, one at a time. What’s the probability that the second card is not an Ace?
Here’s a hint:
We can generalize to two scenarios of drawing an ace on the second card:
- Drawing an ace on the first card and an ace on the second card
- Drawing not an ace on the first card and an ace on the second card
If we model the probability of the first scenario we can multiply the two probabilities of each occurrence to get the actual probability.
- Drawing an ace on the first card: 4⁄52
- Drawing an ace on the second card: 3⁄51
Now the second scenario:
- Drawing not an ace on the first card: 48⁄52
- Drawing an ace on the second card: 4⁄51
25. You have a deck of 500 cards numbered from 1 to 500. If all the cards are shuffled randomly, and you are asked to pick three cards, one at a time, what’s the probability of each subsequent card being larger than the previously drawn card?
Hint: Imagine this as a sample space problem ignoring all other distracting details. If you have to draw three different numbered cards without replacement, and they are all unique, then we are assuming that there will be, effectively, a lowest card, a middle card and a high card.
Let’s make it easy and assume we drew the numbers 1,2, and 3. In our scenario, if we drew (1,2,3), then that would be the winning scenario. But what’s the full range of outcomes we could draw? Let’s map out all of the possibilities.
26. What’s the probability that a movie is rated as “good”?
More context: Netflix has hired people to rate movies. Out of all of the raters, 80% of the raters carefully rated movies and rated 60% of the movies as good and 40% as bad.
The other 20% are lazy raters and rate 100% of the movies as good. For this question, assume all raters rate the same amount of movies.
27. Calculate the probability of one or both riders getting a coupon in a ride.
A driver using the app picks up two passengers.
- What is the probability of both riders getting the coupon?
- What is the probability that only one of them will get the coupon?
Hint: Think about what makes up the event that at least one driver gets a coupon.
Probability Distribution Interview Questions

Probability distributions are statistical functions that describe the likelihood of obtaining possible values that a random variable can take. In other words, the values of the variable will change based on the underlying probability distribution. This is one of the most common types asked in a probability interview question.
| Question | Topic | Difficulty | ||||||||||||||||||||||
|---|---|---|---|---|---|---|---|---|---|---|---|---|---|---|---|---|---|---|---|---|---|---|---|---|
SQL | Easy | |||||||||||||||||||||||
We’re given two tables, a Write a query that returns all neighborhoods that have 0 users. Example: Input:
Output:
| ||||||||||||||||||||||||
SQL | Easy | |||||||||||||||||||||||
SQL | Hard | |||||||||||||||||||||||
SQL | Easy | |
Machine Learning | Medium | |
Statistics | Medium | |
SQL | Hard | |
Machine Learning | Medium | |
Python | Easy | |
Deep Learning | Hard | |
SQL | Medium | |
Statistics | Easy | |
Machine Learning | Hard |
28. You roll two dice. What’s the probability of rolling at least one 3? What’s the probability of rolling a 3 given N dice?
Hint: In this scenario, it is much easier to solve by figuring out the combination of never rolling a 3. We can further break it down by understanding the probability of rolling a 3 on one die is ⅙. To not roll a three, we do 1- ⅙ = 5⁄6 . With two dice, we can multiply the probabilities together, and onward for our N dice given to us.
29. How many ways could you divide 12 players into 3 teams of 4?
With this question, the solution requires a multinomial distribution, with n=12 and k=3.
Note: In this problem, the players are indistinguishable from each other.
30. Let’s say there are two user sessions that both have a chance to convert of 0.5 (50%). What is the probability that they both converted?
An additional question: Given that there are N sessions and they convert with probability q, what is the expected number of converted sessions?
A few questions to ask yourself include “Does the outcome of one of the users really affect the outcome of the other user?” and “What are the rules for adding together many different experiment’s expectations?”
31. Given two standard normal random variables X and Y, what is the probability that 2X > Y?
Hint: What are some of the scenarios we can imagine when we randomly sample from each distribution? Write out each of the possibilities where X > Y and X < Y, as well as the possible values of X and Y in each.
32. If you had draws from a normal distribution with known parameters, how would you simulate draws from a uniform distribution?
A question like this tests your knowledge of the concepts of uniform and normal distributions.
There’s a simple answer to this. To simulate draws from a uniform distribution, you would plug the values into the normal cumulative distribution function (CDF) for the same random variable.
This is known as the Universality of the Uniform or Probability Integral Transform.
33. How far apart do the means need to be for a 50-50 mixture of two normal distributions to be bimodal?
The means would need to be more than two standard deviations apart.
34. What’s the probability of a swimmer surviving in a 5.6-foot lake?
Scenario: There’s a swimmer who is 5.8 feet tall and doesn’t know how to swim.
The swimmer wants to swim in a lake with an average depth of 5.6 feet with a standard deviation of 1 foot. Assume when the lake exceeds the swimmer’s height, the swimmer dies.
35. You flip a fair coin 576 times. Without using a calculator, calculate the probability of flipping at least 312 heads.
This question requires some memorization. At first glance, we can infer that it’s a binomial distribution problem, given that we have to guess the number of heads out of a number of trials.
Therefore it is similar to a binomial distribution with an n number of trials and a probability of success of p on each trial.
36. What is the probability that the three pieces can form a triangle?
Consider a stick of length 1. It is broken into three pieces at two randomly selected points. What is the probability that the three pieces can form a triangle?
37. Drawing from a random variable. How many days would it take to get a number higher than 2?
You’re drawing from a random variable that is normally distributed X∼N(0,1) once per day.
What is the expected number of days that it takes to draw a value that’s higher than 2?
38. Given three random variables independently and identically distributed from a uniform distribution of 0 to 4, what is the probability that the median of them is greater than 3?
If we break down this question, we’ll find that another way to phrase it is to ask what the probability is that at least two of the variables are larger than 3.
For example, if look at the combination of events that satisfy the condition, the events can be divided into two exclusive events.
Given these two events satisfy the condition of the median > 3, we can now calculate the probability of both of the events occurring.
39. A 5.8-foot-tall man wants to swim in a lake with an average depth of 5.6 feet and a standard deviation of 1 foot. What is the probability of his survival, assuming he dies if the depth exceeds his height?
As we are given the mean and standard deviation, we may want to consider modeling the lake depth D as a normally distributed random variable. In general, a normal distribution is the safest distribution to assume for any random variable whose distribution is not explicitly given.
Probabilities for normally distributed random variables are not usually calculated by hand since the probability density function of the normal distribution is very difficult to work with.
More Data Science Review Resources
Take our probability course to review concepts like distributions and combinatorics. Sign up for Interview Query to access a variety of data science interview resources, including: