DAU Spike
Start Timer
0:00:00
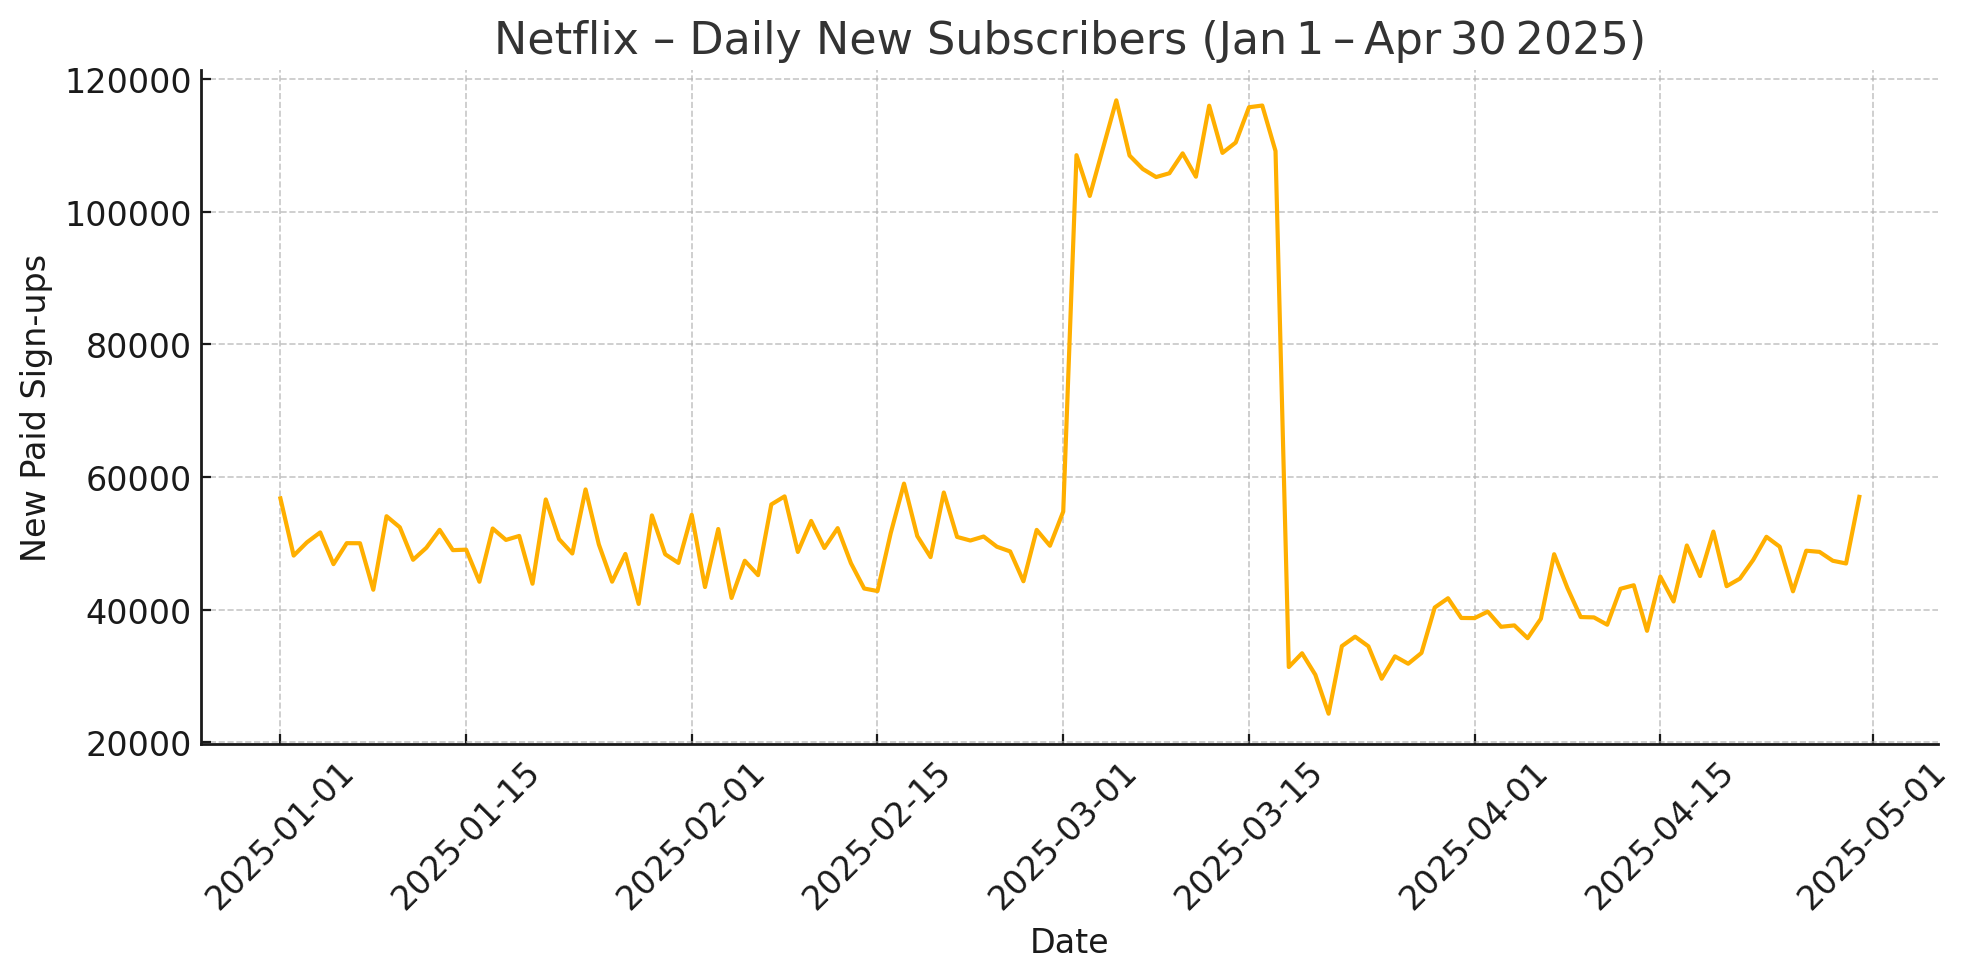
Let’s say you’re a growth analyst at Netflix, and you see the following chart. What hypotheses could explain this trend, and how would you validate them?
.
.
.
.
.
.
.
.
.
0:00:00
Let’s say you’re a growth analyst at Netflix, and you see the following chart. What hypotheses could explain this trend, and how would you validate them?
Comments